HAL Id: insu-02177986
https://hal-insu.archives-ouvertes.fr/insu-02177986
Submitted on 9 Jul 2019
HAL is a multi-disciplinary open access
archive for the deposit and dissemination of
sci-entific research documents, whether they are
pub-lished or not. The documents may come from
teaching and research institutions in France or
abroad, or from public or private research centers.
L’archive ouverte pluridisciplinaire HAL, est
destinée au dépôt et à la diffusion de documents
scientifiques de niveau recherche, publiés ou non,
émanant des établissements d’enseignement et de
recherche français ou étrangers, des laboratoires
publics ou privés.
Crustal thickness of V-shaped ridges south of the
Azores: Interaction of the Mid-Atlantic Ridge
(36ø-39øN) and the Azores hot spot
Javier Escartin, Mathilde Cannat, Gaud Pouliquen, Aline Rabain, Jian Lin
To cite this version:
Javier Escartin, Mathilde Cannat, Gaud Pouliquen, Aline Rabain, Jian Lin. Crustal thickness of
V-shaped ridges south of the Azores: Interaction of the Mid-Atlantic Ridge (36ø-39øN) and the Azores
hot spot. Journal of Geophysical Research, American Geophysical Union, 2001, 106 (B10), pp.719-740.
�insu-02177986�
JOURNAL OF GEOPHYSICAL RESEARCH, VOL. 106, NO. B10, PAGES 21,719-21,735, OCTOBER 10, 2001
Crustal thickness of V-shaped ridges south of the Azores:
Interaction of the Mid-Atlantic Ridge (36ø-39øN) and the
Azores hot spot
Javier Escartin,
Mathilde Cannat, Gaud Pouliquen,
and Aline Rabain
Laboratoire de G6osciences Marines, Institut de Physique du Globe-CNRS-Universit6 P6 and P7, Paris, France
Jian Lin
Woods Hole Oceanographic Institution, Woods Hole, Massachusetts, USA
Abstract. V-shaped ridges propagating along the Mid-Atlantic Ridge axis south of the Azores and Iceland hot spots indicate that ridge-hot spot interactions produce temporal and spatial variations in melt supply to the ridge axis. Estimates of relative crustal thickness variations associated with the ridges south of the Azores hot spots, based on gravity and bathymetry data collected during the SudAqores cruise (1998), provide constraints on the rate of propagation of these melt anomalies and on the variations in melt production along the axis and in time. The maximum apparent crustal thickness along the Azores V ridge is -14 km near the Azores,
decreasing to normal crustal thickness of-6 km toward the south. This crustal thickness
variation may be explained by enhanced melt production associated with the propagation of a mantle temperature anomaly that initiated -10 Myr ago at the Azores hot spot. The temperature anomaly decreased as it propagated southward, reaching ambient mantle temperatures at the present time at its predicted location under the axis. The excess melt was emplaced on axis forming discrete, shallow (<1000 m) oceanic plateaus (•100 km in diameter at •37.5øN) that are isostatically compensated. The numerous seamounts, lack of normal faults, and smooth
basement at the summit of these plateaus suggest high effusion rates that persisted for -5 Myr or less, with little or no tectonic strain. As the melt anomaly propagated along axis, the magmatic activity at the plateaus ceased, resulting in rifting of the plateau and onset of normal seafloor spreading. The variations in crustal thickness inferred for the V ridges south of the Azores are at least twice that inferred for the Iceland structures. In both cases the V ridges record temporal variations in temperature and/or mantle flux that affect melt production under the ridge axis, but the fluctuations are larger for the Azores than for the Iceland hot spot.
1. Introduction
The interaction of hot spots with nearby mid-ocean ridges
strongly modifies melting of the mantle under the ridge and the
accretion of the oceanic crust [e.g., Schilling et al., 1983]. This
ridge-hot spot interaction typically results in shallower seafloor and thicker crust than expected for normal seafloor spreading
away from hot spots, as observed over Iceland or the Azores along the Mid-Atlantic Ridge (MAR). These bathymetric and gravity anomalies extend several hundred kilometers along the axis and away from hot spots [Cochran and Talwani, 1978; Le Douaran and Francheteau, 1981; Ito and Lin, 1995a, 1995b],
indicating increased mantle temperatures and melt production towards the hot spot. The geochemical signature of hot spots (indicated by major element, trace element, and isotope ratios in basalts sampled along the axis [e.g., Schilling eta/., 1983; Dosso eta/., 1999]) has a shorter along-axis extent. For example, the Azores hot spot produces a bathymetric anomaly extending along
-•2000 km of the MAR axis (from-•40øN to the Kane Fracture
Copyright 2001 by the American Geophysical Union. Paper number 2001JB000224.
0148-0227/01/2001JB 000224 $09.00
Zone at -•24øN) compared with the geochemical anomaly of
-•1000 km (from-40øN to the Hayes Fracture Zone at-•33.5øN).
The differences in along-axis extent between the geochemical
and geophysical signatures indicate that melting processes may
be partially decoupled from larger-scale thermal effects of hot spots.
Laboratory [e.g., Kincaid eta/., 1995], theoretical [Ribe et al., 1995; Ribe, 1996; Sleep, 1996; Ribe and Delattre, 1998], and numerical studies [e.g., Yale and Phipps Morgan, 1998; Ito et a/., 1999] have shown that the interaction of mantle plumes with nearby mid-ocean ridges is complex and not fully understood. The effect of hot spots on ridge bathymetry and melt production depends primarily on the flux of the plume (mainly a function of the temperature anomaly and diameter of the plume), viscosity structure of the mantle, spreading rate of nearby mid-ocean
ridges, and relative motion of the ridge with respect to the plume. In the case of the northern MAR, the mantle temperature anomalies required to explain the geophysical (bathymetry and
gravity) and geochemical observations are -180øC and-70øC for Iceland and the Azores, respectively [Ito and Lin, 1995b; Ito et
al., 1999]. These differences in temperature anomalies are consistent with Iceland being one of the hot spots with largest fiux [Sleep, 1990; Schilling, 1991]. Ridge-hot spot interaction
can vary at long timescales as a consequence of the motion of the
21,720
ESCART•N
ET AL.: V-SHAPED
RIDGES
AND AZORES-MAR
INTERACTION
50øN 40øN 30øN 20øN 60øW 45øW 30øW 15øW 40øW 36øW 32øWO½½•ll'lO
NAM
... ...Fig. !b...
'EUR
t10 km/Ma
28øW
Figure 1. (a) Location of the study area, SW of the Azores and immediately south of the North American (NAM)-Eurasian (EUR)-African (AFR) triple junction. Double line shows the location of the ridge axis, and the heavy and light lines the off axis traces of fracture zones and nontransform offsets. Inset shows the relative (solid lines) and absolute motions of the NAM, AFR, and EUR plates and of the NAM-AFR and NAM-EUR ridges
(dashed lines), using the HS1-NUVEL2 [Gripp and Gordon, 1990]. These velocities are calculated for 37.5øN and
32.5øW, corresponding approximately to the center of Lucky Strike segment (Plate 2). (b) Ship tracks from the Sudafores cruise [Carmat et al., 1999] (bold lines), the FARA-SIGMAcruise [Detrick et al., 1995], and along ship tracks from the NGDC database (thinner lines). The compilation and data analysis have been done over an area larger than that of the analysis presented in this paper.
40øN
36øN
32øN
ridge relative to hot spots [e.g., Ribe and Delattre, 1998]. The migration of the GaNpagos hot spot away from the Cocos-Nazca Ridge may explain the decrease in the apparent axial thermal anomaly from -90 ø to -25øC during the past-8 Myr [Ito and
Lin, 1995b].
Variability in ridge-hot spot interactions at timescales of <5 Myr has been reported for both the Iceland and Azores hot spots. Vogt [1976, 1979] interpreted a series of shallow bathymetric ridges emanating from the Azores and forming a southward propagating V (V-shaped ridges) as evidence for flow of hot spot material along the axis. These structures can be identified on the
satellite free-air gravity data [Sandwell and Smirk 1997] (Faial
and Flores Ridges from Vogt[1979], Plate 1, top) and are similar
to a series of V-shaped ridges south of Iceland (Plate 1, bottom). V-shaped ridges may be caused by fluctuations in mantle temperature [ White eta/., 1995] or by along-axis flow of mantle asthenosphere below the ridge [e.g., Vog• 1979] with a
periodicity of 2-3 Myr [ Vog• 1976, 1979]. The inferred rates of
along-axis propagation are - 100-200 mm/yr [ Vog• 1971; White et al., 1995] and -•60 mm/yr [Cannat et al., 1999] for the Iceland and Azores V ridges, respectively.
The general structure, geodynamic setting, and tectonic
evolution during the last 10 Myr of the V-shaped ridges south of the Azores have been constrained using shipboard geophysical
data from a recent cruise on board R/VL'Atalante [Carmat et al.,
1999]. In this paper we present a detailed analysis of bathymetry
and gravity data to constrain regional changes in crustal thickness, which are interpreted as melt production variations
with distance from the hot spot (along axis) and in time (across
axis). Early work by Vogt [1976, 1979] on these structures south
of Iceland and the Azores was based solely on sparse bathymetry data. More recent estimates of temporal variations in mantle
temperature anomalies south of Iceland [ White eta/., 1995] used
limited seismic crustal thickness estimates [Ritzerr and Jacoby,
1985; Smallwood eta/., 1995] and existing satellite gravity data [Sandwell and Smith, 1997] (Plate 1). The study of Cannat et al.
[1999] and the one presented here provide to date the most
detailed constraints on structure, crustal thickness and tectonic evolution of V-shaped ridges resulting from the interaction of the Azores hot spot with the northern MAR.
2. Tectonic Setting and Geological Background
An area immediately south of the Azores platform was surveyed during the SudAqores cruise on board R/V l•4tlante(France) in June-July 1998 [Cannat et al., 1999], extending off
axis the earlier survey of Derrick et al. [ 1995] (location and ship tracks in Figure 1). The study area covers the ridge axis between -36øN and -39øN (Figure 2), over the AMAR, French-American Mid-Ocean Undersea Study (FAMOUS), North FAMOUS, Lucky Strike, Menez Gwenn, and Princess Alice segments (PO-
4, PO-3, PO-2, PO-1, KP-5, and KP-4 segments of Derrick et al.
[1995]). The survey extends off axis to -10 Ma old oceanic
crust, over the Faial and Flores Ridges, which form the V-shaped
ridges propagating southward from the Azores (Plates 1 and 2).
The west branch of the V ridge is surveyed off the FAMOUS,
North FAMOUS, and Lucky Strike segments, while the coverage of the east branch is more complete, extending close to the
Azores Islands off the Princess Alice segment (Figure 1 and Plate 2).
The study area is immediately south of the present location of the North America/Eurasia/Africa triple junction at-38ø50'N
(Faial Fracture Zone (FZ)), which shifted from its original position at-•38øN (East Azores FZ) [Luis et al., 1994; Searle, 1980]. The present full spreading rate at 37.5øN (Lucky Strike segment) is-20.3 mm/yr on a 103 ø azimuth (HS1-NUVEL2 model [Gripp and Gordon, 1990]), with highly asymmetric accretion along the FAMOUS segment during the last 0.7 Myr (7 mm/yr to the west and 13.4 mm/yr to the east [Macdonald, 1977]). The recent spreading history of the area is complex, with variations in polarity of asymmetry [Macdonald, 1977] and in spreading rate and direction of spreading during the last 10 Ma
ESCART•N ET AL.' V-SHAPED RIDGES AND AZORES-MAR INTERACTION 21,721
[Sloan and Patriat, 1992; Luis et al., 1994; Cannat et al., 1999]. The absolute motion of the ridge axis relative to the Azores hot spot is -20 mm/yr along a---250 ø azimuth (see inset in Figure 1).
The Azores hot spot produces a long-wavelength bathymetry and gravity gradient (---4 m/km, >20-3 mGal/100 km, respectively) between 33øN and 39øN, with a minimum depth and gravity anomaly over the Azores Platform at-39øN [Detdck et al., 1995]. A similar gradient in axial bathymetry and gravity is observed from -40.5øN to 45øN [Goslin and Party', 1999]. The hot spot signature in trace element and isotope ratios [Schilling et al., 1983; Schilling, 1986; Dosso et al., 1999] extends to the Hayes FZ at 33.5øN and is highly asymmetric towards the north
[Godin and Party', 1999]. Morphologically, an axial high and lack of a clear axial valley (Plate 2) characterize segments north of the 37.5 ø offset (Menez Gwenn, Princess Alice, Plate 2). The Lucky Strike segment shows a transitional morphology, with the
disappearance of the axial valley at its center and with evidence for recent volcanism [Ondreas et al., 1997]. The segments south of the 37.2øN discontinuity (North FAMOUS, FAMOUS, and
AMAR, Plate 2) show well-developed axial valleys and outcrops of serpentinized peridotRes associated with low-temperature hydrothermalism (i.e., south of FAMOUS [Gr•cia et al., 2000]). As the spreading rate does not change substantially throughout the area, these variations in geology and ridge morphology may be attributed to hot spot-induced changes in thermal regime and/or magma supply for each of these segments [Detrick et al., 1995]. To first order, this observation is supported by apparently high amounts of neovolcanism along the Menez Gwenn and Lucky Strike segments relative to the other segments [Parson et al., 2000] and by the presence of high-temperature hydrothermalism (>220øC-330øC) at these two segments [Fouquet et al., 1994; Wilson et al., 1996; Langmuir et al., 1997] compared with lower-temperature hydrothermalism along the FAMOUS and AMAR segments and discontinuities [Bougault et
al., 1998; Gr•cia et al., 2000].
Systematic segment-scale variations in depth and gravity are superimposed on the long-wavelength hot spot gradient. All the segments are associated with centered axial highs and mantle Bouguer gravity lows, indicating focused magmatic accretion [Lin et al., 1990] and representing crustal thickness variations of -2 km in amplitude [Detrick et al., 1995]. Despite the proximity to the hostspot, the outcrop of peridotRes at or near numerous discontinuities [Gr•cia et al., 2000] suggests that the thin crust at segment ends is heterogeneous (composed of peridotite and gabbro and capped by basalt), as inferred for other MAR segments away from the influence of the Azores hot spot [Cannat et al., 1995].
The ridge segmentation history can be traced back from the
present time to -10 Ma or less, as the traces of the nontransform
offset can only be followed to the inner walls of the V ridges off axis, with no evidence of continuity further off axis (see Plates 1 and 2). The faulted abyssal hill terrain within the V-ridges is similar to that found elsewhere along the MAR [e.g., Tucholke et al., 1997], with an abrupt transition to the smooth (unfaulted), shallow (<1.5 km) seafloor along the V ridges, which contain numerous seamounts. Off axis of the Lucky Strike segment the
transition is parallel to the axis, while off North FAMOUS it is
highly oblique (-45 ø to spreading, Plate 2). Reconstruction based on magnetic anomalies shows a large (>100 km in diameter) oceanic plateau (named Jussieu Plateau hereafter, Plate 2) rifted asymmetrically---3.9-5.7 Ma [Pouliquen et al., 1998; Cannat et al., 1999]. Assuming that Princess Alice Bank is part of a similar rifled oceanic plateau and lacking data over its conjugate side to
the west (Plate 2) to better constrain the tectonic history of the area, the estimated time of rifting was 5.7-7 Ma [Cannat et al., 1999]. The temporal and spatial variations in melt production and mode of crustal construction are quantified below, in order to constrain the temporal variability in melt supply to the axis associated with the interaction of the Azores hot spot with the
MAR.
3. Data Collection and Processing
Bathymetry, gravity, magnetic and six-channel seismic data were collected on board R/V L'Atalante. The surveyed area covered the ridge between 36040 ' and 38øN, and extended over Princess Alice Bank, near the Azores, following the east branch
of the V-shaped ridge (Plate 2). Ship tracks were run subparallel
to the spreading direction (-104 ø for the Lucky Strike area), spaced between 7.4 and 8.3 km. Additional shorter tracks were
run to fill bathymetry gaps in shallow areas and during dredging
operations, and across track, during transits (Figure 1 and Plate
2). The data were complemented with multibeam bathymetry
and gravity from the FARA-SIGMA cruise [Detrick et al., 1995]
and with ship track data from the National Geophysical Data
Center (NGDC) database (Figure 1):
1. Bathymetry data were acquired with a SIMRAD EM-12 multibeam system [Cannat et al., 1999] and combined with the data from the FARA-SIGMA cruises [Detrick eta[. 1995]. The CARAIBES software (Institut Fran•aise de la Recherche pour l'Exploitation de la Mer, France) was used to process the data on
board and to obtain bathymetry grids at-100-m grid spacing
(Plate 2).
2. Gravity data were recorded with a Bodenseewerk GSS30 gravimeter. The E6Wos and drift corrections were removed to obtain the free-air gravity anomaly (FAA). The rms crossover
error for the cruise data was -1.8 mGal. FAA data from the
FARA-SIGMAcruises [Detrick et al., 1995] and the NGDC data catalog were manually edited to remove bad profiles and data points and shifted to a common base level using the satellite- derived FAA as a reference field. The resulting rms crossover error of the combined data sets was---2.5 regal. The FAA ship track data were gridded at l' using a minimum surface tension algorithm [ Wessel and Smith, 1991]. The resulting FAA map (Figure 2a) reflects primarily the effect of seafloor bathymetry.
3. Total magnetic field was measured at 6-s intervals with a Berringer proton magnetometer towed ---325 m behind the ship. Magnetic anomalies were calculated using the 1995 Intemational Georeference Magnetic Field [International Association of Geomagnetism and Aeronomy, 1996]. The root-mean-squar (RMS) error at crossover of tracks was-15 nT. Details of the processing and interpretation of the magnetic data will be given in a later paper, and only the interpreted magnetic anomalies [Pouliquen et al., 1998; Cannat et al., 1999] will be used in this
study.
4. Thermal Modeling, Seafloor Subsidence, and
Residual Bathymetry
The cooling of the lithosphere as it ages causes an important long-wavelength effect on both bathymetry and gravity. This effect can be predicted using a three-dimensional (3-D) passive mantle upwelling model [Phipps Morgan and Forsyth, 1988] and
then removed from the data to obtain a residual bathymetry.
21,722 ESCART[N ET AL.' V-SHAPED RIDGES AND AZORES-MAR INTERACTION 39øN
Azores
36øNgr•phe
p
orbs 33ON ßa•,e FZ
39øW
36ow
33øW
30øW
27øW
Iceland
60'I'4
Charlie.
Gibbs
4 4 440'W
16
øW
36øW 32ow 28øW 24øW 20øW
... -75 -4 6 15 20 28 34 40 45 70 100 205FAA (mGal)
Plate
1. Comparison
of the
V-shaped
ridges
propagating
south
of (top)
the
Azores
and
(bottom)
Iceland
hot
spots,
indicated
by
the
black
triangles.
Iceland
V-shaped
ridges
are
more
continuous,
linear
and
longer
than
the
one
found
south
of the
Azores.
The
free-air
satellite
gravity
data
(FAA)
are
from
Sandwell
and
Smith
[ 1997].
The
box
on
the
Azores
panel
indicates
the
approximate
position
of the
maps
in Plate
2 and
Figures
2-5, and
the
across-axis
lines
ESCARTIN ET AL.: V-SHAPED RIDGES AND AZORES-MAR INTERACTION 21,723
(tu)!) tlldea
ß
'-'
o
4'0
o 4- 7 .%ESCART•N ET AL.' V-SHAPED RIDGES AND AZORES-MAR INTERACTION 21,725
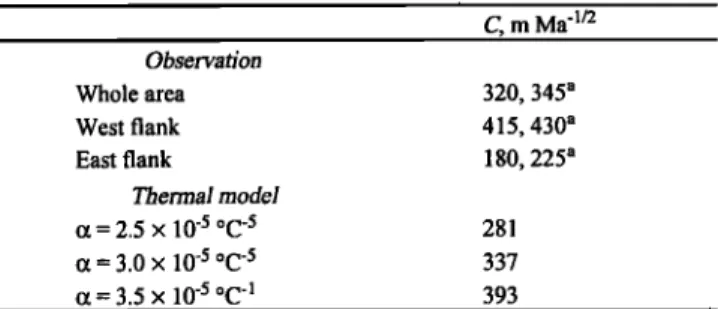
Table 1. Observed and Modeled Subsidence Rates
C, m Ma '1/2 Observation Whole area 320, 345 a West flank 415, 430 a East flank 180, 225 a Thermal model ot = 2.5 x 10 -5 øC-5 281 ot = 3.0 x 10 -5 øC-5 337 c• = 3.5 x 10 -5 øC-1 393
aEstimates are calculated using both ship track (first entry) and gridded bathymetry (second entry) data. See text for discussion.
thickness variations and mantle density changes that are not
associated with cooling. The predicted subsidence rate depends
primarily on the ridge segmentation geometry and on the
coefficient of thermal expansion (z of the mantle, which allows the conversion of the 3-D •nantle temperature field into density. Subsidence rates for the study area have been calculated using the compiled bathymetry (Figure lb) and available digital seafloor
age [Miiller et al., 1997], using a simple square root of age t
dependence of the bathymetry h [Parsons and Sclater, 1977]:
h=C
x t 1/2
+ ht=
O,
where
ht=_
0 corresponds
to the zero-age
axial
depth
and C is the
subsidence rate. As data are sparse and inhomogeneously distributed (Figure 1), we use two estimates of C, one grouping all the data along ship tracks for the west flank, east flank, andthe whole area, and another using a coarse 2-minute bathymetry
grid over the same areas. The axial valley, which may be dynamically supported [Neumann and Forsyth, 1993], the shallow V-shaped ridges off axis (Plates 1 and 2), and the nearby Atlantis-Meteor seamount complex [ Verhoeœ and Collette, 1985] have not been included, as these features reflect processes
different from subsidence with age of normal oceanic crust.
Subsidence rate C for the area is highly asymmetric, with an
average value (320-345 m Myr '1/2) consistent with global and Atlantic averages (350 m Myr -m [Parsons and Sclater, 1977] and m Myr -1/2 [Malinvemo, 1990], respectively). This average C
value is consistent with (z = 3.0 x 10 's øC'• (Table 1, Figure 3a), and will be used in the gravity calculations (see below and Figure
3). Cvalues
on the west
flank
(415-430
m Myr
-1/2)
double
those
on the East flank (180-225 m Myr'•/2), and may be more
consistent with model subsidence rates for c• = 3.5 and 2.5 x 10 's
øC-l, respectively (see Table 1 and Figure 3). Asymmetric
subsidence may be caused by asymmetric mantle flow under the ridge due to the absolute ridge motion (-20 mm/yr in a 250 ø azimuth, comparable to the full spreading rate, Figure 1) that is not predicted by passive flow models with symmetrical spreading
[e.g., Phipps Morgan and Forsyth, 1988].
5. Mantle Bouguer and Residual Mantle Bouguer
Gravity Anomalies
The FAA gravity data (Figure 2a) are reduced to obtain
mantle Bouguer and residual mantle Bouguer
anomalies
(MBA and RMBA, respectively)
following
the procedures
described by Prince and Forsyth [1988] and Kuo and Forsyth
[1988]. The gravity effects of the water-crust
and crust-
mantle density interfaces were calculated using Parker's
[1973] upward
continuation
method,
then removed
from the
FAA at each point along ship tracks (Figure 3), and gridded in
the same fashion as the FAA to obtain the MBA grid [Cannat
et al., 1999, Figure 1]. Densities, crustal thickness, and other
parameters
used
in the calculations
are given
in Table
2.
The gravity effects
of cooling
with age and ridge offset
intersections in Figure 2c were calculated using a 3-D passive
upwelling
model
[Phipps
Morgan
and Forsyth,
1988]
and
c• =
3.0 x 10
'5 øC'l (Figure
2b). The thermal
correction
was
removed from the MBA at each point along ship tracks
(Figure
3b) and gridded
to obtain
the RMBA grid in Figure
2c. The RMBA reflects primarily variations in crustal thickness and/or density [Lin and Phipps Morgan, 1992;
Sparks
and Parmentier,
1993] and/or
upper
mantle
density
variations. It also preserves the long-wavelength along-axis
gravity gradient
(Figure 2c) associated
with the Azores
hot
spot [e.g., Derrick et al., 1995].
The RMBA map (Figure 2c) shows that the off axis gravity
lows correlate with the shallow areas of the V-shaped ridge. The
largest gravity low (>100 mGal in amplitude) is associated with
the Princess Alice Bank to the north, extends continuously
toward the southwest, and disappears at-36.5øN, coinciding with
the southern termination of the east branch of the V-shaped ridge and its intersection with the axis (Plate 2). The gravity low on
the west flank (>70 mGal) is associated with the west Jussieu Plateau (Figure 2c and Plate 2), also extends toward the southwest, and disappears off the AMAR segment. A series of small gravity highs and lows (-10-20 mGal in amplitude) are
located at the discontinuities between segments and at the center
of segments, respectively, as shown earlier by Derrick et al. [1995]. The amplitude of these axial variations in gravity and
Figure 2. (a) Free-air gravity map of the study area. Double lines in this and following panels mark the axis of ridge segments. The bold lines in all the panels correspond to the 2500- and 1000-m isobaths (see Plate 2). (b)
Calculated thermal gravity correction from a passive 3-D mantle upwelling model [Phipps Morgan and Parmentier,
1988]. See text for discussion and model parameters. (c) Residual mantle Bouguer gravity anomaly (RMBA) calculated after removing the thermal gravity effect in Figure 2b from the mantle Bouguer gravity anomaly (not shown; see Figure lc of Cannat et al. [1999]). Note the large gravity lows (-100 and -80 mGal in amplitude)
associated with the shallow Princess Alice and east Jussieu Plateaus (Plate 2). The along-axis variations in the
gravity structure associated with ridge segmentation have a lower amplitude (<40 mGal). (d) Airy residual mantle Bouguer gravity anomaly (Airy RMBA) calculated after removing the gravity effects of an isostatically compensated crust and the thermal effect in Figure 2b from the FAA (see Figure 3b and text for details). The lack of gravity structure and the small amplitude of the gravity anomaly off axis indicate that the V-shaped ridges are isostatically compensated. The gravity low associated with the axial valley is due to the dynamic support of the rift,
21,726 ESCARTiN ET AL.: V-SHAPED RIDGES AND AZORES-MAR INTERACTION -33 ø -32 ø -31 o 0 "•2 3 , ß - lOO oE 50
ø
-50 , , I , , I , , I6.0 C)
Gravity-derived
"t
/• •crustal
thickness
'/
.
I Airy
,
crust•l
,\
I
,.'x
t-
1.5 t thickness -k I X/'N / •x / '] '-• /-'•-.
',.,,./
•o.o
-3.0 . i i i -33 ø -32 ø -31 o Longitude (øW)Figure 3. Bathymetry, gravity, and relative crustal thickness profiles across the Lucky Strike segment (see profile location in Plate 2 and Figure 5). (a) Observed and residual bathymetry, calculated after removing the thermal subsidence. Thermal calculations for three different thermal expansion coefficients for the mantle are shown. (b) Observed free-air gravity anomaly (FAA), mantle Bouguer anomaly (MBA), Airy MBA, residual MBA (RMBA), and Airy RMBA. The "standard" and the Airy Bouguer anomalies are calculated assuming a constant thickness and a variable crustal thickness isostatically compensated, respectively. The residual Bouguer anomalies are calculated after removing the thermal correction of the mantle (dotted line). See text for details. (c) Relative crustal thickness calculated by downward continuation of the RMBA (Figures 2c, 3b, and 4; see text for details) and the isostatically compensated crustal thickness. The crustal thickness is relative to a standard, 6-km- thick oceanic crust (see Figure 4).
their good correlation with segmentation are common in other portions of the MAR [Lin et al., 1990; Detrick et al., 1995; Escartin and Lin, 1998] and indicate focused magmatic accretion at the axis [Lin et al., 1990]. There is no correlation between the
axial and off axis gravity structure, indicating that the present segmentation and associated focused magma supply were established after the rifting of the volcanic plateaus that form the
present V-shaped ridge.
6. Residual Bathymetry, Airy Isostasy, and Airy
Bouguer Gravity Anomalies
To determine the mode of compensation of the crust, we
correct the observed FAA for the predicted gravity anomalies associated with a crust of variable thickness that is compensated locally (Airy isostasy) and cools with age and obtain an Airy
RMBA (Figures 2d and 3). The obtained Airy RMBA can be compared with the RMBA to determine if there is regional
isostatic compensation of the topography and crust. Assuming
Airy isostasy, the relief of the Moho M can be estimated as [ Turcotte and Schubert, 1982]:
M= ,4+ D PP/½m- P)
where
D is the bathymetry
isostatically
compensated;
Pv,,',
Pc, and
Pm are the densities of the water, crust, and mantle, respectively;
and A is a constant crustal thickness value. The total crustal
thickness is then M- D q- A. As the observed bathymetry reflects
seafloor subsidence with age, it is necessary to remove the
modeled thermal subsidence c• = 3.0 x 10 '5 øC -1, Table 1) from
the bathymetry (Figure l c) to obtain a residual bathymetry D (Figure 3a). Assuming that the residual bathymetry D is isostatically compensated, we calculate the Moho relief, M. An
average crustal density of 2750 kg m -3 was chosen for the crustal
thickness and gravity calculations (Table 2, dashed line in Figure 3c), although calculations for a wide range of crustal densities
(2500-2900 kg m -3) did not yield significantly different Airy
gravity anomalies. To estimate the absolute crustal thickness, we used a value of A = 6 km, which minimizes the differences between the crustal thickness required for Airy compensation and that predicted from the residual gravity data relative to a constant 6-km-thick crust (Figures 3c and 4). To calculate the Airy MBA and RMBA anomalies, we upward continued [Parker, 1973] the water-crust (bathymetry) and crust-mantle (calculated Moho relief M) interfaces, subtracted this crustal correction and the thermal gravity effect (Figure 2b) from the FAA at ship track points (Figure 3b), and gridded the data to obtain the Airy RMBA map in Figure 2d.
The Airy RMBA data over the V-shaped ridges show short- wavelength variations of small amplitude (<20 mGal, Figure 2c) that are uncorrelated with the topography (Plate 2) and lack the large gravity lows observed on the RMBA (Figure 2c). Along the ridge axis there is a strong correlation between Airy RMBA and ridge morphology. The Lucky Strike, North FAMOUS, FAMOUS, and AMAR segments have a prominent low in the Airy RMBA data that mimics the axial valley that characterizes these segments (Figure 2c). In contrast, the Airy RMBA
Table 2. Parameters Used in the Thermal model, Gravity Calculations, and Crustal Thickness Inversion
Parameter Value Gravitational constant, N m 2 kg -2 Gravitational acceleration, m '2 s -• Water density, kg m -3 Crustal density, kg m -3 Mantle density, kg m -3 Crustal thickness, km -3 Half-spreading rate, km Ma -• Thermal boundary layer thickness, km
Asthenospheric temperature, øC
Coefficient of thermal expansion, øC-•
6.6673 x 10 -•] 9.80 1030 2750 3300 6 12 100 1350 3.0 x 10 -5
ESCARTiN ET AL.' V-SHAPED RIDGES AND AZORES-MAR INTERACTION 21,727
Relative crustal thickness
•6 ,,:'3 0 .3 "6 .9
km
Figure 4. Crustal thickness variations across the area relative to a constant-•6-km-thick oceanic crust (see text for details of calculation). The off axis V-shaped ridges are associated with thick crust. Maximum relative crustal
thickness on the east branch is •-9 km (Princess Alice plateau), tapering to normal thickness toward the SW (-•0
km); the crustal thickness over the west Jussieu Plateau is -•6 kin. Crustal thickness variations along individual ridge segments (double lines) are similar to those seen elsewhere along other Mid-Atlantic ridge segments.
Contours every 0.5 km.
signature of the Menez Gwenn and Princess Alice segments, characterized instead by an axial high (Plate 2), is similar to that
t•)und elsewhere off axis. These results indicate that the V-
shaped ridges are isostatically compensated, while the axial valley is dynamically supported [e.g., Neumann and Forsy'th,
1993]. Short-wavelength and small-amplitude variations in the
Airy RMBA may reflect a small degree of dynamic support locally and/or to variations in crustal density unaccounted for by
the assumed constant-density model (Table 2). These observations are consistent with the on-axis emplacement of an oceanic plateau over weak, young oceanic lithosphere.
7. Crustal Thickness
Relative crustal thickness variations were calculated by
downward continuation of the RMBA [Parker and Huestis, 1974] (see model parameters in Table 2), using a low-pass cosine
taper filter beginning at 35-kin wavelength with a cutoff at 25-km wavelength to ensure convergence (Figures 3 and 4). The overall crustal thickness pattern closely mimics the RMBA map (Figure
2c). A maximum relative crustal thickness of-9 km is found
over the shallow Princess Alice Plateau (Plate 2) and the associated gravity low (Figure 2c), and decreases to -0 km toward the southwest end along the east branch of the V-shaped
ridge. The relative crustal thickness associated with the west
Jussieu Plateau is-6 kin, also decreasing toward the south to
normal crustal thickness. Minimum crustal thicknesses are found
at ridge offsets near the axis, and the predicted variations in crustal thicknesses along individual ridge segments are -•2 km in amplitude.
Gravity-derived crustal thickness is nonunique and model dependent, although it provides constraints on crustal thickness
variations regionally. Gravity data at segment OH1 (35øN, MAR) are generally in good agreement with seismically determined
thicknesses (within •-1 km or less) [Canales et al., 2000], indicating that seismic- and gravity-derived first-order variations
in crustal thickness are well constrained. The outcrop of
serpentinized peridotites [Goad and Karson, 1985; Gr3cia et al., 2000] indicates that the crust is heterogeneous [e.g., Cannat et al., 1995] and that the magmatic crustal thickness may be overestimated. In contrast, filtering and smoothing of the gravity data may result instead in an underestimation of crustal thickness variations when compared with seismic estimates, particularly at ridge offsets or inside corners where the crust is thinnest [e.g.,
Minshull, 1996; Escartin and Lin, 1998]. Thus we believe that
gravity data provide constraints on crustal thickness variations
with an accuracy of the order of 1 km.
8. Temporal and Spatial Variations in Magma
Supply
Crustal thickness variations and magnetic data (Figure 5) are
used to determine spatial and temporal variations in melt supply to the ridge. These data constrain the present-day and temporal evolution of the Azores hot spot in terms of crustal production along the Mid-Atlantic Ridge, the possible fluctuation in temperature of the mantle associated with the hot spot, and the mode of eraplacement of the excess melt responsible for the
formation of the V-shaped ridges.
8.1. Present-Day Ridge Segmentation and Crustal
Thickness Variations
The morphology of the axial valley along individual ridge segments depends on the distance to the hot spot. Lucky Strike
21,728
ESCART•N
ET AL.: V-SHAPED
RIDGES
AND AZORES-MAR
INTERACTION
Anonrelies
•7•
2A
3 (3.9 Ma){2,5
Ma)
t 3A
4 (ZO Ma)(5.7
Ma)
0 4A a 5 (1½ t Ma) FAMOUS Strike o,0 AMAR --4,0
Figure
5. Interpreted
magnetic
anomalies
from
shipboard
magnetic
profiles.
The
data
from
the
SudAfores
cruise
[Cannat
et
al.,
1999]
are
complemented
on
the
northern
part
with
anomaly
picks
from
an
aeromagnetic
survey
[Luis
et
aL,
1994].
The
solid
lines
correspond
to
the
profiles
in Figures
6 and
7.
-2
a) West flank & axis
b) East flank & axis
150 100 50 0 150 100 50 0
Residual topography ." ... " ...
A: AMAR F: FAMOUS N: North Famous
I•,Lucky
ß Menez GwennStrike
Gravity-derived
crustal
thi&ness
•.•
' A i'•v crtt,•at thickness ...•'•4 -2
150 100 50 0 150 100 50 0
Distance along-axis (km)
Figure 6. Depth and relative crustal thickness for the profiles running over the (a) western and (b) eastern branches of the Azores V-shaped ridge (light shaded area), compared with the axial profile (dark shaded area) for reference. The vertical scale of the relative crustal thickness plots is inverted to mimic the depth to Moho. The dashed lines correspond (top) to the residual bathymetry along the V-shaped ridges and (bottom) to the isostatically compensated crustal thickness. The off axis profiles show the the shallow topography of the V-shaped ridges is well correlated with thick crust. There is a clear lack of correlation between the present-day variations in bathymetry and crustal thickness along the ridge segments and that off axis. There is also good agreement between the gravity-derived and the Airy crustal thickness, indicating that most of the topography and overthickened crust of the V-shaped ridges are compensated isostatically. Crustal thickness over the Lucky Strike segment, determined from early refraction studies [Fowler and Mathews, 1974; Fowler, 1976; Poehls, 1974], is estimated to -•6-7 km (white and thin line boxes labeled "seis."). These estimates provide a constraint in absolute crustal thickness that
ESCART•N ET AL.' V-SHAPED RIDGES AND AZORES-MAR INTERACTION 21,729
shows a transitional morphology, with the disappearance of the axial valley at the segment center, while the segments to the north show an axial high, and those to the south show an axial valley (Plate 2). In all cases the crust is -2 km thicker at the segment center than at the ends (Figure 6; crustal thickness patterns
presented are almost identical to those of Detrick et al. [1995] from near-axis data), indicating focused magmatic accretion [e.g., Linet al., 1990].
A gradual increase in the average crustal thickness northward suggests an augmentation in melt supply to individual ridge
segments towards the Azores hot spot. The relative crustal thickness inferred from gravity for the FAMOUS, Lucky Strike, Menez Gwenn, and Princess Alice segments are 0.1, 0.6, 1.0, and 2.23 km in average, respectively. Limited seismic data available in the study and nearby areas show a similar trend. The average crustal thickness of segments OH3, OH2, and OH1 (35.5 ø- 33.5øN, MAR) are 5.0 km, 5.4 km (6.1 km off axis) to 5.5 km (6.0 km off axis), respectively [Canales et al., 2000; Hooœt eta/., 2000], gradually increasing toward the north. Early seismic
refraction data at Lucky Strike indicate an average crustal
thickness of-6-7 km [Fowler and Mathews, 1974; Fowler, 1976; Poehls, 1974], consistent with the -•6.6 q- 1 km inferred from gravity (assuming a reference crust of 6 km, Figure 6). The increase in average crustal thickness is also accompanied by an increase in the amplitude of crustal thickness variations along individual ridge segments (Figure 6), indicative of more efficient
focusing of the magmatic accretion. The change in ridge
morphology around Lucky Strike and the presence of high- temperature hydrothermalism [Fouquet et al., 1994; Wilson et al., 1996; Langmuir et al., 1997] associated with evidence for recent volcanism [Ondreas et al., 1997; Parson et al., 2000] along Lucky Strike and Menez Gwenn segments are consistent with a hotter thermal structure of the lithosphere toward the Azores hot
spot.
Part of the inferred increase in crustal thickness along the study area may be caused by along-axis gravity and bathymetry gradients caused by thermal and/or dynamic support of the Azores hot spot, in addition to isostatic compensation of variable thickness crust. Ito and Lin [1995b] estimated that -70-75% of
the gravity and bathymetry gradients along the Cocos-Nazca Ridge may be attributed to crustal thickness variations caused by the Galfipagos hot spot. These results suggest that the thermal and/or dynamic contribution of the Azores hot spot on the
observed gradients may be small (<30% of the inferred crustal thickness variations). However, additional seismic constraints on crustal thickness between the AMAR and Princess Alice segments are required to quantify this thermal and/or dynamic
contribution.
8.2. Temporal and Spatial Variations in Magma Supply Comparison of the axial and the two off axis profiles over the summit of the V-shaped ridge (Figures 5 and 6) shows important variations in melt supply to the ridge axis both in space (along axis) and in time (across axis). The crust under the V-shaped
ridges is substantially thicker than normal oceanic crust, with
maxima under Princess Alice's and west Jussieu Plateaus (-9 and -6 km, respectively). The profile along the east branch of the V- ridge (Figure 6) shows a gradual decrease in the bathymetry and in relative crustal thickness away from the hot spot; this trend cannot be observed on the west branch owing to limited geophysical coverage of this flank (Figures 1 and 6). Smaller variations in crustal thickness, superimposed on the gradient along the V ridge, do not correlate with those along the ridge axis
segmentation or along the conjugate side (Figure 6). The asymmetry and lack of correlation between the bathymetry and gravity of the east and west branches (Plate 2 and Figure 6) may be attributed, at least partially, to the asymmetric rifting of the volcanic plateaus [Cannat et al., 1999] after their emplacement on-axis (see discussion below). Differences with the axial gravity structure also indicate that the accretion of the V-shaped
ridges was not organized along well established ridge segments
as observed today. The present-day segmentation history is not a
long-lived feature (< 10 Ma at Princess Alice segment, and <7 Ma at North FAMOUS and Lucky Strike segments), as geometry of the axis was organized after rifting of the volcanic V-shaped
ridges.
The relative crustal thickness map (Figure 4) and the seafloor
ages inferred from the magnetic anomalies (Figure 5) can be interpreted as spatial and temporal changes in melt supply to the ridge axis (crustal production). To quantify these variations, we have selected across-axis ship tracks subparallel or slightly oblique to the spreading direction and crossing near the center of each ridge segment (Figures 5 and 7). The average bathymetry
and crustal thickness are calculated for each profile and time
interval, determined from the position of picked or extrapolated
magnetic anomalies (Figures 5 and 7). When available, the bathymetry and crustal thickness of the west and east flanks are
averaged to quantify the total magmatic production, yielding estimates independent of asymmetric rifting, as observed along these V-shaped ridges [Cannat et al., 1999], or of asymmetric
accretion, commonly observed along the MAR [e.g., Macdonald,
1977; Allerton et al., 2000]. The average and maximum crustal thickness and bathymetry for different time intervals and for each
profile, shown in Figure 8, provide a record of temporal and
spatial variations of crustal accretion along the ridge axis.
The V-shaped ridges south of the Azores record the rapid
southward propagation (-60 km/Ma [Cannat et al, 1999]) of a magmatic pulse that initiated some 10 Myr ago [Cannat et al.,
1999]. The initiation of this pulse is recorded off Menez Gwenn
by the anomalously thick crust (>4-km excess crust with respect to normal 6-km-thick crust) prior to anomaly 5 (>10.1 Ma). The Azores hot spot is located <300 km east of the ridge axis, probably in the vicinity of Sao Miguel or nearby islands. As the absolute migration of the ridge is -20 km/Ma toward the southwest, the Azores hot spot was at or near the ridge axis at the
time of the formation of Princess Alice Plateau and the initiation
of the along-axis propagation of the mantle anomaly.
This melt anomaly propagated south, reaching excess crustal thickness of-3-4 km off Lucky Strike between anomalies 5 and 3A (10.1-5.7 Ma). At the same time, the maximum relative
crustal thickness (>6.5 km) found off Princess Alice (PA)
between anomalies 5 and 4 (10.1-7.0 Ma) decreased to normal relative thickness (-•1 km) between anomalies 4 and 3A (7.0-5.7 Ma). Between anomaly 3A and the present time the effect of the Azores hot spot is subdued, and the melt anomaly has weakened
and disappeared. The average bathymetry data (Figure 8) show a
pattern similar to that of the relative crustal thickness, consistent with the isostatic compensation of the crust inferred from the Airy RMBA (Figure 2d).
The maximum relative crustal thickness of >6.5 km at
Princess Alice Bank may indicate the time and location of the
highest melt supply to the ridge axis. Asymmetric rifting of the Princess Alice Bank is unconstrained lacking geophysical coverage over the conjugate west flank (Plate 2 and Figure 8),
and the inferred excess melt for this time period may be lower instead. Owing to the proximity to the Azores, ongoing
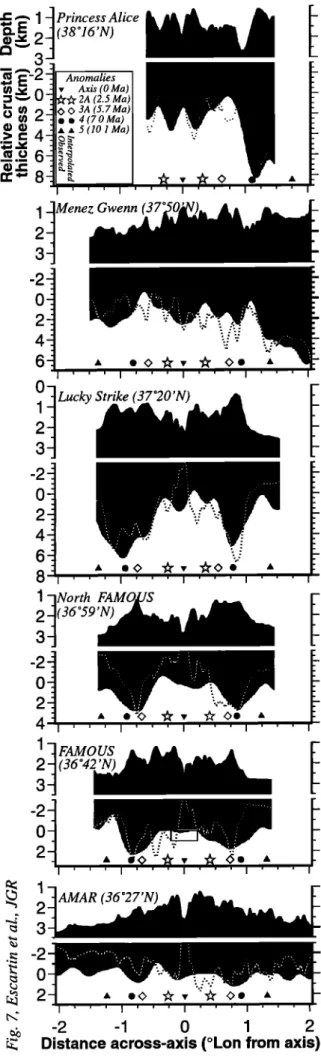
21,730 ESCART•N ET AL.' V-SHAPED RIDGES AND AZORES-MAR INTERACTION
O.
I=
(38ø16'N)
••'••[
•
._'llv
•[•4•r 2A (2.5 ma)Anomalies
Axis
(0
Ma)
• • 2-11oo
?lie • 4 (7.0 Ma)3A
(5.7Ma)
• -II
A
A
5
(10.1
Ma)
g 4:11•
•
:..:
' ' I ' ' ' I ' ' I ' ' ' Ii Menez
Gwenn
(37'
0 Lucky
1 2 3 . -2 _ o . 2 . 4 . 6 _8
, iA
, I ' '1
l¾orth
2 •36ø59'N)
-2 0 2 A e'<> •v1
iAMOU
$
2 8 -2 02
I ' ' ' I 1 'N) ' ' ' i ' ' AMAR (36ø27'N) -2 -1 0 1 2Distance across-axis (øLon from axis)
magmatism since the time of emplacement of Princess Alice plateau could have contributed to crustal construction. In this
case, the excess melt reported here may correspond to both the excess melt emplaced on axis and additional later volcanism. Sediments partially covering the seamounts over the Jussieu Plateau, and the lack of fresh basaltic glass on the dredged volcanoes suggests that there has been no recent volcanic activity at this latitude, but no data are available for the Princess Alice
Plateau.
The transition from the volcanic plateau to "normal" seafloor terrain along a flow line (Plate 2 and Figure 7) is very abrupt and contrasts with the gradual decrease in crustal thickness along the V-shaped ridge (Figure 6). The inner limit of the east and west Jussieu Plateaus (Plate 2) is a large fault scarp with >1 km of vertical relief locally, which corresponds to the rifting of the plateau [Cannat et al., 1999]. This abrupt change in seafloor character, from smooth to abyssal hill terrain, indicates that once the plume anomaly migrated south of the Jussieu Plateau, the excess melt decreased suddenly and normal, -•6 km-thick-crust was produced instead. In contrast, the gravity signature across the axis shows a more gradual transition from low to high values toward the axis, suggesting instead rapid but gradual waning of magmatism from the V-shaped ridge to "normal" crust (Figures
2d, 4, and 7). A decoupling between deep magmatic processes of
crustal accretion (underplating, lower crustal intrusions) and shallow magmatic (extrusive) and tectonic (faulting) processes may account for the differences in the transition from
overthickened to "normal" oceanic crustal thicknesses inferred
form bathymetry and from gravity. The nature of this transition and the relative proportion of extrusives, intrusives, and underplated material cannot be determined from the gravity and bathymetry alone, and seismic constraints on the velocity and internal structure of the crust are needed both along flow-lines and along the V-shaped ridge.
8.3. Origin, Emplacement, and Tectonic Evolution of the
V-Shaped Ridges
The bathymetry, tectonic structure, and gravity data demonstrate that the V-shaped ridges result from the emplacement of anomalously large volumes of magma at the
ridge axis. The shallow areas are covered by a thin layer of sediments (typically <200 m) have a basement with very smooth
Figure 7. Bathymetry and relative crustal thickness profiles across the center of each segment (see Figure 5 for location). For each panel the bathymetry is shown on top (dark shaded area), and the axis of the relative crustal thickness, which has been inverted to mimic the Moho depth and show the correlation between crustal thickness and bathymetry, is shown at the bottom. The relative crustal thickness inverted from gravity is
shown by the dark shaded area, and the Airy crustal thickness, by the black-white line. Magnetic anomalies in solid symbols correspond to those identified along the profiles (reported in Figure 5), while those in light symbols have been extrapolated using the position of adjacent anomalies and/or calculated spreading rates from the area and from nearby studies [e.g., Sloan
and PatHat, 1992; Luis et al., 1994]. Note the gradual increase toward the north (Azores hot spot) of the crustal roots associated
with the V-shaped ridges. Agreement between the Airy and gravity-derived crustal thickness is good except at the ridge axis,
where the axial valley is dynamically supported [Neumann and Forsyth, 1993].
ESCARTiN ET AL.: V-SHAPED RIDGES AND AZORES-MAR INTERACTION 21,731 a) Relative crustal //
An
4-5
An
3A-4 .. .
.
An
2A-3A
'l ... I ... I ... I ... I b) Bathymetry ..• .F N ß ß
'1 ... I ... I ... I ... I 36.5 37.0 37.5 38.0 38.5 36.5 37.0 37.5 38.0 38.5 Latitude (øN)Figure 8. Calculated average (solid circles with +1 standard
deviation as error bars) and maximum (small circles) gravity- derived (a) crustal thickness and (b) bathymetry along each of the profiles in Figure 7, for different time intervals. There is a good
correlation between crustal thickness and bathymetry, consistent
with an isostatically compensated crust. Note the propagation of
the maximum crustal thickness from the present day Princess
Alice segment (PA) toward the south, the peak off Lucky Strike between anomalies 3A and 4, and the progressive decrease in the
excess crustal thickness and bathymetry toward the south at all
time intervals.
relief, and the upper crust shows shallow-dipping seismic reflectors plunging towards the present-day ridge axis. In addition, the seafloor is unfaulted (e.g., Jussieu Plateau, Plate 2)
and presents abundant seamounts, some > 10 km in diameter (see
Figure 2 of Cannat et al. [1999] and Plate 2). These characteristics suggest that volcanic construction was characterized by long periods of elevated magma supply and high effusion rates. The maximum duration of magmatism at the latitude of the present-day Lucky Strike segment was estimated at
-4 Myr, or shorter if off axis volcanism and/or long lava flows
contributed substantially to the construction of the V-shaped
ridges, as indicated by the incoherent pattern of the magnetic
anomalies over the plateau [Cannat et al., 1999]. Dipping reflectors observed in the 6-channel seismic records (A. Rabain, personal communication, 2000) may correspond to long lava
flows buried by later volcanic eruptions, similar to the interpreted
extensive volcanism and buildup of basement dipping reflectors at other oceanic plateaus [e.g., Schlich eta/., 1993; Ito et al., 1995] or volcanic margins [e.g., Oh eta/., 1995].
The bathymetry shows important changes in the width of the V-shaped ridges that are well correlated with crustal thickness (e.g., west Jussieu and Princess Alice Plateaus, Plate 2 and Figure 4). These changes are indicative of along-axis variations in excess melt supply to the axis, duration of volcanism, and/or mode of emplacement and rifting of the overthickened crust. Tectonic and magnetic data indicate that the magmatic anomaly that produced the V-shaped ridge south of the Azores was initiatated at 10 Ma [Cannat eta/., 1999] at the latitude of Princess Alice Bank (-38øN, Figures 1 and 9) and near or at the
North American/Eurasian/African (NAM/EUR/EFR) triple
junction, at the intersection of the Mid-Atlantic ridge with the
Pico-East Azores FZs [Luis et M., 1994].
The Jussieu Plateau was emplaced on axis-•8.5 Myr ago and rifted-5.7-3.9 Myr ago, -2-3 Myr later (-7-5.7 Myr ago) than the rifting of the Princess Alice Plateau [Pouliquen et M., 1998; Cannat et M., 1999]. At the same time the V ridges intersected the Pico-East Azores FZs, and the triple junction moved north of 38øN (Figure 9) [Luis et M., 1994]. A strip of shallow, overthickened crust, joins the rifted oceanic plateaus, and extends southward, giving the continuous V-shaped ridge observable in the satellite gravity and bathymetry (Plates 1 and 2). These
observations demonstrate that the excess melt was supplied to the axis in a discontinuous manner, with preferential buildup of
oceanic plateaus on axis as the melt anomaly moved away from
the hot spot (Figure 9).
The formation of discrete volcanic plateaus along the axis indicates that the excess melt fluctuated during the propagation of
the melt anomaly and/or that the excess melt was not extracted continuously but was instead focused, building the oceanic
plateaus. Melt could ascend as discrete mantle or melt "diapirs" [e.g., Whitehead, 1986], constructing individual volcanic plateaus, as invoked to explain the organization of volcanic
edifices along the Hawaiian-Emperor seamount chain [e.g., Cox, 1999]. Once the melt anomaly has moved away from the plateau
and the excess melt associated with the melt/mantle anomaly is
exhausted, normal seafloor spreading is initiated after rifting of the oceanic plateau (Figure 9). The Azores V-shaped ridges are thus the result of excess magmatism associated with the Azores hot spot, of rifting and tectonic extension after the excess melt is exhausted once the melt anomaly propagates southward, and of
temporal variations associated with these two processes. The
observed decrease in the melt anomaly with time may be caused by conductive cooling [Cannat et M., 1999] and/or by tapping and extraction of melt by the ridge as it propagates away from the
hot spot.
9. Comparison
With Iceland V-shaped ridges
Comparison of the V-shaped ridges emanating from the
Iceland and Azores hot spots (Plate 1 and Table 3) provides
constraints on the nature of the melt anomalies that originate
them and on the temporal variability associated with ridge-hot
spot interaction. The Azores V-shaped ridges are shorter (-400 km versus-700 km) and propagate slower (60 km Ma -• versus 75-200 km Ma '• [Vogt 1976; White eta/., 1995; Cannat et al., 1999]) than those south of Iceland (Plate 1 and Table 3). In
addition, the V-shaped ridges in Iceland show a marked
periodicity of 3-5 Myr with variable width and amplitude of the different V-shaped ridges, while only one event can be identified
south of the Azores hot spot. The Iceland ridges show both a clearer continuity and constant width along their run (Plate 1).
Table 3. Comparison of the Azores and Iceland V-Shaped Ridges
Azores Iceland
Along-axis length, km -400 -700 Periodicity, Myr ... 3-5
Propagation rate, km Myr-1 60 a 75-200 b
Gravity amplitude (MBA/RMBA), mGal 0-100 -20
Crustal thickness variation, km >6-0 -2 c
Mantle temperature anomaly, øC 130-0 -30 c
a From Cannat et al. [1999].
b From Vogt [1976] and White et al. [1995]. c From White et al. [1995].
21,732 ESCART•N ET AL.' V-SHAPED RIDGES AND AZORES-MAR INTERACTION
Segments:
MG: Menez Gwenn PA: Princess Alice M: Menez Gwenn
L: Lucky Strike
N: North FAMOUS F: FAMOUS A: AMAR
Figure 9. Cartoon of the propagation of the melt anomaly along the axis south of the Azores hot spot (AHS), and
emplacement of the associated V-shaped ridges (see Cannat et al. [1999] for magnetic reconstructions). The melt anomaly initiated -10 Ma ago, constructing the former Princess Alice plateau on axis. The melt anomaly propagated southward, after rifting of the Princess Alice plateau, constructed the former Jussieu Plateau (off Lucky
Strike-North FAMOUS segments), and left a trail of shallow, overthickened crust joining the two structures.
Jussieu Plateau rifted asymmetrically -5 Myr ago, and the melt anomaly continued to propagate southward. The oceanic crust within the V-shaped ridges is of normal thickness and shows axis-parallel fault terrain (Plate 2) The
lack of a clear bathymetry and crustal thickness anomaly at the AMAR segment at the present time indicates that the anomaly waned and disappeared. At 10 Ma the NAM/EUR/AFR triple junction (TJ) was located at the intersection of the Pico-East Azores Fracture Zone (see Plate 1) and jumped north to its present position at
-38ø50'N [Luis et al., 1994].
Gravity and limited seismic data indicate that the variations in
crustal thickness associated with the Azores V-shaped ridges are -2-3 times larger than those south of Iceland. Lacking high- resolution geophysical surveys off the Reykjanes Ridge axis, we used both ETOPO5 bathymetry and bathymetry predicted from combined ship track bathymetry and satellite gravity data [Smith
and Sandwel• 1994] to obtain two estimates of the MBA
anomaly (see procedures in section 5 and parameters in Table 2).
The variations in MBA are much smaller across the Reykjanes
Ridge (-30 mGal for the FAA and -20 mGal for the MBA in
amplitude) than across the Azores ridges (up to 100 mGal, Plate 2
and Table 3). Crustal thickness variations estimated from limited
seismic data near the Reykjanes Ridge are -2 km [White et al.,
1995], smaller than the -6-km variation in crustal thickness
inferred for the profile across Lucky Strike (Figures 7 and 10)
and consistent with the differences in gravity amplitude (Figure
10). In addition, the Iceland V-shaped ridges are very linear and regular and do not disrupt the magnetic lineations (see Figures 2
and 3 of White [1997] and Plate 1). The excess melt was
supplied to the axis and accreted to the oceanic crust in a
continuous manner south of Iceland, without the formation and later rifting of oceanic plateaus observed south of the Azores.
The larger variations in crustal thickness associated with the Azores ridges require larger mantle temperature anomalies than those responsible for the Iceland V-shaped ridges. The mantle temperature anomaly required to produce the Iceland V-shaped ridges is -30øC [White et al., 1995], assuming a simple 1-D decompression melting model [McKenziq 1984; McKenzie and Bickle, 1988]. Using the same melt thickness-potential temperature curve (Figure 4 of White et al. [1995]), the mantle temperature anomalies for the Azores would vary from 130øC -10 Myr ago near the Azores (15-km crustal thickness) to 0øC at
the present time (normal -6-km-thick crust, Figures 7 and 8).
Other simple models may explain the propagation of melt anomalies, such as variable flow of asthenospheric material under the axis [e.g., Vog• 1971], or ascent of anomalously hot mantle
of variable size and/or temperature [e.g., Cannat et al., 1999]. Although the Iceland and Azores V-shaped ridges may have a
similar origin, the clear differences observed indicate that the thermal structure, the dynamics of the interaction with the MAR,


![Figure 5. Interpreted magnetic anomalies from shipboard magnetic profiles. The data from the SudAfores cruise [Cannat et al., 1999] are complemented on the northern part with anomaly picks from an aeromagnetic survey [Luis](https://thumb-eu.123doks.com/thumbv2/123doknet/14738364.575429/11.909.178.754.96.491/interpreted-magnetic-anomalies-shipboard-magnetic-sudafores-complemented-aeromagnetic.webp)