HAL Id: tel-03215591
https://tel.archives-ouvertes.fr/tel-03215591
Submitted on 3 May 2021HAL is a multi-disciplinary open access
archive for the deposit and dissemination of sci-entific research documents, whether they are pub-lished or not. The documents may come from teaching and research institutions in France or abroad, or from public or private research centers.
L’archive ouverte pluridisciplinaire HAL, est destinée au dépôt et à la diffusion de documents scientifiques de niveau recherche, publiés ou non, émanant des établissements d’enseignement et de recherche français ou étrangers, des laboratoires publics ou privés.
Light interreflexions in ridged surfaces : influence of
surface structure, material and lighting on color
Dorian Saint-Pierre
To cite this version:
Dorian Saint-Pierre. Light interreflexions in ridged surfaces : influence of surface structure, material and lighting on color. Optics [physics.optics]. Université de Lyon, 2020. English. �NNT : 2020LY-SES041�. �tel-03215591�
Order number NNT:
2020LYSES041
PhD Thesis, UNIVERSITY OF LYON
Completed at the
University Jean Monnet
Doctoral School
N° 488
Sciences, Ingénierie, Santé
Publicly defended on 19/11/2020, by:
Dorian SAINT-PIERRE
PORTFOLIO
3
In this portfolio, you will find the figures attached to the manuscript.
The name of the figures follows the code:
Figure PF (PortFolio) + Chapter number – Figure number
The figures attached to Chapter 3 range from PF3-1 to PF3-15 The figures attached to Chapter 4 range from PF4-1 to PF5-7 The figures attached to Chapter 5 are PF5-1 and PF5-2
Dans ce portfolio, vous trouverez les figures attachées au manuscrit principal.
La dénomination des figures suit le code suivant :Figure PF (PortFolio) + Numéro de chapitre – Numéro de figure
Les figures du chapitre 3 allant de PF3-1 à PF3-15 Les figures du chapitre 4 allant de PF4-1 à PF5-7 Les figures du chapitre 5 allant : PF5-1 et PF5-2
4
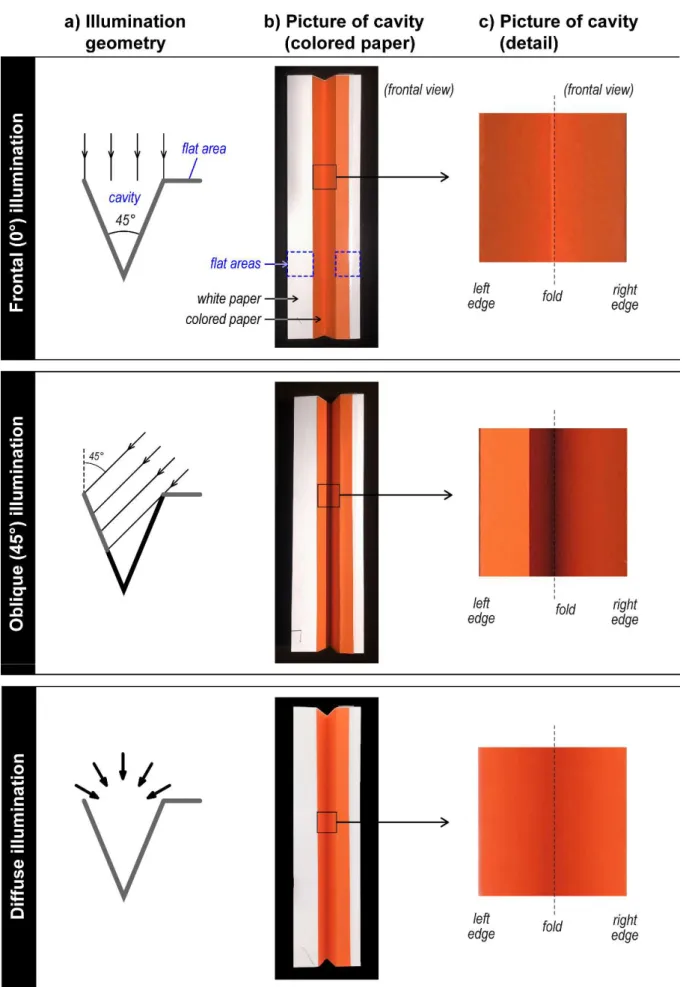
Figure PF3-1 (double page) — Illustration of the influence of the illumination geometry, by considering frontal illumination (top row), oblique illumination (middle row) and diffuse illumination (bottom row). a) Schema corresponding to the illumination geometry. b) Color pictures (non-calibrated) of the sample presented in Figure 4 6. c) Simulations of a 45° V-cavity made of magenta material. d) Corresponding spectra displayed by all facets across the cavity are
5 represented, with a solid line standing for a spectrum on the edge of the cavity, a dashed line representing a facet at the fold of the cavity, a dashed magenta line symbolizing the reflectance of the flat surface made with the same material, and a solid red line representing the average reflectance displayed by the cavity seen from afar, at an (θ,φ) = (0°,0°) angle (frontal view).
7 Figure PF3-2 — Visible area of a 45° magenta V-cavity, illuminated by a directional light source following the
45 , 0
direction, as a function of the zenithal angle of observation. The area contained in a blue rectangle stands for a positive angle, and the area in the yellow rectangle stands for a negative angle.8
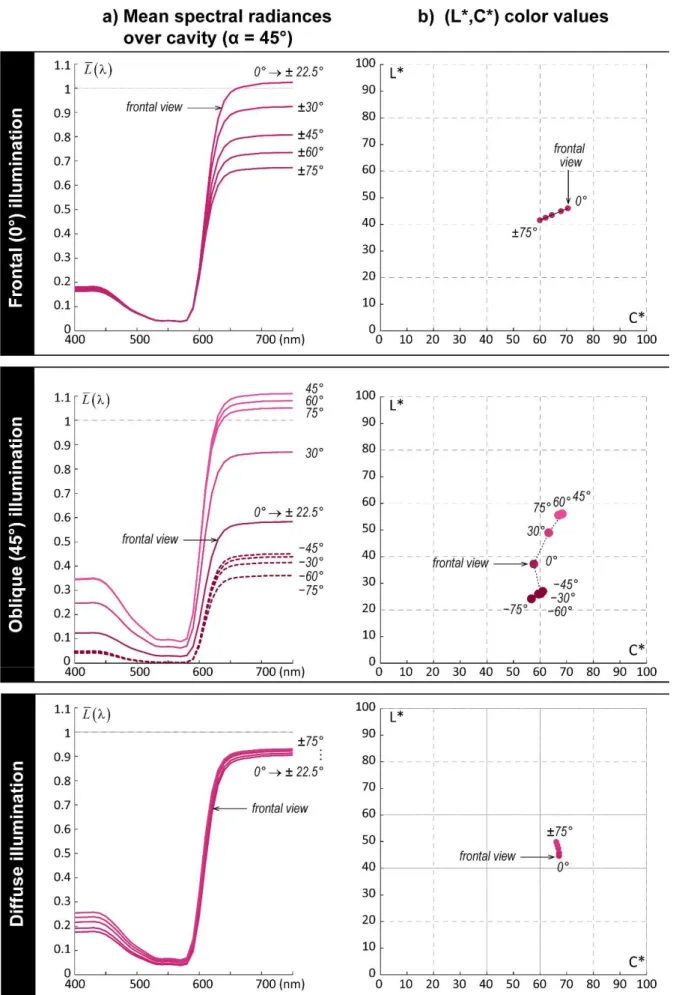
Figure PF3-3 (double page) — Simulated average spectral radiances and colors displayed under different viewing angles by a 45° magenta V-cavity under three types of illumination : frontal, oblique and collimated at 45°, and diffuse. The observation direction varies from a zenith angle of -75° to -75° in steps of 15°, with an azimuth angle of 0°. a) Spectral radiances observed: for each
9 zenithal angle of observation, the average spectral radiance is drawn with a solid line for the positive range, a dashed line for the negative one. b) Corresponding CIE1976 L*a*b* colors projected on the L*C* plane. c) Same colors projected on the a*b* plane. d) E2000 color distance between each color and the one corresponding to the frontal view.
10
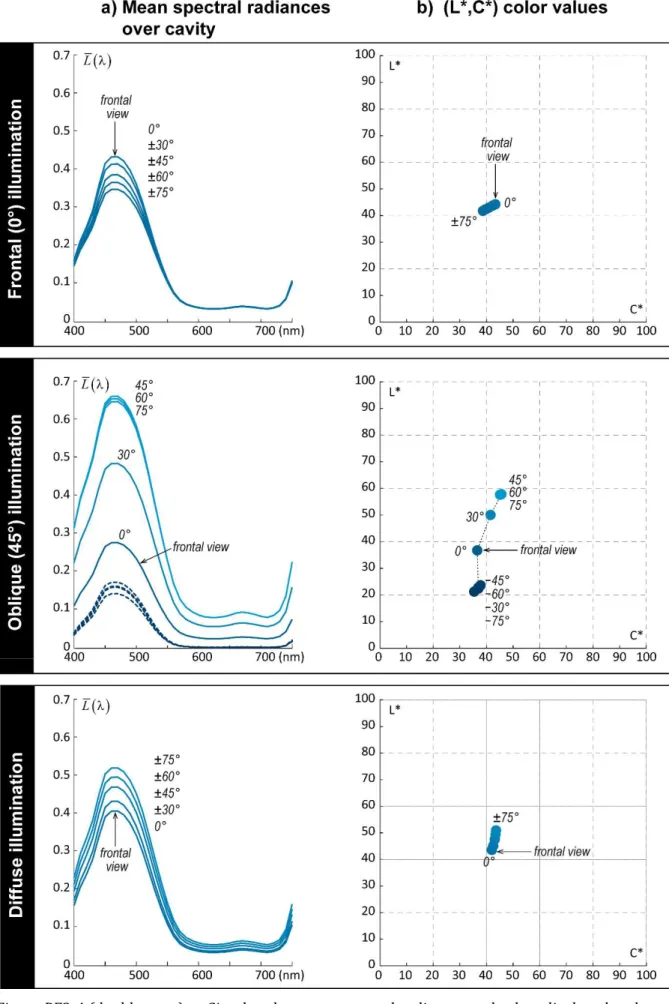
Figure PF3-4 (double page) — Simulated average spectral radiances and colors displayed under different viewing angles by a 45° cyan V-cavity under three types of illumination : frontal, oblique and collimated at 45°, and diffuse. The observation direction varies from a zenith angle of -75° to 75° in steps of 15°, with an azimuth angle of 0°. a) Spectral radiances observed: for each zenithal
11 angle of observation, the average spectral radiance is drawn with a solid line for the positive range, a dashed line for the negative one. b) Corresponding CIE1976 L*a*b* colors projected on the L*C* plane. c) Same colors projected on the a*b* plane. d) E2000 color distance between each color and the one corresponding to the frontal view.
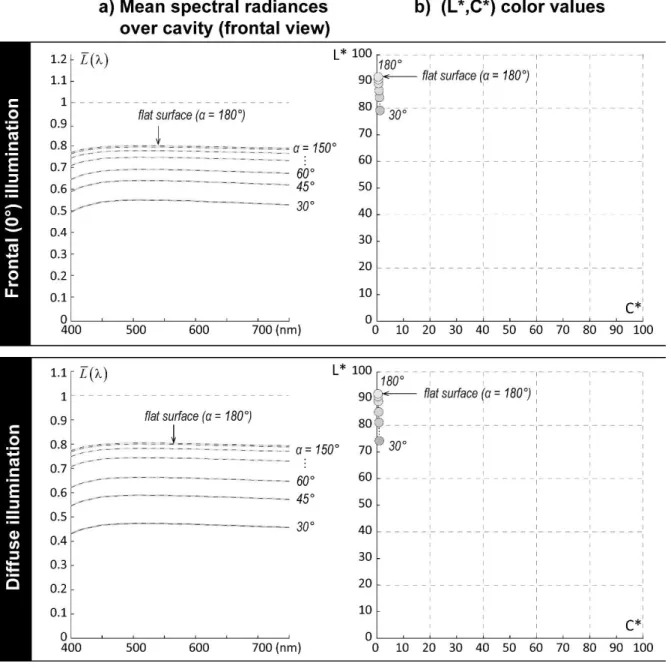
13 Figure PF3-5 – Simulated spectral radiances displayed by a magenta V-cavity for a dihedral angle α of 30°, 45°, 60°, 90°, 120°, 150° and 180°, under a frontal collimated lighting and a diffuse lighting. The colored rectangles are a color preview of a band of the cavity in each configuration.
14
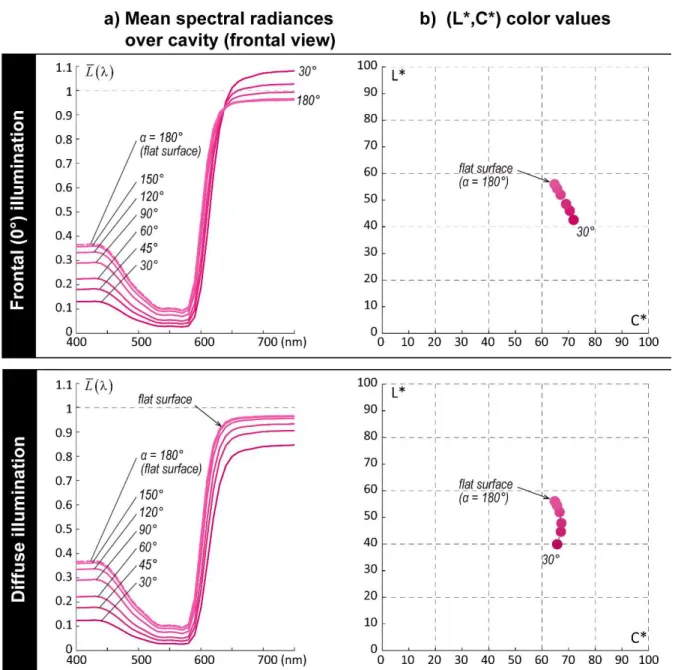
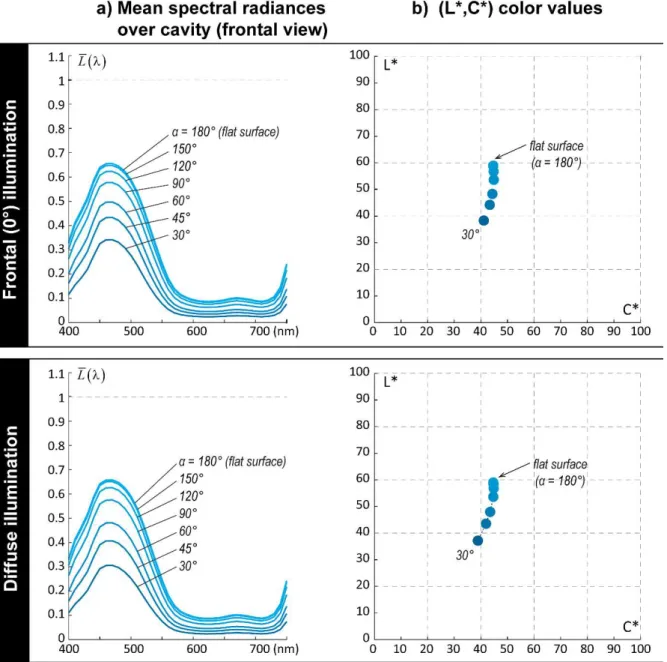
Figure PF3-6 (double page) — Simulated average spectral radiances displayed by a magenta V-cavity with a dihedral angle varying from 30° to 180° in steps of 15°, under a frontal lighting
0 ,0
(top row) and a diffuse lighting (bottom row). a) Spectral radiances observed. b) Corresponding CIE1976 L*a*b* colors projected on the L*C* plane. c) Same colors projected on the a*b* plane. d) E2000 color distance between each color and the one corresponding to the flat surface.16
Figure PF3-7 (double page) — Simulated average spectral radiances displayed by a cyan V-cavity with a dihedral angle varying from 30° to 180° in steps of 15°, under a frontal lighting
0 ,0
(top row) and a diffuse lighting (bottom row). a) Spectral radiances observed. b) Corresponding CIE1976 L*a*b* colors projected on the L*C* plane. c) Same colors projected on the a*b* plane. d)
18
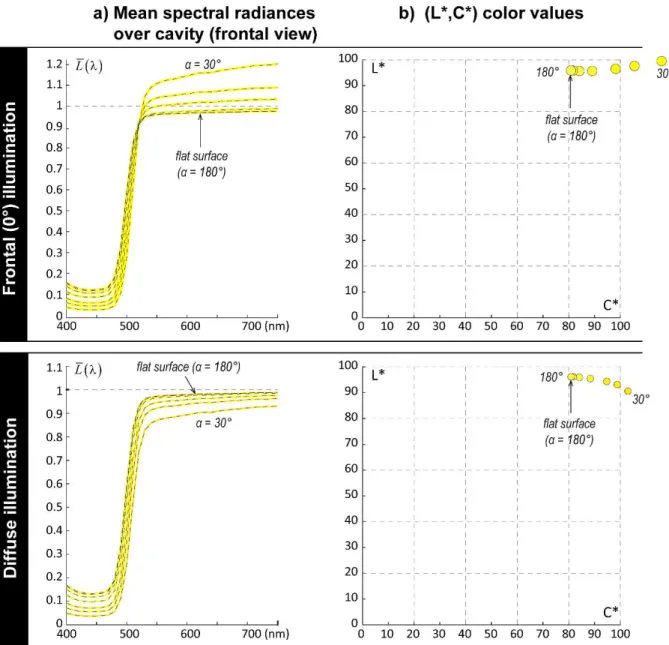
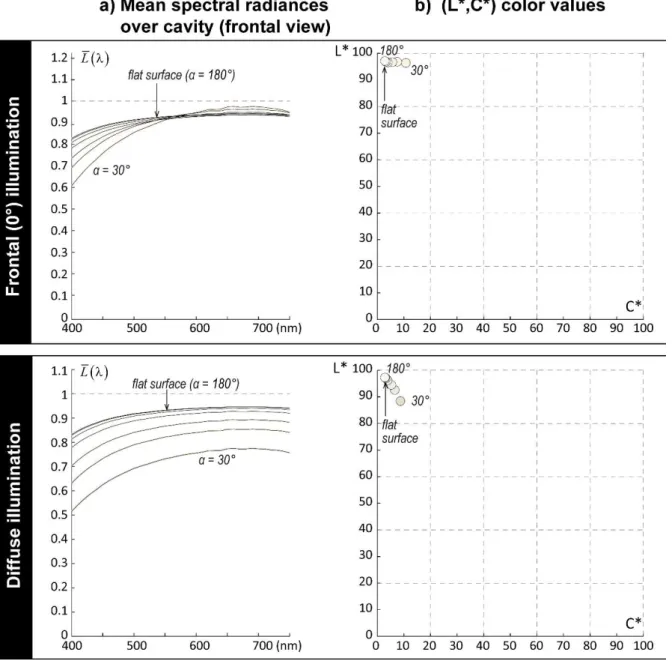
Figure PF3-8 (double page) — Simulated average spectral radiances displayed by a yellow V-cavity with a dihedral angle varying from 30° to 180° in steps of 15°, under a frontal lighting
0 ,0
(top row) and a diffuse lighting (bottom row). a) Spectral radiances observed. b) Corresponding CIE1976 L*a*b* colors projected on the L*C* plane. c) Same colors projected on the a*b* plane. d)
20
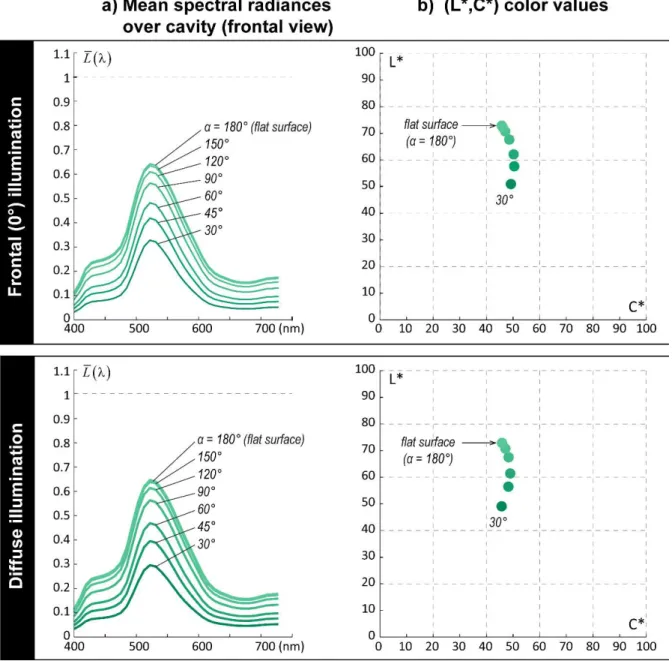
Figure PF3-9 (double page) — Simulated average spectral radiances displayed by a Munsell green V-cavity with a dihedral angle varying from 30° to 180° in steps of 15°, under a frontal lighting
0 ,0
(top row) and a diffuse lighting (bottom row). a) Spectral radiances observed. b) Corresponding CIE1976 L*a*b* colors projected on the L*C* plane. c) Same colors projected on the a*b* plane. d) E2000 color distance between each color and the one corresponding to the flat surface..22
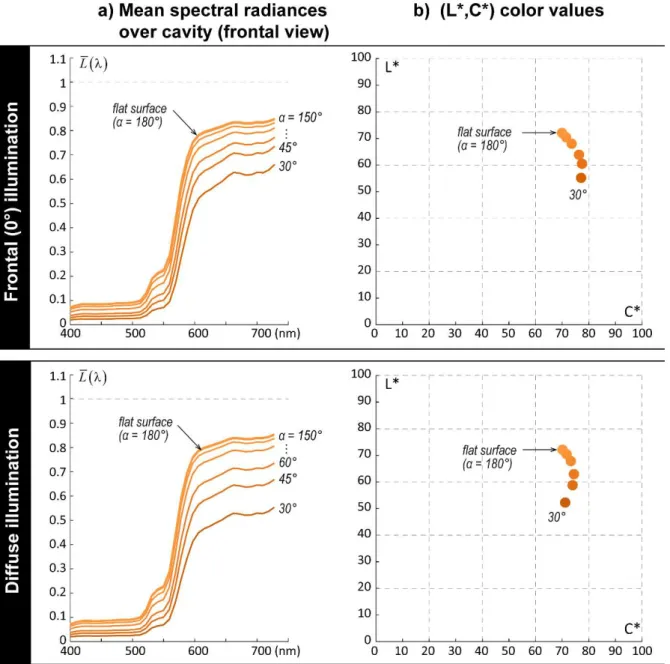
Figure PF3-10 (double page) — Simulated average spectral radiances displayed by a Munsell orange V-cavity with a dihedral angle varying from 30° to 180° in steps of 15°, under a frontal lighting
0 ,0
(top row) and a diffuse lighting (bottom row). a) Spectral radiances observed. b) Corresponding CIE1976 L*a*b* colors projected on the L*C* plane. c) Same colors projected on the a*b* plane. d) E2000 color distance between each color and the one corresponding to the flat surface..24
Figure PF3-11 (double page) — Simulated average spectral radiances displayed by a white V-cavity (1 sheet of paper) with a dihedral angle varying from 30° to 180° in steps of 15°, under a frontal lighting
0 ,0
(top row) and a diffuse lighting (bottom row). a) Spectral radiances observed. b) Corresponding CIE1976 L*a*b* colors projected on the L*C* plane. c) Same colors projected on the a*b* plane. d) E2000 color distance between each color and the one26
Figure PF3-12 (double page) — Simulated average spectral radiances displayed by a bright white V-cavity (5 sheets of paper) with a dihedral angle varying from 30° to 180° in steps of 15°, under a frontal lighting
0 ,0
(top row) and a diffuse lighting (bottom row). a) Spectral radiances observed. b) Corresponding CIE1976 L*a*b* colors projected on the L*C* plane. c) Same colors projected on the a*b* plane. d) E2000 color distance between each color and the one29 Figure PF3-13 — Simulated average CIE1976 L*a*b* colors of all V-cavities previously presented for both a frontal collimated lighting and a diffuse lighting; projected on the a*b* plane.
30
Figure PF3-14 (double page) — Simulated average spectral radiances and colors displayed by flat surfaces and 45° cavities made of two metameric materials, under frontal lighting (left page) and diffuse lighting (right page). a) Color previews of a band of the flat surfaces and the 45°V-cavities, their respective average color and DE2000 color distance between the two materials. b) Variation
31 of the DE2000 color distance as a function of the position in the cavity. c) Average spectral
radiances of the four samples presented in a). d) Corresponding CIE 1976 L*a*b* colors projected on the L*C* plane and the a*b* plane.
32
Figure PF3-15 (double page) — Spectral radiances and color previews of structured surfaces with 45° V-shaped ridges whose sides are tinted with two different colored materials always face each other, cyan and yellow, under four types of lighting: frontal (a, e), oblique at (θ, ϕ) = (45°,0°) (b, f) and (θ, ϕ) = (-45°,0°) (c, g), and diffuse (d, h). Top row (a, b, c, d): Alternation of cyan and yellow panels: the cyan panel is always on the left of the cavity, therefore the yellow panel on the right.
33 Bottom row (e, f, g, h): The cyan panel is alternatively on the left and on the right. In each case, the color preview of the structured surface is presented alongside with the average spectral radiances displayed in various directions of observation with the zenithal angle θ ranging from -75° to θ = -75° and the azimuthal angle φ being 0°. The spectral corresponding to negative angles are represented with dotted lines, and the ones corresponding to positive angles with a solid line.
35 Figure PF4-1 — Top row: maps of the maximum number of reflections for each observation
direction. Following rows: Color maps of hemispherical-directional reflectance for various materials, obtained with different dihedral angle of cavity, represented with the Lambert azimuthal equal area projection.
37 Figure PF4-2 — Top row: Average spectral hemispherical-directional reflectance factors displayed by two chromatic metals, copper and gold, for various dihedral angles α of cavities and various observation angles (the lighting is diffuse). Bottom row: Corresponding CIE1976 L*a*b* color values projected onto the L*C* plane.
38
Figure PF4-3 — Average spectral bi-hemispherical reflectances (top row), and corresponding CIE1976 L*a*b* color values projected on the L*C* plane (middle row) and the a*b* plane (bottom row) of V-ridged surfaces in copper. Left column: the ridges are parallel and all similar (periodical structure), the different simulations rely on different dihedral angles α. Right column: the ridges are parallel but their dihedral angle is variable and follows a distribution function, parameterized by various roughness values.
39 Figure PF4-4 — Average spectral bi-hemispherical reflectances (top row), and corresponding CIE1976 L*a*b* color values projected on the L*C* plane (middle row) and the a*b* plane (bottom row) of V-ridged surfaces in gold. Left column: the ridges are parallel and all similar (periodical structure), the different simulations rely on different dihedral angles α. Right column: the ridges are parallel but their dihedral angle is variable and follows a distribution function, parameterized by various roughness values.
40
Figure PF4-5 — Average spectral bi-hemispherical reflectances (top row), and corresponding CIE1976 L*a*b* color values projected on the L*C* plane (middle row) and the a*b* plane (bottom row) of V-ridged surfaces in silver. Left column: the ridges are parallel and all similar (periodical structure), the different simulations rely on different dihedral angles α. Right column: the ridges are parallel but their dihedral angle is variable and follows a distribution function, parameterized by various roughness values.
41 Figure PF4-6 — Average spectral bi-hemispherical reflectances (top row), and corresponding CIE1976 L*a*b* color values projected on the L*C* plane (middle row) and the a*b* plane (bottom row) of V-ridged surfaces in aluminum. Left column: the ridges are parallel and all similar (periodical structure), the different simulations rely on different dihedral angles α. Right column: the ridges are parallel but their dihedral angle is variable and follows a distribution function, parameterized by various roughness values.
42
Figure PF4-7 — Average spectral bi-hemispherical reflectances (top row), and corresponding CIE1976 L*a*b* color values projected on the L*C* plane (middle row) and the a*b* plane (bottom row) of V-ridged surfaces in silicon. Left column: the ridges are parallel and all similar (periodical structure), the different simulations rely on different dihedral angles α. Right column: the ridges are parallel but their dihedral angle is variable and follows a distribution function, parameterized by various roughness values.
44
Figure PF5-1 (double page) — Comparison between spectral radiances exhibited by the facets of a 45° V-cavity made of an interfaced Lambertian material, under frontal illumination and frontal view, simulated according to various parameters. Top row: variation of the radiances has functions of the reflectance R of the flat surface. Bottom row: spectral radiances exhibited by a magenta material; the colored bands below the graphs are a color preview of a band of cavity. The simulations are computed a) for a relative refractive index of the interface n = 1.5,
45 by discarding every specular reflection within the cavity, b) for a relative refractive index of the interface n = 1.5, by taking into account the rays specularly reflected once, as allowed by the model, c) for a relative refractive index of the interface n = 1.33, with the same model as b), and d) for a relative refractive index of the interface n = 1, which corresponds exactly to the (non-interfaced) Lambertian surface.
47 FIG PF5-2 — Left column: Projection on the L*C* plane of the CIE1976 L*a*b* colors displayed by the facets of an interfaced Lambertian 45° V-cavity made of magenta material when the refractive index is either 1 (top, which coincides with a non-interfaced Lambertian cavity), 1.33 (middle), or 1.5 (bottom). See the corresponding spectral radiances in Figure PF5-1. Right column: DE2000 color distance between the colors displayed by a facet when n = 1 and n= 1.33 (middle) or 1.5 (bottom), as a function of the facet position y.