HAL Id: halshs-00194724
https://halshs.archives-ouvertes.fr/halshs-00194724
Submitted on 7 Dec 2007HAL is a multi-disciplinary open access archive for the deposit and dissemination of sci-entific research documents, whether they are pub-lished or not. The documents may come from teaching and research institutions in France or
L’archive ouverte pluridisciplinaire HAL, est destinée au dépôt et à la diffusion de documents scientifiques de niveau recherche, publiés ou non, émanant des établissements d’enseignement et de recherche français ou étrangers, des laboratoires
Evolutionary analysis of the firm and internal selection
Nadia Jacoby
To cite this version:
Maison des Sciences Économiques, 106-112 boulevard de L'Hôpital, 75647 Paris Cedex 13 http://mse.univ-paris1.fr/Publicat.htm
UMR 8595
Evolutionary analysis of the firm
and internal selection
Nadia JACOBY, MATISSE
Evolutionary Analysis of the Firm and Internal Selection
♦Nadia J
ACOBYUniversité Paris I Panthéon-Sorbonne MATISSE - ISYS CNRS8595
Maison des Sciences Economiques 106-112 Bd de l'Hôpital
75013 Paris - France [email protected]
ABSTRACT
Evolutionary approaches of the firm devote a part of their analysis to firm behavior and to some processes acting inside the firm, however the internal workings of firms are, most of the time, not deeply analyzed. In this perspective, this paper attempts to investigate whether "we can drop internal selection in the evolutionary analysis of the firm".
In order to answer this question, we propose a micro-simulation model of internal selection where firms are engaged in production and R&D activities. They carry out two kinds of R&D and do not run any imitation process. Internal selection acts on R&D projects and we measure the impact of the selection mechanism on the firms' performances.
The model generates persistent differences between firms according to their internal selection process. KEY WORDS: Innovation, Internal Selection, Market Dynamics, R&D, Technological Performance
Approches évolutionnistes de la firme et sélection interne
RESUME
Les approches évolutionnistes de la firme centrent une partie leurs travaux sur l’analyse du comportement des firmes et de certains processus agissant au sein des organisations. Mais le plus souvent les mécanismes intra-organisationnels ne sont pas précisément étudiés. Ainsi, cet article s’intéresse à la question de savoir si la sélection interne peut ou non être éludée par les analyses évolutionnistes de la firme.
Afin de répondre à cette question, nous proposons un modèle de micro-simulation centré sur la question de la sélection interne. Les firmes sont engagées à la fois dans des activités productives et des activités de R&D, elles conduisent deux types de R&D mais ne font pas d’imitation. La sélection interne porte sur les projets de R&D. Le modèle permet de mesurer l’impact des mécanismes de sélection interne sur la performance des firmes. Il génère notamment des différences persistantes dans les performances des firmes selon le type de sélection interne qui les caractérise.
MOTS CLES : Dynamique de marché, Innovation, Performance Technologique, R&D, Sélection Interne
JEL CODES: C63, L11, L21, O32
♦
The construction of the model has benefited from helpful discussions with G. Bottazzi, G. Dosi and T. Reichstein during a visiting period in Pisa. I also received precious comments on a previous version of this paper from participants at EMAEE'03 in Augsburg, Germany and at the workshop Les Modélisations de l'Auto-organisation en Economie, Paris, June 2003. Special thanks to A. Coad for the English editing. The usual disclaimers apply.
1- Introduction
As suggested by Levinthal (1991) and by Warglien (1995), selection and adaptation processes may coexist as explanations of organizational evolution. Internal selection as well as market selection contributes to shape the evolution of a portfolio of projects, which influences the diffusion of organizational competences over the firm. A successful effort in R&D can lead to the emergence of an unexpected breakthrough and then to the reorganization of the firm competence base (Warglien, 1995).
We argue that the study of internal selection mechanisms is essential to the analysis of a firm’s evolution and workings as far as internal selection is an intra-organizational mechanism which consequences appear in the external behavior of the firm. In particular, it seems internal selection influences firms' performances. However, most of the time, evolutionary approaches of the firm neglect these aspects. In fact, there is a sort of dichotomy between intra-organizational and inter-organizational analyses. On one side, inter-inter-organizational works deal for instance with innovation and its diffusion process or with competitive analysis, but in any case they set a fixed state of internal organization. On the other side, intra-organizational works focus on firms’ internal workings without any link to the external environment. Knowledge is then the central element of analysis.
However, in both cases, there is no link between both dimensions. With this dichotomy, the question of internal selection is left aside even more. Moreover the transposition of the Darwinian framework to the evolutionary analysis of the firm reinforces this distinction between intra and inter-organizational works as far as mutation and selection are disconnected in the Darwinian paradigm.
The study of the intersection of those dimensions highlights the importance of internal selection processes. Internal selection regulates intra-organizational changes according to the selection criteria defined by the firm itself. Internal selection is then clearly different from market selection. In particular, it restores the internal coherence of the firm which mutations can disrupt. Indeed, a selection mechanism acts only if there is variation. As suggested in Jacoby (2002, 2003), the transformation of the firm follows a Lamarckian process in which learning mechanisms and interactions with environments –internal and external- are important factors in change which base selection mechanisms.
Internal selection depends on the nature of its operative modalities and on the criteria it uses. It is characterized by selection criteria defined by the firm itself and by the existence of an internal selector agent acting within the firm. This selector agent - individual or collective - guides the selection process. Owing to his tacit skills, the selector agent is supposed a priori to be able to lead the selection process in the direction intended by the firm. He guides and/or influences the internal selection process by imposing constraints (minimal profitability or social constraints, for example) and/or by orientating the strategic goals of the firm. However he can fail. In the real world, the selector agent is either the R&D project manager or the one of the chairmen or else another influential or charismatic agent acting within the firm. His power can be different in one firm from another and
within the firm it can change over the different selection mechanisms. Sometimes he can be very powerful, some others not.
The intensity and efforts in R&D, past successes, the structure of incentives with regard to risk-taking, and the diverse modalities of resource allocation within the firm, are some of the internal selection criteria we can find inside the firm (Warglien, 1995).1 At a more general level, the influence of the external environment and the pressures of the internal one result in the emergence of complementary criteria. The external environment concerns the market and competition between rival firms. It is the reflection of scientific and technological progress and originates in macro-economic upheavals. Symmetrically, the internal environment is composed of formal or informal decision-making processes and interactions among individuals. It also takes into account the constraints of organizational structures, technological and marketing practices, and financial constraints. Lastly, the degree of irreversibility of engagement as well as the demand for minimum profitability also influences the selection process.
Thus this paper aims at demonstrating the necessity to study internal selection and to integrate systematically this mechanism in the analysis of the evolution of firms and industries. In order to illustrate this theoretical purpose, we developed an original micro-simulation model, representing the internal working of the firm and highlighting the importance of internal selection. This model does not offer an exhaustive representation of internal mechanisms, it is a qualitative model that aids the comprehension of intra-organizational processes.
2- The Baseline Model
The micro-simulation model we present is a simplified representation of a population of multi-product firms. The model is non-linear, stochastic and dynamic. It comes within the tradition of Nelson & Winter models centered on technical progress and Schumpeterian competition.
On the supply side, firms are engaged in productive and research activities. On the demand side, markets are characterized by prices. Capital is the only input in production, therefore capital productivity indicates the efficiency of the technology used by the firm.
Firms commit productive and R&D activities, they do not perform any imitation process. They commit systematically R&D for product diversification and R&D for process innovation. With process innovation they can improve their productivity level using a more efficient technology. The diversification strategy leads them to develop new products and then to enter new markets. So before the market competitive pressure, the firms are engaged in an internal selection process.
As Llerena and Oltra (2000) show, the daily economic development is characterized by the growing diversity of products and services. While some new products appear,
1
some others disappear and then the balance between the emergence of new products and the disappearance of existing goods determines the net static variety of the economic system at a given point in time (Llerena, Oltra, 2000). The model highlights the consequences of competition on the markets showing that some goods exit the market because of the high competitive pressure. But the core of the model concerns the internal selection processes acting on R&D projects and the consequences of this selection mechanism on the firm's performances. The impact on performance is measured in particular through the firm profit level, market share and productivity level resulting from the technology and product selected.
2-1- Firms’activities and technological change
In the model, firms are simultaneously engaged in productive and research & development activities. R&D is a source of technological improvement for the firm. After explaining the production process, we will focus on R&D activities and on internal selection mechanisms. Internal selection has different functions within the firm. It acts on R&D projects for process innovation in order to select the different technological opportunities but internal selection also concerns diversification projects.
2-1-1- Productive activities
Each firm is engaged in several productive activities acting on different markets with a specific demand. At the same time, firms follow a diversification strategy. The current activities of the firm undergo the competitive pressure of the market they are active in. They struggle to increase their market share and profit level.
Firms use only capital as input, so capital is numeraire and its unit cost is supposed equal to one. The technology used by the firm i in the production process j2 at time t is characterized by its productivity level Aij(t). This productivity level
results from the equation:
(1)
A
(
t
)
Max
[
A
(
t
1
)
;
A
pc(
t
)
]
ij ijij
=
−
where is the productivity level resulting from the R&D for process innovation
)
(t
A
pc ij 3. Technological improvements are achieved after costly and risky R&D activities (Dosi, 1988b). The technological change is not inherent in the capital
but it has an external source: firm innovation. Technological change is
endogenously determined and firms invest in R&D in order to innovate and ultimately improve their productivity.
2
j identifies the different activities or production processes the firm is engaged in.
3
Process innovation and diversification activities are identified with the exponents “pc” and “pd”, respectively.
For each activity, the quantity of capital dedicated to the production process is determined according to the following equation:
(2)
[
]
ij ijpd j pd ij ij i ij ij ij ij ij ijt
K
t
r
E
t
KI
t
t
I
t
D
t
I
D
t
I
K
⎥
+
⋅
⎦
⎤
⎢
⎣
⎡
⋅
−
⋅
+
+
⋅
−
⋅
−
=
(
1
)
1
(
)
(
)
(
)
(
)
∑
(
)
(
)
)
(
α
The capital stock per productive activity includes four components:
i) The first gives the capital stock depreciated at rate rij. This rate is a parameter of
the model.
ii) The second element refers to the replacement of the depreciated share of capital. The equation iv)(5) defined below gives more details.
iii) The third component (
−
∑
⋅
jpd ij ij
i
t
D
t
I
I
(
)
(
)
) gives the total available investment for the current products. This total investment is distributed between the different productive activities according to αij(t) which reflects the contribution of each activity to the total free cash-flow.iv) Finally, Ipd is a "launching investment" the firm dedicates to the new activities. It is a parameter of the model.
The distinction between new and old activities follows those rules: (3)
⎩
⎨
⎧
=
otherwise
0
effective
is
activity
Production
if
1
)
(t
E
ij (4)⎩
⎨
⎧
=
>
=
otherwise
0
)
(
&
2
ge
if
1
)
(
ij pd ij i ijI
t
I
a
t
D
Dij(t) indicates the new productive activities which can benefit from a "launching
investment".
The sequence of investment is in favor of the research & development as far as after replacing the depreciated share of capital, the firm firstly determines the R&D budget before affecting the resulting part to the net capital investment. All the firms are innovative, they do not run any imitation process, there is no embodied technical progress, and so R&D activities are the only source of innovation.
The capital depreciates with the rate rij. It is replaced only if the productive activity
still exists and if its cash-flow is positive. Then the replacement respects the following rule: (5)
⎪
⎩
⎪
⎨
⎧
−
≤
<
−
>
−
=
otherwise
0
)
1
(
)
(
0
if
)
(
)
1
(
)
(
if
)
1
(
)
(
t
t
rK
t
t
rK
t
t
rK
t
KI
ij ij ij ij ij ij ijπ
π
π
The share of capital net investment is determined according to αij(t) (see equation
(2)) reflecting the policy of the firm in terms of net capital investment. αij(t) takes
any value between 0 and 1 and reflects the contribution of the productive activity to the total free cash-flow.
Ii(t), the capital investment for the entire firm, is computed as:
(6)
⎩⎨
⎧
−
⋅
Π
Π
>
=
otherwise
0
0
)
(
if
)
(
)
1
(
)
(
t
t
t
I
iδ
i iwhere δ is the distribution rule of the total free cash flow between capital net investment and R&D budgets. δ is a parameter and δ ∈ [0;1].
δ determines the distribution strategy of the firms between capital investment and research and development. The firms’ diversity can be measured through their
innovation strategies and so through the value of δ. Some of them focuson R&D (δ is high) while some others have a lower propensity to take risks and prefer to invest in capital (δ is low). As notice by Nelson & Winter (1982), with bounded
rationality and radical uncertainty, firms develop different knowledge and skills leading them towards different innovation trajectories. In this model, the firms can be differentiated, in particular, thanks to their innovation behavior.
The free cash flow, Πi, results from the different productive activities the firm is
engaged in: (7)
Π
=
∑
(
−
)
j ij ij i(
t
)
π
(
t
)
KI
(
t
)
We assume that the variable production cost per unit of capital is constant over time so the cash-flow of each productive activity is given by:
(8)
⎥⎦
⎤
⎢⎣
⎡
−
−
+
−
+
−
⋅
−
⋅
=
)
1
(
)
1
(
)
1
(
)
1
(
)
(
)
(
)
(
t
a
t
RD
t
RD
t
K
c
t
P
t
q
t
pd i pc ij ij ij j ij ijπ
where cij is the unit production cost as a fraction of the capital stock and RD the cost
of R&D supported by the activity j.
a(t-1) gives the number of productive activities of the firm at t-1.
2-1-2- R&D activities
Since the model focuses on internal selection processes, it is interested only in innovative firms. So, every firm is engaged in R&D activities for which it allocates a budget. The R&D budget is a share of the free cash flow. We assume that R&D is a
priority for the firms since their survival depends on their ability to increase their
productivity level. So after covering the physical depreciation of capital in each activity, the resulting cash flow is centralized at the firm level, which then
decides to distribute it between R&D first and net capital investment afterwards. This simple decision rule reflects bounded rationality.
The total R&D budget of the firm is given by: (9) δ∈ [0;1]
⎩⎨
⎧
⋅
Π
Π
>
=
otherwise
0
0
)
(
if
)
(
)
(
i it
t
t
RD
δ
iAfterwards, the firm divides this budget between R&D for process innovation and R&D centered on the diversification strategy. The total R&D budget is entirely distributed.
Search is uncertain, so it is modeled as a stochastic process. This stochastic process reflects the fact that a random element captures the uncertainty of the link between innovative effects and final outcomes (Silverberg, Verspagen, 1995). As in Llerena, Oltra, (2000), the innovation process consists in a draw of a productivity level in a normal distribution.
The firm is engaged in as many R&D projects for process innovation as production processes. The firm thus determines first the total budget of R&D for process innovation and then it distributes it between the different individual projects. The global budget for process innovation is given by:
(10)
⎪⎩
⎪
⎨
⎧
⋅
−
>
=
otherwise
0
0
)
1
(
if
)
(
)
(
)
(
pc it
A
t
RD
t
t
RD
i i pc iγ
where γi(t) measures -at the firm level- the contribution of R&D for process innovation to the productivity improvement4.
Following the rule we define for the global budget, each individual process innovation R&D budget is determined according to the relative expected productivity level of the project.
The expected productivity level resulting from each R&D activity is given by the following equation5: (11)
(
ijpc)
pc ij(t)
;
)
(
t
m
σ
A
pc ij≈
Ν
where: (12))
1
(
)
1
(
)
1
(
)
(
=
−
+
−
−
t
K
t
RD
t
A
t
m
ij pc ij ij pc ij)
1
(
t
−
A
ij is the productivity level of the activity j at t-14
Please refer to appendix for more details.
5
In order to keep in mind the dynamics of capital productivity, let's remember the equation (1) presented above:
A
ij(
t
)
=
Max
[
A
ij(
t
−
1
)
;
A
ijpc(
t
)
]
is the R&D budget of j for process innovation
)
1
(
t
−
RD
ijpcis the stock of capital at t-1 for the activity j
)
1
(
t
−
K
ijσijpc is the standard deviation of the normal distribution. It is a parameter whose value reflects the uncertainty of the research process. The higher σ the more risky the R&D.
Process innovations are evaluated through their expected productivity level. The selection process for new technologies is based on the following maximization function:
(1)
A
(
t
)
Max
[
A
(
t
1
)
;
A
pc(
t
)
]
ij ijij
=
−
If the technology discovered with process innovation is more efficient than the one the firm is currently using in this productive activity, the firm switches.
Whatever the propensity of firms for risks, they all use the same selection mechanism for process innovation.
We assume that the innovative draws are centered, in particular, on the current productivity level. The more the firms have invested at t-1, the higher the chances to obtain a high expected productivity level at t ( ). This reflects the learning
effect on R&D. The cumulativeness of innovation illustrated by the way m is
defined implies that the result of innovation is at least partly determined by past technological performances. This cumulativeness can be explained by the fact
that the firm stays in the same technological trajectory.
)
(t
A
ijpcBefore starting a diversification project, the firm determines randomly a target market among the market space composed of all the markets of the model in which the firm is not already active. The R&D budget represents the amount of resources available for the diversification. The budget is given by:
(13)
⎪⎩
⎪
⎨
⎧
⋅
−
>
=
otherwise
0
0
)
1
(
if
)
(
)
(
)
(
t
A
t
RD
t
t
RD
pd i i pd iβ
The budget for diversification is a share of the total R&D budget of the firm (RDi(t)); it exists only if the R&D was "successful" at the previous period, i.e. only
if the expected productivity level of the diversification project at t-1 was positive. This share of R&D is determined according to the relative productivity level. The idea is, the more successful the R&D for diversification compared to the other R&D activities, the higher the budget. β reflects this idea. 6
6 For more details on β, please refer to appendix.
The project efficiency is measured thanks to the expected productivity level defined as follows: (14)
(
ipd)
pd i(t)
;
)
(
t
m
σ
A
pd i≈
Ν
where:σipd is the standard deviation of the normal distribution. It is a parameter whose value reflects the uncertainty of the research process. The higher σ, the more risky the R&D.
(t)
pd im
is the mean of the normal distribution, with:(15)
⎥
⎦
⎤
⎢
⎣
⎡
−
−
+
−
⋅
=
)
1
(
)
1
(
)
1
(
)
(
t
K
t
RD
t
A
t
m
i pd i i pd iλ
where: (16)∑
=−
−
=
−
a j ij iA
t
t
a
t
A
1)
1
(
)
1
(
1
)
1
(
the average productivity of the firm i at t-1(17)
∑
=−
−
=
−
a j ij iK
t
t
a
t
K
1)
1
(
)
1
(
1
)
1
(
the average stock of capital of the firm i att-1
a(t) is the number of different productive activities for the firm at t
λ represents the entry barrier. λ∈ [0; 1], if λ=1 the market is contestable, if λ=0 the entry barrier is maximum, there is non-contestability. λ is a parameter of the model.
The mean of the distribution is centered on the average productivity level of the firm computed over all the productive activities. With this cumulativeness, the
innovation process is cumulative and path dependent.
Internal selection of diversification projects is a slightly more complex process than internal selection of process innovations, in particular because it varies according to the propensity of firms to take risks and because of the existence of an internal selector agent. As we suggested in the first part of the paper, only a “powerful” selector agent can enforce the selection process when the economic criteria are not met. He can push in favor of a specific project although it does not seem to be profitable with regard to the economic criteria. In the version of the model we are presenting here, this situation occurs, with a probability 0,25% (Pr(SA=1)=0,25%), whatever the propensity of firms to take risks. It is a very seldom situation.
Diversification allows the firm to enter a new market. If the R&D is successful i.e. if the economic characteristics of the project suit the internal selection process, the firm develops a new product permitting its entrance on a new market.
The economic criteria of the internal selection process rely on the expected revenue per unit of capital and on the R&D budget. The revenue per unit of capital ( ) is computed with its expected productivity level and the current price on the target market:
pd i k
Y
(18)
Y
(
t
)
A
ipd(
t
)
P
(
t
)
pd i
k
=
⋅
βwhere Pβ is the current price observed on the target market β.
To be selected a project has to respect an economic criterion on its expected revenue per unit of capital and the R&D budget –for diversification- has to be positive. The higher the propensity of firms to take risks, the lower the threshold of selection on the expected revenue per unit of capital.
Therefore, firms with a high propensity to take risks develop their diversification projects when their expected revenues per unit of capital are higher than the revenue per unit of capital of their least profitable productive activity. On the contrary, firms with a low propensity to take risks fix their threshold to the revenue per unit of capital of the most profitable productive activity.
2-2- Market dynamics
Firms are multi-product, they are active on different markets. On each of them, the firms offer a quantity qij(t) defined as follows:
(19)
q
ij(
t
)
=
K
ij(
t
−
1
)
⋅
A
ij(
t
−
1
)
At the market level, the total supply corresponds to the sum of individual quantities produced by each firm active on the market:
(20)
=
∑
i ij
j
t
q
t
Q
(
)
(
)
As in Nelson & Winter (1982b), the price is given by the unit-elastic demand function: (21) ε
)
(
)
(
t
Q
d
t
P
j j=
where d is the demand and ε the elasticity of demand constantly equal to 1.
We assume that products are homogenous. All quantities produced are absorbed by the market, adjustment is done through prices. Say's law is implicitly assumed, there is no explicit demand curve for output, (Nelson, Winter, 1973).
The revenue of firms on each market results from the following equation: (22)
y
ij(
t
)
=
q
ij(
t
)
⋅
P
j(
t
)
At the firm level it is trivial to determine the total revenue of the firm resulting from the different productive activities offering different quantities of goods on different markets. This total revenue is determined as follows:
(23)
=
∑
⋅
j j ij it
q
t
P
t
Y
(
)
(
)
(
)
In order to characterize the evolution of industrial structures, we use the Inverse Herfindahl index measuring market concentration:
(24)
∑
==
n i ij jt
ms
t
InvHerf
1 2)
(
1
)
(
where firms' market shares are defined as follows: (25)
)
(
)
(
)
(
t
Q
t
q
t
ms
j ij ij=
Firms can enter and exit freely on each competitive markets.
As internal selection acts on R&D projects, an evolutionary mechanism of selection governs the evolution of industrial structure. In order to model this selection mechanism we defined exit criteria according to which firms exit marketswhen their economic performances are below a specific threshold. Whatever the propensity of firms to take risks, they exit a market either when their market shares are lower than 0.5% or when their profit and cash-flow are negative.
3- Simulation Results
In order to demonstrate the necessity for the evolutionary theory of the firm of studying internal selection mechanisms, we present the main results obtained with the micro-simulation model. So let us firstly present the protocol of simulation and in particular initial conditions. The second point will make explicit the main simulation results.
3-1- Protocol of simulation
We consider a population of 120 firms initially with 12 different productive activities. On the demand side, there are 36 markets with a specific demand coefficient. The 120 firms are randomly but equally distributed over the markets. Each market counts initially 40 firms.
All firms are initially identical and in order to show the stability of the model we start with a stationary state. Then an exogenous shock7 is introduced on one of the 36 demands after 5 periods, it launches the dynamics of the system. Whatever the characteristics, initial market shares are the same and prices on each market are equal to one. The 36 markets are on equilibrium.
7
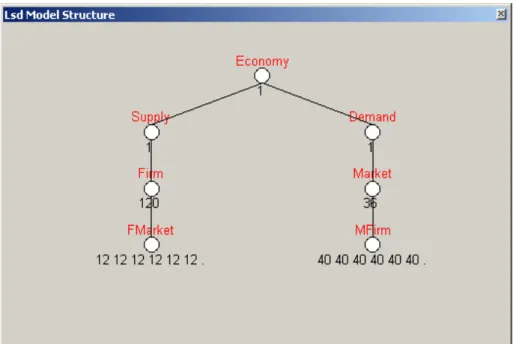
Figure 1: Model structure
Firms perform R&D activities for process innovation and for product diversification. When R&D is successful firms either develop or integrate a new production technology (process innovation), or they enter a new market (diversification strategy). Selection is internal when it acts on R&D projects but external when it acts on firms active on markets. Then the number of firms in the model is varying according to their performances but the number of markets is fixed.
Each simulation counts 2500 iterations in order to show the tendency of the model to converge towards a lasting quasi-stationary state.
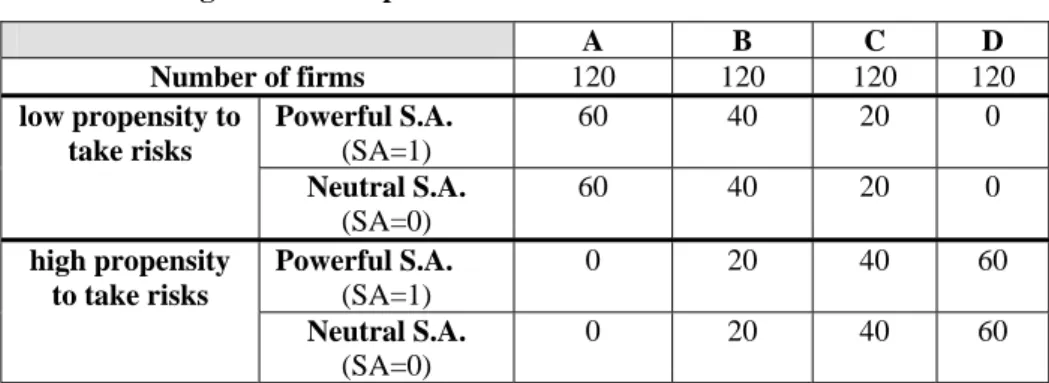
To study the impact of internal selection on the firms' performances, we test four configurations dealing with different modalities of internal selection and different environments. Within configurations, firms differ with respect to their propensity to take risks and with respect to the degree of influence of the internal selector agent. There are two homogenous and two heterogeneous configurations with 120 firms each, their composition is reported in Table 1. Configurations A and D are homogenous, they count only firms of the same type; whereas populations B and C are heterogeneous, they mix firms with different propensity to take risks.
Table 1: Configurations composition A B C D Number of firms 120 120 120 120 Powerful S.A. (SA=1) 60 40 20 0 low propensity to take risks Neutral S.A. (SA=0) 60 40 20 0 Powerful S.A. (SA=1) 0 20 40 60 high propensity to take risks Neutral S.A. (SA=0) 0 20 40 60
The firms with a low propensity to take risks spend 20% of their cash flow in R&D and 80% in net capital investment, whereas those with a high propensity to take risks spend 70% of their cash flow in R&D and 30% in net capital investment. For each configuration, we run 50 simulations8 in order to ease the effects of the stochastic draws. The idea is to generate enough history to be able to tackle the emergent properties of the system and in particular to infer properties relatively independent of the sequences of random numbers. The sensitivity tests show that the different simulations represent the same economic situation9. Thus, any simulation can be chosen as representative. In this perspective, we present the results of a representative simulation chosen in the modal distribution.
In order to analyze the results, we choose as reference the configuration with the lowest internal selection mechanism (D). Among the studied configurations, the closest to the situation in which there is no internal selection is the homogeneous population where all the firms have a high propensity to take risks. This is also the closest situation to the Nelson & Winter model in which there is no internal selection.
3-2- Main results
* Firms survival
In the spirit of Winter (1964), the existence of at least one more rigorous firm in a population strengthens the strictness of internal selection and then promotes the survival of firms with the lowest propensity to take risks.
8
For simulation work, we use the Laboratory for Simulation Development, a software package developed by Marco Valente firstly at IIASA and then at Aalborg University (Valente, 1998).
9
The results we obtain concerning the survival rates confirm this point. Indeed in hybrid configurations (B and C), the survival rates for firms with a low propensity to take risks are higher than those of firms with a high propensity to take risks. Finally even when they are not initially dominant, firms with a low propensity to take risks survive better than those with a high propensity.
Thus it seems that the lower the propensity of firms to take risks, the stricter their internal selection mechanism, the higher their survival probability.
Proposition 1: A low propensity to take risks and the existence of a non-neutral selector agent strengthen the survival probability of firms through the strictness of their internal selection.
* Diversification and industrial structure
Diversification is measured with the number of different markets a firm is active in. Intuitively we could think that firms with a high propensity to take risks are more diversified than other firms. However the results show the opposite. At tend, firms with a low propensity to take risks count on average more productive activities than firms with a high propensity to take risks.
On average, and whatever the propensity of firms to take risks, diversification is rather weak. The firms are engaged in less than 3 productive activities –on average- while they were producing 12 different goods at the beginning. A deeper analysis shows that this reduction in the number of productive activities appears very quickly after the exit from the initial stationary state. In a second step, some firms increase their productions but the competition leads most of them to a second reduction. The average diversification rates show that firms with a high propensity to take risks are finally less diversified than firms with a lower propensity to take risks. The configurations with the biggest proportion of risk-taken firms (C and D) have the smallest average number of productive activities. At the opposite, configurations with the biggest proportion of non risk-taken firms (A and B) have the highest rates. Then it seems that the propensity of firms to take risks influences their diversification strategy. The low propensity seems to strengthen the diversification whereas the high propensity to take risks seems to favor refocusing10.
As far as firms' strategic decisions are not modelized here, the diversification or refocusing behavior relies on selection mechanisms. Indeed, the higher the propensity of firms to take risks, the weaker the internal selection mechanism and then the more influential the market selection.
10
With "refocusing", we understand the reduction in the number of firms' productive activities.
Proposition 2: The evolution of industrial structure and the competitive pressure lead to the reduction in the number of firms' productive activities.
Proposition 3: On the whole, firms are weakly diversified but the lower the propensity to take risks the higher the diversification.
* Performances
Performance is measured with different indicators. The evaluation of firm profitability uses average profit level and cash flow. The technological performance is measured with average productivity whereas total capital stock and number of markets occupied inform about the firm size.
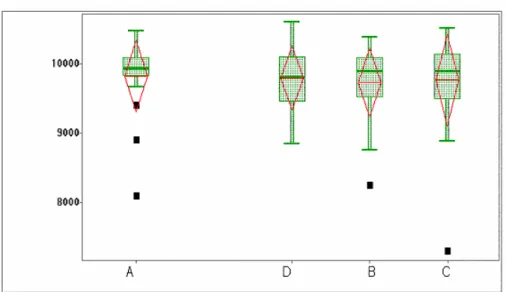
We are interested by the performance of surviving firms at the end. In order to compare the different configurations, the results are summarized by a box-plot representation, for the comparison we perform mean comparison tests11.
According to Table 2, the distribution of the configuration D12 is quite different from the others.
The configurations counting a proportion of firms with a low propensity to take risks have obviously a higher stock of capital. Thusit seems that the lower the propensity of firms to take risks, the higher their capital stock. This is confirmed by the results of Tukey-Kramer tests according to which the configurations B and C are not substantially different with a p-value=0.9995. The results for the comparison between A and B and A and C are, respectively, value=0.4795 and
p-value=0.6251.
We check the number of firms is roughly the same in all configurations as well as the homogeneity of distribution of capital between those firms within each configuration13. Thus those elements cannot explain the differences between configurations.
Because firm capital growth can be explained either by process innovation (which causes productivity growth) or by the development of new profitable activities, the link with internal selection mechanism becomes obvious. On the one hand, the quantity of capital grows by means of capital investment which exists only if the firm generates enough profit to invest. On the other hand, growing profit originates either in capital productivity growth, i.e. in process innovation, or in successful diversification. The internal selection acting on process innovation is the same whatever the propensity of firms to take risks but it differs in the selection of diversification projects.
11
Those tests are Tukey-Kramer tests.
12
Homogenous configuration with high propensity firms.
13
The strictness of internal selection criteria acting on the diversification projects strengthens the probability of success of the new products on the market. Indeed if it allows the firm to develop new profitable activities, it directly influences the profit generation which takes part in capital growth. Following Winter (1964), it seems in our case the presence of at least one more rigorous firm in a population strengthens the strictness of the selection mechanism and thus the effectiveness of internal selection.
Proposition 4: The effectiveness of internal selection promotes firms' capital stock growth.
Table 2: Distribution of total capital stocks
Concerning technological performances, the box-plots on Table 3 show that all the configurations obtain on average the same results in term of capital productivity. The Tukey-Kramer tests confirm this observation.
If we consider the R&D for process innovation, whatever their propensity to take risks all firms use the same internal selection mechanism. Since there is no reason to think that some firms could use their R&D budget more efficiently 14, the differences between internal selection processes acting on diversification projects can explain those surprising results.
14
If we consider that on average R&D for process innovation gives the same results in all cases, it appears that firms with smaller R&D budgets for diversification and stricter selection criteria obtain the same results asfirms with a higher propensity to take risks which spend more in R&D. The quantity of resources firms dedicate to R&D does not seem to influence final performances, but the internal selection mechanism is central in the explanation of technological performance growth.
Proposition 5: The strictness of internal selection criteria acting on diversification projects positively influences the technological performances of firms.
The amount of R&D firms spend cannot guarantee better performances. To be efficient, the R&D policy of firms should simultaneously concern R&D budgets and internal selection criteria.
In this perspective, it could be interesting to test a new configuration with strict selection criteria and bigger R&D budgets.
Table 3: Distribution of capital productivity
4- Conclusion and Discussion
We have presented a micro-simulation model of internal selection developed in the tradition of the Schumpeterian competition model of Nelson & Winter (1982b). We focus on the idea that evolutionary works certainly cannot drop internal selection mechanisms in their analysis.
The model generates persistent differences between firms with different propensities to take risks, and the simulation results show that the weakness of internal selection
mechanisms slows down a firm's progress. In this case firms refer to market forces much more than to internal forces. Internal selection positively influences the firms' performances growth. Market selection and internal selection are complementary and essential to firm growth.
Finally the results suggest that the efficiency of internal selection refers to the strictness of its criteria. The stricter the internal selection criteria, the higher the survival probability, the higher the diversification and the better the technological performances. Cautious behaviors seem to be rewarded.
Therefore internal selection cannot be dropped from the evolutionary analysis of firms' and industries' evolution. In this perspective, there is room for a broader conceptualization of firms in favor of internal selection.
REFERENCES
Burgelman R. A., (1994), "Fading Memories : A Process Theory of Strategic
Business Exit in Dynamic Environments", Administrative Science Quarterly, Vol. 39, March, pp. 24-56.
Cohen M., Burkhart R., Dosi G., Egidi M., Marengo L., Warglien M., Winter S., (1996), "Routines and other recurring action patterns of organization:
contemporary research issues", Industrial and Corporate Change, Vol. 5, n° 3, pp. 653-698.
Cohendet P., Llerena P., Marengo L., (1998), "Theory of the Firm in an
Evolutionary Perspective : a critical assessment", Second Annual Conference of
International Society for New Institutional Economics, Paris, September 18-19. Dosi G., (1982), "Technological paradigms and technological trajectories", Research Policy, 11, pp. 147-162.
Dosi G., (1984), Technical Change and Industrial Transformation - The Theory and an Application to the Semiconductor Industry, Londres, Macmillan.
Dosi G., (1988a), "The nature of innovative process", in Dosi G., Freeman C.,
Nelson R., Silverberg G., Soete L., Technical change and economic theory, Londres et New York, Pinter Publishers, pp. 221-238.
Dosi G., (1988b), "Sources, procedures and microeconomic effects of innovation", Journal of Economic Literature, Vol. XXVI, September, pp. 11120-1171.
Dosi G. and Fagiolo G., (1998), "Exploring the Unknown. On Entrepreneurship,
Coordination and Innovation-Driven Growth", in Lesourne J. and Orléan A. (eds.),
Advances in Self-Organization and Evolutionary Economics, Londres, Economica,
pp. 308-350.
Dosi G., Nelson R., Winter S., (2000), Nature on dynamics of organizational capabilities, Oxford University Press, New York.
Jacoby N., (2003), "An Evolutionary Micro-Simulation Model of Internal
Selection", European Meeting on Applied Evolutionary Economics, Augsburg, Germany.
Jacoby N., (2002), L'influence des processus de sélection interne sur les performances des firmes. Un modèle évolutionniste de micro-simulation, Thèse de
Klepper S., (1996), "Entry, Exit, Growth, and Innovation over the Product Life
Cycle", The American Economic Review, vol.86, n°3, pp.562-583.
Klepper S., (2002), "Firm survival and the evolution of oligopoly", RAND Journal of Economics, vol.33, n°1, Spring, pp.37-61.
Levinthal D., (1991), "Random Walks and Organizational Mortality", Administrative Science Quarterly, vol.36, issue 3, pp.397-420.
Llerena P, Oltra V., (2002), "Diversity of innovative strategy as a source of
technological performance", Structural Change and Economic Dynamics, vol.13, pp. 179-201.
Llerena P, Oltra V., (2002), "Diversité des processus d’apprentissage et efficacité
dynamique des structures industrielles", Revue d’Economie Industrielle, n°98, pp.95-120.
Nelson R., Winter S., (1973), "Toward an Evolutionary Theory of Economic
Capabilities", The American Economic Review, Vol. 63, n° 2, pp. 440-449.
Nelson R., Winter S., (1982a), "The Schumpeterian Tradeoff Revisited", The American Economic Review, vol.72, issue1, pp.114-132.
Nelson R., Winter S., (1982b), An evolutionary Theory of Economic Change,
Harvard University Press, Cambridge (MA).
Plunket A., (2002), "The role of selection in the evolution of organizational
routines", Conference "Empirical research on routines in business and economics:
towards a research program", Odense, University of Southern Denmark, 3-4
November.
Schumpeter J., (1912, traduction française 1935), Théorie de l'évolution économique, Paris, Dalloz.
Teece D. J., Rumelt R., Dosi G., Winter S., (1994), "Understanding corporate
coherence. Theory and evidence", Journal of Economic Behavior and Organization, Vol. 23, pp. 1-30.
Valente M., (1998), "Laboratory for simulation development – Lsd",
http://www.business.auc.dk/~mv/.
Warglien M., (1995), "Hierarchical Selection and Organizational Adaptation", Industrial and Corporate Change, Vol. 4, n°1 pp. 161-186.
Warglien M., (2000), "The evolution of competences in a population of projects : a
Winter S. G., (1964), "Economic "natural selection" and the theory of the firm", Yale Economic Essays, Vol. 4, pp. 225-272.
Winter S., (1984), "Schumpeterian Competition in Alternative Technological
Regimes", Journal of Economic Behavior and Organization, vol.5, pp.287-320.
Yildizoglu M., (2001), "Modeling Adaptive Learning: R&D Strategies in the Model
of Nelson & Winter (1982)", http://yildizoglu.montesquieu.u-bordeaux.fr, 14 pages.
Zollo M. and Winter S., (1999), "From Organizational Routines to Dynamic
Capabilities", Working Paper of the Reginald H. Jones Center, The Wharton School, University of Pennsylvania, n° WP 99-07.
APPENDIX
• γ determines the share of total R&D budget dedicated to R&D for process innovation.
⎪
⎪
⎩
⎪⎪
⎨
⎧
>
−
>
−
−
+
−
−
−
−
=
otherwise
1
0
)
1
(
&
0
)
1
(
if
)
1
(
)
1
(
)
1
(
)
1
(
)
1
(
)
(
A
t
A
t
t
A
t
a
t
A
t
a
t
A
t
pd i pc i pd i pc i pc iγ
where a(t-1) returns the number of productive activities at t-1 in the firm. γ ∈ [0;1]. • Distribution rule of the total R&D budget for process innovation between the different productive activities:
⎪
⎪
⎪
⎩
⎪
⎪
⎪
⎨
⎧
≤
−
≤
−
>
−
⋅
−
⋅
−
=
∑
∑
0
)
1
(
if
0
0
)
1
(
&
0
)
1
(
if
)
(
)
1
(
)
(
)
1
(
)
(
t
A
t
A
t
A
t
RD
t
A
t
X
t
A
t
RD
pc ij j pc ij pc ij pc i j pc ij ij pc ij pc ij where⎩
⎨
⎧
−
>
=
otherwise
0
0
)
1
(
if
1
)
(
t
A
t
X
pc ij ij• β allows to determine the share of total R&D budget dedicated to R&D for diversification activities.