HAL Id: tel-01858451
https://hal.archives-ouvertes.fr/tel-01858451
Submitted on 6 Sep 2018HAL is a multi-disciplinary open access archive for the deposit and dissemination of sci-entific research documents, whether they are pub-lished or not. The documents may come from teaching and research institutions in France or abroad, or from public or private research centers.
L’archive ouverte pluridisciplinaire HAL, est destinée au dépôt et à la diffusion de documents scientifiques de niveau recherche, publiés ou non, émanant des établissements d’enseignement et de recherche français ou étrangers, des laboratoires publics ou privés.
Contribution to the experimental and theroretical study
of phase-change heat transfer for the thermal
management of electronics
Stéphane Lips
To cite this version:
Stéphane Lips. Contribution to the experimental and theroretical study of phase-change heat transfer for the thermal management of electronics. Thermics [physics.class-ph]. Institut National des Sciences Appliquées de Lyon; Université Claude Bernard Lyon 1, 2018. �tel-01858451�
N° 2018 HDR 004 Année 2018
HABILITATION A DIRIGER DES
RECHERCHES
présentée devant
l’Institut National des Sciences Appliquées de Lyon
et l’Université Claude Bernard LYON I
Contribution à l’étude expérimentale et théorique des transferts
thermiques avec changement de phase pour le contrôle thermique des
composants électroniques
SPECIALITE : Thermique et EnergétiquePar
Lips Stéphane
Soutenue le 06 Juin 2018 devant la Commission d’examen
Bertin Yves Professeur, ENSMA, Institut P Prime, rapporteur
Bonjour Jocelyn Professeur, INSA de Lyon, examinateur
Colin Catherine Professeur, INP/ENSEEIHT, IMFT Toulouse, rapporteur
Jallut Christian Professeur, Université Lyon 1, président
Khandekar Sameer Professeur, IIT Kanpur, India, rapporteur
Laraqi Najib Professeur, Université Paris-Nanterre examinateur
iii
Résumé
Le contrôle thermique des composants électroniques est un enjeu majeur dans de nombreuses applications industrielles. L’augmentation des puissances thermiques à dissiper sur des surfaces toujours plus petites rend les solutions de refroidissement traditionnelles, basées sur un refroidissement par air ou par liquide sans changement de phase, souvent obsolètes. Les solutions de contrôle thermique par voie diphasique peuvent permettre de répondre à ces besoins, sous réserve d’un dimensionnement fiable des systèmes concernés.
Cette habilitation à diriger les recherches est donc une contribution à l’étude expérimentale et théorique des phénomènes et des transferts thermiques au sein de systèmes de contrôle thermique avec changement de phase. Trois grands types de systèmes sont abordés : les caloducs, les condenseurs ou évaporateurs, et les amortisseurs thermiques (basés sur le changement de phase solide-liquide).
Mon parcours scientifique ainsi que son contexte scientifique est résumé dans l’introduction. Un état de l’art des solutions de contrôle thermique pour les composants électroniques, ainsi que les différentes problématiques scientifiques associées y sont aussi discutés de manières très globale. Les chapitres 2 à 4 représentent chacun un volet des recherches que j’ai pu effectuer tout au long de mon parcours. Les caloducs constituent des solutions particulièrement intéressantes pour le refroidissement de composants électroniques. Dans ce domaine, mes recherches sont essentiellement axées sur des analyses phénoménologiques des systèmes, ce qui permet de mieux appréhender leur comportement. L’utilisation de systèmes transparents, couplée au développement de modèles inverses et/ou mécanistiques, représente une des particularités du CETHIL dans ce type d’analyse. Quelques exemples d’études sont présentés dans le chapitre 2.
Lorsque les solutions passives ne suffisent plus, les phénomènes d’ébullition et de condensation convectives peuvent être utilisés au sein d’évaporateurs et de condenseurs. Dans le chapitre dédié, l’effet de forces de frottements, de capillarité, de gravité et d’inertie sur la structure de ce type d’écoulements, les pertes de charges et les transferts thermiques sont discutés, en particulier dans le cas d’écoulements en tubes inclinés. La synthèse permet de mettre en avant les similitudes et différences des écoulements en ébullition et en condensation convectives.
Dans certaines applications, les sollicitations thermiques sont extrêmement fluctuantes. L’enjeu n’est alors plus d’évacuer la chaleur, mais de limiter les pics de températures dues aux sollicitations transitoires. Le concept d’amortisseur thermique, couplant un matériau à changement de phase solide-liquide et une matrice à haute conductivité thermique, peut être utilisé pour augmenter l’inertie thermique apparente du système à contrôler. Le dernier chapitre est donc consacré à l’étude de l’un de ces types de système, composé de paraffine dans une structure de nanotubes de carbone densifiés, elle-même insérée dans une cavité en silicium.
Au sein de chacun de ces chapitres, un bref état de l’art est proposé et les différentes approches, théoriques, de modélisation et expérimentales sont présentées. Des perspectives sont proposées à la fin de chaque chapitre, puis synthétisées et priorisées dans la conclusion finale.
iv
Abstract
Thermal management of electronic components is a major issue in many industrial applications. The continuous increase of the heat power to be dissipated on smaller surfaces makes many traditional cooling systems obsolete. Two-phase cooling systems can be used to cater to such cooling specifications, but have to be carefully designed.
The present habilitation thesis to supervise research (HDR) is thus a contribution to the experimental and theoretical study of heat transfer in two-phase cooling systems. Three types of systems are considered: Heat pipes, condensers or evaporators, and thermal dampers (involving solid-liquid phase change).
My research path and its scientific context are presented in the introduction. The general overview of the various systems for the cooling of electronics, as well as the main scientific issues involved are also outtired. Chapters 2 to 4 then present the three components of my research, linked to the three types of systems.
Heat pipes are very interesting solutions to the thermal management of electronic component. In this field, my work consists mainly in phenomenological analyses of the various systems, in order to achieve a better understanding of their behaviour. One of the specificities of the approaches followed by the CETHIL is the coupling between transparent device characterisations and the development of inverse or mechanistic models. Examples are presented in chapter 2.
When passive cooling solutions cannot fit the specifications, convective boiling and condensation phenomena can be used to increase the thermal efficiency of the systems. In the dedicated chapter, the effects of the frictional, inertial, capillary and gravitational forces on the flow regime, the heat transfer and the pressure drops are discussed, particularly in inclined configurations. As a conclusion, the similitudes and differences between condensing and evaporating flows are discussed.
In applications such as telecommunications, electronics components are subject to large thermal transients. In order to limit their temperature variation, thermal dampers can be used in order to increase the apparent thermal inertia of the system. They consist in the coupling between a solid-liquid phase-change material with a high thermal conductivity structure. The last chapter is devoted to the study of such a system, made of paraffin inserted in an array of densified carbon nanotubes ; the integrated unit directly inserted into the silicon substrate of an electronic component.
In each chapter, a brief literature review is presented and the various scientific approaches, which I followed, are presented (theoretical, modelling, and experimental). Perspectives are discussed at the end of each chapter, and are then summarised and prioritised in the final conclusion.
v
Contents
R
ESUME...
IIIA
BSTRACT...
IVC
ONTENTS...
VL
IST OF FIGURES...
VIIL
IST OF TABLES...
XIN
OMENCLATURE...
XIIIC
HAPTER1:
I
NTRODUCTION AND CONTEXT... 1
1.1 Personal context ... 1
1.2 Industrial and scientific challenges in the thermal management of electronic components ... 2
1.3 Overview of my research ... 3
C
HAPTER2:
P
ASSIVE SYSTEMS BASED ON THE LIQUID-
VAPOUR PHASE CHANGE:
H
EAT PIPES AND RELATED... 5
2.1 Working principle, history and applications... 5
2.2 General approach of the scientific community ... 7
2.2.1 Research motivated by the heat pipe characterization ... 8
2.2.2 Scientific issues linked to the working Fluid behaviour ... 10
2.2.3 Studies aiming to predict the phase change heat transfer in thin films ... 12
2.2.4 The development of new heat pipe models ... 14
2.2.5 Summary and Conclusions ... 14
2.3 The heat pipe: an old concept full of scientific challenges ... 14
2.3.1 Heat pipe modelling ... 15
2.3.2 A research strategy based on a phenomenological analysis ... 19
2.3.3 On the difficulty of characterizing a heat pipe ... 21
2.3.4 Example of theoretical study: Definition of an utility criterion ... 25
2.4 When heat pipe scientific issues meet technological issues (or maybe the opposite?) ... 28
2.4.1 The case of the loop heat pipes ... 28
2.4.2 Toward new heat pipe designs? ... 31
2.4.3 Example of active control of heat pipes: application of EHD forces ... 33
2.4.4 Plastic heat pipe: expectations and limits ... 36
2.5 Conclusions and perspectives ... 38
C
HAPTER3:
A
CTIVE COOLING SYSTEMS:
CONVECTIVE BOILING AND CONDENSATION... 39
3.1 Scientific context ... 39
3.1.1 General description of two-phase flows ... 39
3.1.2 Characterisation techniques for two-phase flows ... 41
3.1.3 Force balance in two-phase flows: effect of the tube inclination ... 43
3.2 Experimental test benches and flow pattern characterisation ... 45
3.2.1 Description of the experimental test benches ... 45
vi
3.2.3 Database analysis for the construction of a symmetry correlation ... 49
3.2.4 Conclusions ... 53
3.3 Effect of the tube orientation on the heat transfer ... 53
3.3.1 Experimental determination of the heat transfer coefficient ... 53
3.3.2 Convective condensation ... 54
3.3.3 Convective boiling ... 57
3.3.4 Conclusions ... 59
3.4 Effect of the tube orientation on the pressure drops ... 59
3.4.1 Pressure drops measurements ... 60
3.4.2 The notion of apparent gravitational pressure drop and void fraction ... 62
3.4.3 Theory or philosophy? Discussion on the physical meaning of a pressure drop decomposition ... 64
3.4.4 An optimum inclination angle in terms of Entropy generation? ... 71
3.5 Conclusions and perspectives ... 72
C
HAPTER4:
P
ASSIVE SYSTEMS USING THE SOLID-
LIQUID PHASE CHANGE:
THE NOTION OF THERMAL DAMPER... 75
4.1 Principle and general overview of the applications ... 75
4.2 The need for the notion of ideal thermal damper ... 76
4.3 Experimental characterisation of a thermal damper ... 80
4.3.1 Samples and test benches ... 80
4.3.2 Optical approach and calibration ... 81
4.3.3 Heat storage capacity characterisation ... 82
4.3.4 Thermal resistance characterisation ... 83
4.4 Optical non-destructive testing ... 85
4.5 Conclusions and perspectives ... 88
C
HAPTER5:
C
ONCLUSIONS AND PERSPECTIVES... 89
5.1 Conclusions of the present analysis ... 89
5.2 Research perspectives ... 90
R
EFERENCES... 91
L
IST OF PUBLICATIONS... 103
vii
List of figures
Figure 1-1. Simplified timeline of the various projects and supervisions in which I have been involved ... 2
Figure 1-2. Evolution of the transistors number per chip and the clock speed of microprocessors (Waldrop, 2016) ... 2
Figure 1-3. Evolution of the size of the electronic component (Waldrop, 2016) ... 2
Figure 1-4. 3D electronic component (sources left: Fraunhofer IZM; centre: ITRS 2009; right: AES, Samsung) ... 2
Figure 1-5. Example of 3D electronic component manufactured by ST-Ericsson / CEA (Vivet and Guérin, 2011) .. 3
Figure 1-6. Maximal admissible temperature on various location of a cell phone (Kinkelin, 2016)... 3
Figure 1-7. Various systems used for the thermal management of electronic components. In green, the systems which I had the opportunity to study. In blue, the systems I used commonly as an engineer tool ... 4
Figure 2-1. Different heat pipe technologies (Lips, 2015) ... 5
Figure 2-2. Number of papers dedicated to heat pipes according to the database of Web of ScienceTM (Lips, 2015) ... 7
Figure 2-3. Experimental characterization of the operating regime of a PHP by means of a thermal camera (Karthikeyan et al., 2014) ... 10
Figure 2-4. Visualisation and modelling of the vapour region in the evaporator of a LHP (Mottet et al., 2015) .. 10
Figure 2-5. Possible clogging of nanoparticles in a nucleating cavity affecting the boiling phenomenon (Khandekar et al., 2008) ... 12
Figure 2-6. Number of publications dedicated to nanofluids in heat pipes according to the database of Web of ScienceTM ... 12
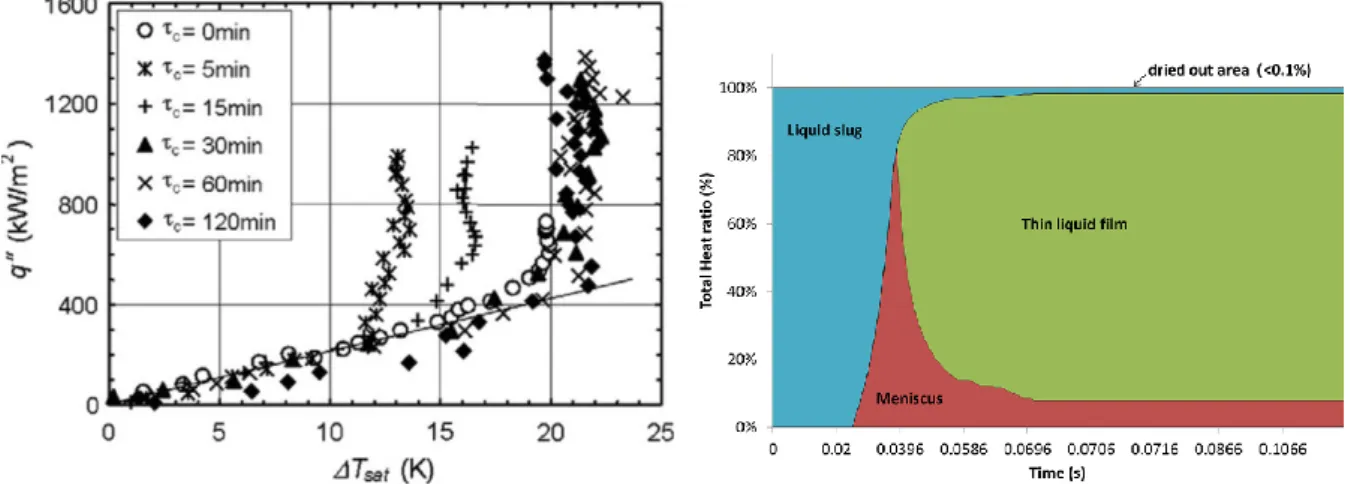
Figure 2-7. Example of the effect of the nanostructuration of the wall on the boiling curve obtained with γ-Fe203 nanoparticle on a 100 µm platinum wire. τc is the nano-particle coating duration with pure water (Stutz et al., 2011) ... 13
Figure 2-8. Distribution of the heat transferred from the wall to the fluid during the passage of a meniscus (Chauris et al., 2015) ... 13
Figure 2-9. Various levels of nodal models ... 15
Figure 2-10. Geometries and corresponding domains for three heat pipe configurations (Lips and Lefèvre, 2014) ... 16
Figure 2-11. Example of thermal and hydrodynamic results obtained with the analytical model for a flat plate heat pipe with three heat sources and two heat sinks (Lips and Lefèvre, 2014) ... 17
Figure 2-12. Example of phenomena occurring in heat pipes and difficult to consider in a 3D model ... 17
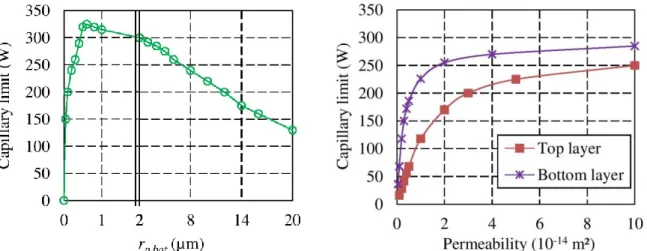
Figure 2-13. Schematic of the evaporator with double layer wick (Giraudon et al., 2017a) ... 18
Figure 2-14. Capillary limit as a function of the bottom layer pore radius (left) and of the top and bottom layer permeabilities (right) (Giraudon et al., 2017a) ... 19
Figure 2-15. Flat heat pipe configurations tested by Alba Fornells-Vernet , adapted from (Fornells-Vernet, 2012) ... 20
Figure 2-16. Example of heat pipe performance for various configurations (Lips et al., 2013) ... 20
Figure 2-17. Example of comparison between an experimental temperature profile and the corresponding profile calculated by the inverse method (𝑄 = 20 W; horizontal orientation) (Revil-Baudard and Lips, 2015) ... 21
Figure 2-18. Example of equivalent thermal conductivity determination by means of the inverse method (Levap = 140 mm, horizontal orientation) (Revil-Baudard and Lips, 2015) ... 21
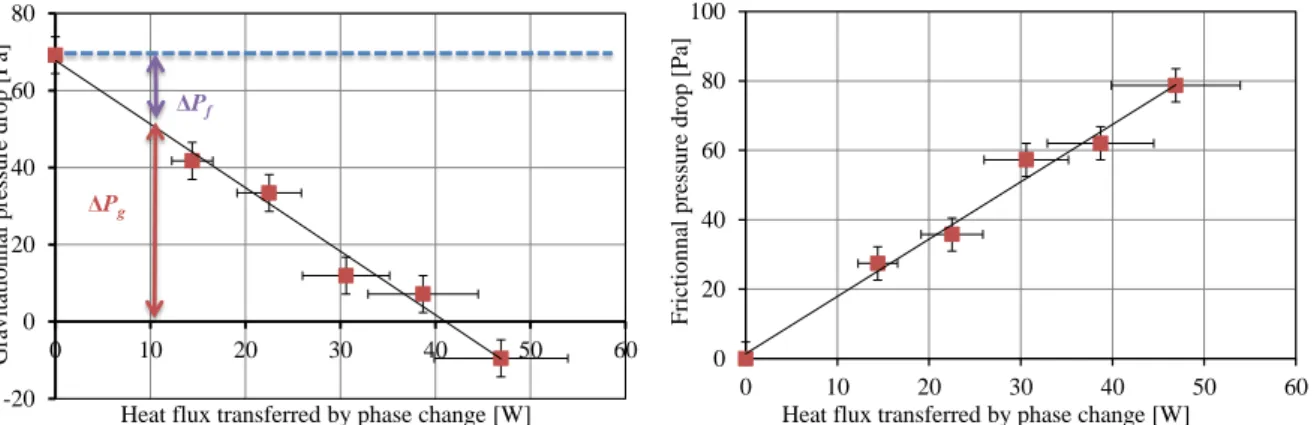
Figure 2-19. Example of evolution of the gravitational pressure drop as a function of the heat transfer rate transferred by phase change (Levap = 140 mm) (Revil-Baudard and Lips, 2015) ... 22
Figure 2-20. Example of the frictional pressure drop as a function of the heat transfer rate (Levap = 140 mm) (Revil-Baudard and Lips, 2015) ... 22
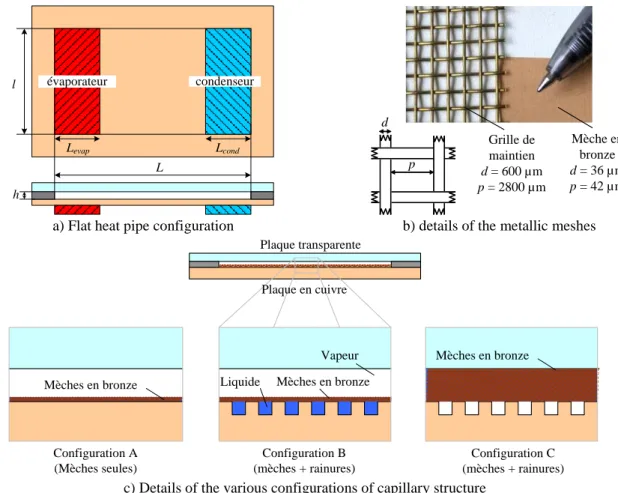
Figure 2-21. Example of sample manufactured by Rémi Giraudon during his PhD (Giraudon et al., 2017b) ... 22
Figure 2-22. 3D view of the experimental test bench (Giraudon et al., 2017b) ... 22
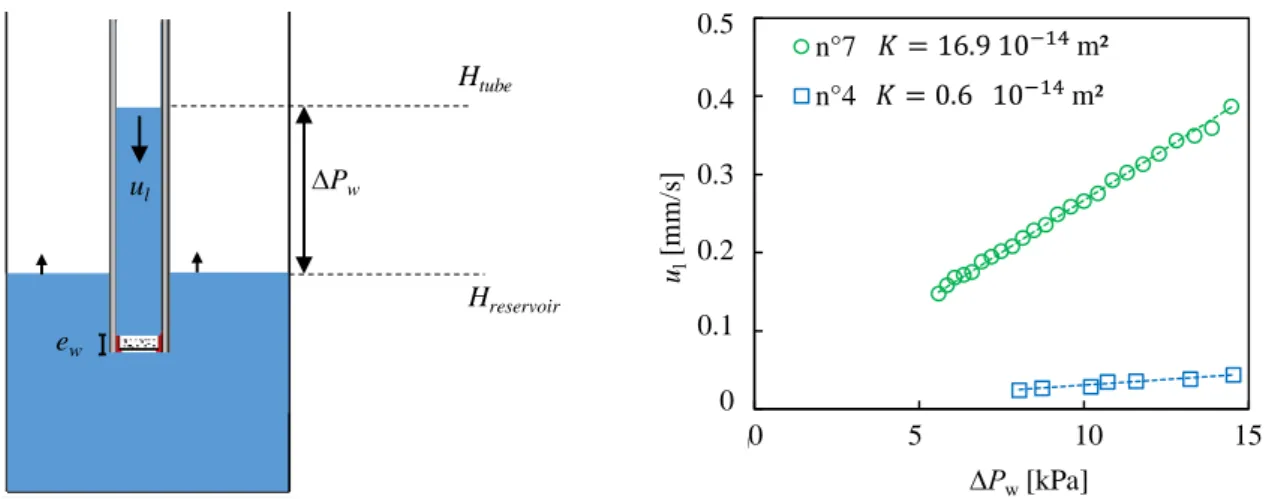
Figure 2-23. Operating principle of the test bench when measuring the permeability (Giraudon et al., 2017b) . 23 Figure 2-24. Example of determination of the permeability for two samples (Giraudon et al., 2017b) ... 23
Figure 2-25. Operating principle when measuring the effective pore radius (Giraudon et al., 2017b) ... 23
Figure 2-26. Example of evolution of the water level during the test (Giraudon et al., 2017b) ... 23
Figure 2-27. 3D view and schematic of the thermal test bench (Giraudon et al., 2017b) ... 24
Figure 2-28. Example of a sample thermal characterisation (Giraudon et al., 2017b) ... 24
Figure 2-29. Evolution of the heat transfer coefficient for each sample with water (Giraudon et al., 2017b) .... 24
viii
Figure 2-31. Comparison of the maximum heat flux of the various samples between water and pentane
(Giraudon et al., 2017b) ... 25
Figure 2-32. Comparison of the maximum heat transfer coefficient of the various samples between water and pentane (Giraudon et al., 2017b) ... 25
Figure 2-33. Example of studied configuration. The heat sink is not represented (Lips et al., 2017b) ... 25
Figure 2-34. Examples of temperature fields in the PCB, calculated by CFD modelling for two different heat transfer coefficient with the heat sink (𝑄 = 25 W/components and Tamb = 0°C) (Lips et al., 2017b) ... 26
Figure 2-35. Heat spreading efficiency of the PCB presented on figure 2-33 (In the present example, Rcond,0 = 0.4 K/W) (Lips et al., 2017b) ... 27
Figure 2-36. Thermal gain of a flat heat pipe for Sb/Stot = 1 (Lips et al., 2017b) ... 27
Figure 2-37. Thermal gain of a flat heat pipe for Sb/Stot = 0.25 (Lips et al., 2017b) ... 27
Figure 2-38. Thermal gain for various PCB spreading efficiency, characterized by Rcond,0 (Lips et al., 2017b) ... 27
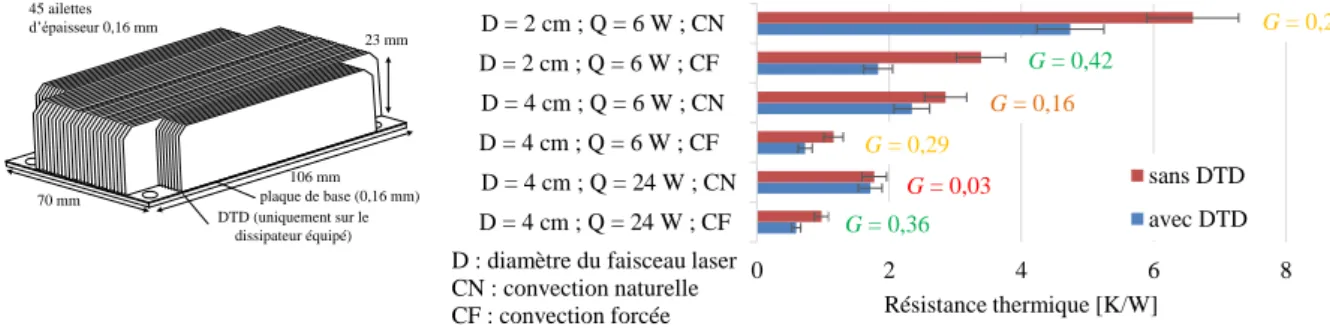
Figure 2-39. Configuration characterized, with and without flat heat pipe (left) and its thermal resistance measured with various heating and cooling conditions (right) (D: heating spot diameter, CN: Natural convection, CF: forced convection, sans DTD: without flat heat pipe, avec DTD: with flat heat pipe) (Lips et al., 2017b)... 28
Figure 2-40. Heat leaks in a cylindrical evaporator (Giraudon, 2017) , adapted from (Siedel, 2014)) ... 28
Figure 2-41. Thermal expansion coefficient for various polymers, metals and ceramics (Giraudon, 2017). ... 30
Figure 2-42. SEM pictures of a sintered samples made of zircone (left) and copper (right) (Giraudon, 2017) ... 30
Figure 2-43. SEM pictures of a freeze casted sample: top view (left) and side view (right) (Giraudon, 2017) ... 30
Figure 2-44. Experimental set-up with the confined thermosiphon (Narcy et al., 2017) ... 31
Figure 2-45. Flow visualizations with the transparent heat spreader. Initial filling ratio: 30% of the spreader volume, Q = 500 W in (b) and (c) (Narcy et al., 2017) ... 32
Figure 2-46. Influence of inclination on the heat spreader thermal performance (Narcy et al., 2017) ... 32
Figure 2-47. Evolution of the spreader thermal resistance for various filling ratios (Narcy et al., 2017) ... 32
Figure 2-48. Schematic of a two-phase heat spreader with integrated fins ... 33
Figure 2-49. Example of condensation pattern in an array of transparent tube (Berut, 2016) ... 33
Figure 2-50. Example of the effect of electric field on the interface shape (Cardin et al., 2017) ... 34
Figure 2-51. Effect of an electric field at meniscus recession for FC-72 (Cardin et al., 2017) ... 34
Figure 2-52. Effect of an electric field on the pressure jump for FC-72 (Cardin et al., 2017) ... 34
Figure 2-53. Effect of an electric field on the maximal pressure for FC-72 (Cardin et al., 2017) ... 34
Figure 2-54. Schematic of the experimental set up of Cardin et al. (2018) ... 35
Figure 2-55. Evolution of the hydrostatic pressure drop along central groove an angle of 5° and a partial electrode. The solid blue line represents the analytical solution in the absence of electric field. The blue dots are the experimental results in the absence of electric field, the red dots the experimental results in presence of the electric field (Cardin et al., 2018) ... 35
Figure 2-56. Comparison between measurements (marks) and the numerical prediction (solid lines) of the effect of an electric field on the curvature evolution of a meniscus in an inclined groove (Cardin et al., 2018) ... 35
Figure 2-57. Example of prototype manufactured by Elise Berut (Berut, 2016) ... 37
Figure 2-58. Example of contribution of the various thermal resistance of the system (conv: convection ; c,cond: conduction at the condenser ; c,évap: conduction at the evaporator) (Berut, 2016) ... 37
Figure 3-1. Flow pattern map of Wojtan et al. (2005) ... 40
Figure 3-2. The different types of flow patterns considered in the study of Lips and Meyer (2012a). Discrimination were performed only visually ... 40
Figure 3-3. Flow patterns considered by Layssac et al. in his PhD (2018a). The determination of the top and bottom liquid thicknesses enables to use quantitative indicators ... 40
Figure 3-4. Geometry considered by Taitel and Dukler (1976) for stratified flow ... 40
Figure 3-5. Pumping action of the disturbance waves, adapted from Fukano and Ousaka (1989) ... 40
Figure 3-6. Example of comparison between experiments and simulations of a growing bubble in a subcooled convective flow (Lal et al., 2015) ... 41
Figure 3-7. Example of boiling modelling taking into account the bubble merging (Sato and Niceno, 2017) ... 41
Figure 3-8 Example of heated transparent test section by means of an ITO coating (Narcy et al., 2014) ... 41
Figure 3-9 Superposition of IR and visible images of a saturated R11 flow for increasing heat fluxes (Ozer et al., 2011) ... 41
Figure 3-10 Example of liquid film LIF visualization (Schubring et al., 2010) ... 42
Figure 3-11 Three-dimensional wavy structure for entrainment regimes (Alekseenko et al., 2012) ... 42
Figure 3-12. Flow pattern amp of Bhagwat et Ghajar (2016b) for upward air-water flow in a 12,7 mm inner diameter smooth tube ... 43
ix
Figure 3-13. Flow pattern amp of Bhagwat et Ghajar (2017) for downward air-water flow in a 12,7 mm inner
diameter smooth tube ... 43
Figure 3-14. Example of pressure drop evolution as a function of the inclination angle (air-water flow in a 4.55 mm inner diameter pipe) (Spedding et al., 1982) ... 44
Figure 3-15. Example of evolution of the heat transfer coefficient as a function of the tube inclination for convective boiling of HFE 7100 in a 0.44 mm inner diameter channel (Hsu et al., 2015a) ... 44
Figure 3-16. Picture and schematic diagram of the experimental setup of Lips and Meyer (2011b) for the study of convective condensation in an inclined orientation ... 45
Figure 3-17. Schematic of the test bench of Layssac et al. (2018a) for the study of convective boing in inclined orientation ... 45
Figure 3-18. Schematic of the test section of Charnay et al. (2014) ... 46
Figure 3-19. Photo and schematic of the evaporator of Layssac et al. (2018a) ... 46
Figure 3-20. Effect of the inclination angle on the flow pattern for different mass fluxes (R134a, d = 8.38 mm, x = 0.5) (Lips and Meyer, 2012a) ... 47
Figure 3-21. Evolution of flow patterns (pink: intermittent; blue: stratified; green: annular) and time representative frames for various vapour qualities and inclination angles (R245fa, d = 1.6 mm, G = 150 kg.m-2.s -1) (Layssac et al., 2018a) ... 47
Figure 3-22. Example of experimental flow pattern map of Lips and Meyer (2012c) (R134a, d = 8.38 mm, G = 200 kg/m²s) ... 47
Figure 3-23. Example of experimental flow pattern map of Layssac et al. (2018a) (R245fa, d = 1.6 mm, G = 150 kg.m-2.s-1 ; φ = 0 kW.m-2) ... 47
Figure 3-24. Comparison of experimental flow patterns of Lips and Meyer (2012a) and Layssac et al. (2018a) with the Barnea (1987) flow pattern map (An = Annular, I = Intermittent, S = Stratified) ... 48
Figure 3-25. Example of the heat flux effect on the flow pattern (Layssac et al., 2018a) ... 49
Figure 3-26. Flow patterns with φ = 13,5 kW.m-2 compared to the adiabatic conditions (G = 150 kg.m-2.s-1) (Layssac et al., 2018a) ... 49
Figure 3-27. Position of the vapour core centre for a horizontal two-phase flow (Layssac et al. (2017)) ... 50
Figure 3-28. Base parameters correlation (Layssac et al., 2017) ... 51
Figure 3-29. Evolution of the Mean Squared Error with the imposed exponents (Layssac et al., 2017) ... 51
Figure 3-30. Correlation with the Bond number, the Froude number and the Lockhart-Martinelli parameter (Layssac et al., 2017) ... 52
Figure 3-31. Evolution of the Mean Squared Error with imposed dimensionless number exponents (Layssac et al., 2017) ... 52
Figure 3-32. Measured symmetry as a function of predicted symmetry for Bd, χ and Frvo correlation (Layssac et al., 2017) ... 52
Figure 3-33. Top and side view of the IR test section. Polycarbonate plates enables to measure the equivalent temperature of the test section surroundings (Layssac et al., 2018b) ... 54
Figure 3-34. Black body temperature field of the test section. The edges of the tube appear hotter because of the angle dependence of the ITO coating emissivity (Layssac et al., 2018b) ... 54
Figure 3-35. Variations of the ITO deposit emissivity with abscissa for sapphire outer wall temperature of 70°C, 80°C and 90°C (Layssac et al., 2018b) ... 54
Figure 3-36. Thermal model at abscissa z and electric equivalent schematic (Layssac et al., 2018b) ... 54
Figure 3-37. Experimental heat transfer coefficient during convective condensation of R134a in a 8.38 mm tube (G = 200 kg/m²s, -90° : downwards, 0° : horizontal; 90° vertical upwards) (Lips and Meyer, 2012c) ... 55
Figure 3-38. Inclination effect on heat transfer coefficients during convective condensation of R134a in a 8.38 mm tube for various mass fluxes (x = 0.5) (Lips and Meyer, 2012a) ... 55
Figure 3-39. Map of the inclination effect on heat transfer coefficients drawn on the Thome-El Hajal-Cavallini (El Hajal et al., 2003) flow pattern map (Lips and Meyer, 2012a) ... 55
Figure 3-40. Flow patterns and heat transfer coefficients for downward flows at low mass fluxes and low vapour qualities (Lips and Meyer, 2012a) ... 55
Figure 3-41. Pressure drops predicted by the model of Taitel and Dukler compared with experimental results obtained for convective condensation of R134a in a 8.38 mm tube (Lips and Meyer, 2012b) ... 56
Figure 3-42. Modified model of Taitel and Dukler (1976) for convective condensation in inclined tubes (Lips and Meyer, 2012c) ... 56
Figure 3-43. Scheme of the thermal model for the heat transfer coefficient determination for convective condensation in inclined tubes (Lips and Meyer, 2012c) ... 56
x
Figure 3-44. Comparison of the model predictions with experimental results (G = 200 kg/m²s). Dashed lines mean that the flow is not stratified according to Crawford et al. (1985)(Lips and Meyer, 2012c) ... 57 Figure 3-45. Influence of different assumptions on the model predictions. FFHTC: Falling film heat transfer coefficient (G = 200 kg/m²s ; x = 0.3; ΔT = 2 K) (Lips and Meyer, 2012c) ... 57 Figure 3-46. Variations of the heat transfer coefficient with the inclination angle for various mass fluxes
(x = 0.06) (Layssac, 2018) ... 57 Figure 3-47. Variations of the heat transfer coefficient with the vapour quality for various inclination angle (G = 148 kg/m²s) (Layssac, 2018) ... 57 Figure 3-48. Variations of the heat transfer coefficient with the inclination angle for various heat fluxes (x = 0.12; G = 150 kg/m²s) (Layssac, 2018) ... 58 Figure 3-49. Prediction of the variations of the nucleate and convective heat transfer mode with vapour quality from Bertsch et al. (2009) model for a mass velocity of 150 kg.m-2.s-1 (Layssac, 2018) ... 59
Figure 3-50. Measured pressure drops for different vapour qualities (R134a, d = 8.38 mm; G = 300 kg/m²s) (Lips and Meyer, 2012b) ... 60 Figure 3-51. Measured pressure drops for different mass fluxes (R134a, d = 8.38 mm; x = 0.5) (Lips and Meyer, 2012b) ... 60 Figure 3-52. Evolution of total pressure gradient as a function of the inclination angle for convective boiling of R245fa in a 1.6 mm tube and a mass velocity of 150 kg.m-2.s-1 (Layssac et al., 2018a) ... 61
Figure 3-53. Comparison of pressure gradient evolution with inclination angle with an imposed heat flux of 13.5 kW.m-2 (filled lines) and without heat flux (dot lines) (Layssac et al., 2018a) ... 61
Figure 3-54. Evolution of the frictional pressure gradient as a function of the inclination angle (R134a, d = 8.38 mm; G = 200 kg/m²s) ... 62 Figure 3-55. Evolution of the frictional pressure gradient as a function of the inclination angle for a mass
velocity of 150 kg.m-2.s-1 (Layssac et al., 2018a) ... 62
Figure 3-56. Apparent gravitational pressure drops for various vapour qualities and mass fluxes as a function of inclination angle (R134a, d = 8.38 mm)(Lips and Meyer, 2012b) ... 63 Figure 3-57. Effect of inclination angle on the apparent void fraction and comparison with different correlations (R134a, d = 8.38 mm, G = 300 kg/m²s). The thick horizontal lines represent the mean apparent void fraction between -5° and 90° (Lips and Meyer, 2012b) ... 63 Figure 3-58. Apparent void fraction for horizontal and upward flows and comparison with different correlations (R134a, d = 8.38 mm, G = 300 kg/m²s) (Lips and Meyer, 2012b) ... 64 Figure 3-59. Comparison of the momentum pressure drop calculated by the traditional and the energy approach (Lips and Revellin, 2013)... 66 Figure 3-60. Comparison of the gravitationnal pressure drop calculated by the traditional and the energy approach (Lips and Revellin, 2013) ... 66 Figure 3-61. Impact of the approach for the frictional pressure drop determination (Lips and Revellin, 2013) ... 67 Figure 3-62. Thermodynamic cycle of a heat pump. Solid lines: optimal cycle. Dashed lines: cycle considering irreversibilities in the condenser (Lips and Meyer, 2012d) ... 71 Figure 3-63. Determination of the initial temperature difference of condensation for L = 5 m (Lips and Meyer, 2012d) ... 71 Figure 3-64. Effect of the condenser length (G = 200 kg/m²s) (Lips and Meyer, 2012d) ... 72 Figure 3-65. Determination of the condenser length for an initial temperature difference of condensation equal to 5 K (Lips and Meyer, 2012d)... 72 Figure 3-66. Map of the inclination effect on the flow pattern (R134a, d = 8.38 mm) (Lips and Meyer, 2012e) .. 72 Figure 3-67. Map of the inclination effect on the heat transfer coefficient (R134a, d = 8.38 mm) (Lips and Meyer, 2012e) ... 72 Figure 3-68. Map of the inclination effect on the apparent void fraction (R134a, d = 8.38 mm) (Lips and Meyer, 2012e) ... 73 Figure 3-69. General map of the inclination effect (R134a, d = 8.38 mm) (Lips and Meyer, 2012e) ... 73 Figure 4-1. Classification of the various material used for thermal storage applications (Kinkelin, 2016; after Zalba et al., 2003) ... 75 Figure 4-2. Design of the thermal damper (Kinkelin et al., 2017) ... 76 Figure 4-3. Thermal impedance in the single-phase zone of the ideal thermal damper associated to the
geometry considered in figure 4-2 (Kinkelin et al., 2017)... 77 Figure 4-4. Thermal behaviour of an ideal thermal damper subjected to a sinusoidal heat flux (Kinkelin et al., 2017) ... 78 Figure 4-5. Gain of the equivalent filter of an ideal thermal damper (Kinkelin et al., 2017) ... 79
xi
Figure 4-6. Impedance of an ideal thermal damper in the two-phase zone (Kinkelin et al., 2017) ... 79
Figure 4-7. Attenuation due to the phase change (Kinkelin et al., 2017) ... 79
Figure 4-8. Non-ideal thermal damper behavior compared to the ideal one (p = 25 µm, σT = 5 K) (Kinkelin et al., 2017) ... 80
Figure 4-9. Effect of the honeycomb dimension p (δq = 1 W cm-2; h ref = 0 W m-2 K-1; σT = 5 K) (Kinkelin et al., 2017) ... 80
Figure 4-10. Typical pictures of the studied thermal dampers (Kinkelin et al., 2017) ... 81
Figure 4-11. SEM images of different configurations of the CNT array: edge of a standard CNT array (a), array with holes (b), array with holes and hexagonal splits before (c) and after (d) densification (images and fabrication: CEA-Liten) (Kinkelin et al., 2017) ... 81
Figure 4-12. Main components of the test bench (top view, not to scale) (Kinkelin et al., 2017) ... 81
Figure 4-13. Picture of the test bench for the thermal cycle characterization (Kinkelin, 2016) ... 81
Figure 4-14. Schematic view of an experimental configuration used to measure the transmittance of the black paint layer and summarizing the various contributions seen by the IR camera (Kinkelin, 2016) ... 82
Figure 4-15. Equivalent emissivity of the painted silicon plate as a function of the plate temperature, for various integration times, acquisition frequency and various dates (day 1, 2 or 3) (Kinkelin, 2016) ... 82
Figure 4-16. Estimation of the temporal shift due to the black paint layer (solid line: measured thermogramm after a laser crenel of 11 ms. dotted line: simulation of the behaviour without the paint layer) (Kinkelin, 2016) 82 Figure 4-17. Thermal boundary conditions for the TIM-TS (Kinkelin et al., 2015) ... 83
Figure 4-18. Temperature history of prototype thermal dampers with and without PCM (Kinkelin et al., 2017) 83 Figure 4-19. Estimated total apparent thermal capacity (mcp)tot of the samples with and without PCM versus DSC measurements (Kinkelin et al., 2017) ... 83
Figure 4-20. Latent heat storage capacity of the CNT/PCM material as a function of the number of fusion/solidification cycles (Kinkelin et al., 2017)... 83
Figure 4-21. Measured temperature history of the back side of a prototype thermal damper subjected to a 10 ms laser crenel (DL: digital level of the IR camera) (Kinkelin et al., 2017)... 84
Figure 4-22. Thermal model of the thermal damper subjected to a laser flash (Kinkelin et al., 2017) ... 84
Figure 4-23. Total thermal resistance of Si/CNT/Si samples with various lengths of CNTs (Kinkelin et al., 2017) 85 Figure 4-24. Estimated total thermal resistance of the best THERMA3D samples (A-F) compared to those of the CNT arrays reported in the review article of Marconnet et al. (2013) (Kinkelin et al., 2017) ... 85
Figure 4-25. Samples SI-PCM-SI placed in vertical orientation and heated up to the complete fusion of the PCM. The IR visualization of the front and back side are presented as a function of the time (Kinkelin, 2016) ... 86
Figure 4-26. Example of IR visualization for a sample above the ambient temperature (Kinkelin, 2016) ... 87
Figure 4-27. Schematic illustration of the contributions to the infrared signal measured by the IR camera (Kinkelin et al., 2015)... 87
Figure 4-28. IR radiation of the upstream silicon and the stamping layer of unpainted samples “CNT-P” and “CNT-A” (Kinkelin et al., 2015) ... 88
Figure 4-29. IR radiation of the downstream silicon and the CNT array of unpainted samples P” and “CNT-A” (Kinkelin et al., 2015) ... 88
List of tables
Table 2-1. Specifications for the wick characteristics (Giraudon et al., 2017a) ... 19Table 2-2. Chemical compatibility between various fluids and various materials (Giraudon, 2017) ... 29
Table 2-3. Summary of the studies dedicated to heat pipes made of polymer (Berut, 2016) ... 36
Table 3-1. Applications of fluorescence and phosphorescence techniques for the two-phase flow characterisation (Martel et al., 2018) ... 42
Table 3-2. Summary of the studies dealing with the effect of inclination angle on the heat transfer (Layssac, 2018) ... 44
Table 3-3. Summary of the characteristics and range of experimental conditions for each test-sections ... 46
Table 3-4. Database used by Layssac et al. (2017) for the symmetry correlation construction ... 50
Table 3-5. Correlation coefficients of the present database flow parameters (Layssac et al., 2017) ... 51
Table 3-6. Heat transfer coefficient prediction accuracy of various models (Layssac et al., 2018b) ... 59
Table 4-1. Influence of the manufacturing process on the thermal resistance of two silicon plates linked by non-densified CNTs (Kinkelin, 2016) ... 84
xiii
Nomenclature
A Cross section m²
Amn, A’mn, Bmn, B’mn Fourier coefficient -
Bo Bond number -
cp Heat capacity J/kgK
d Diameter m
E Electric field V/m
f Frequency Hz
f Fanning friction factor -
Fr Froude number -
g Gravity acceleration m²/s
G Gain -
G Mass flux kg/m²s
G Thermal conductance W/K
h Heat transfer coefficient W/m²K
h, h° Specific enthalpy, total specific enthalpy J/kg
H Enthalpy J H Hydraulic head m I Inclination effect - K Permeability m² L Length m L Luminance W m, n, M, N Integer - m, Mass kg
𝑚̇ Mass flow rate kg/s
Nmcp Non-dimensional total thermal capacity -
Nmhls Non-dimensional latent heat of phase change -
MAPE Mean Absolute Percentage Error variable
MPE Mean Percentage Error variable
MSE Mean squared error variable
p Perimeter m
P Pressure Pa
PEDCx Percentage of Data Captured within ± x% variable
q Heat flux W/m²
Q Heat transfer rate W
r Radius m R Thermal resistance K/W s Symmetry parameter - s Specific entropy J/kg S Area m² S’ Entropy generation W t Time s t Thickness m T Temperature K u Velocity m/s v Specific volume m3/kg V Voltage V w Relative weight - Wt Mechanical work W
x Vapour quality (for two-phase flows) -
x Liquid fraction (for PCM) -
x, y, z Coordinates m
X, Y, Z Non-dimensional coordinates -
xiv Greek symbols
α Heat transfer coefficient W/m²K
β Inclination angle rad
ε Porosity - ε Void fraction - ε Emissivity - η Efficiency - λ Thermal conductivity W/mK μ Dynamic viscosity kg/m/s φ Heat flux W/m² φ Phase rad ρ Density kg/m3 ρ Reflectivity - σ Surface tension N/m τ Shear stress Pa τ Transmissivity - χ Martinelli parameter - subscript abs absorbed amb ambient b base b back c, cond condenser cond conduction conv convection dyn dynamic e, evap evaporator f front ff face to face fric frictional fus fusion grav gravitational h homogeneous i internal i, int interface irr irreversible l, liq liquid m mean min minimum max maximum mom momentum opt optimal p pore
PCM phase change materiel
ref reference s solid Si silicon sat saturation tot total tp Two-phase v, vap vapour vo vapour only w wall ∆𝑃 pressure lines
1
Chapter 1: Introduction and context
1.1 Personal context
My first research experience was a 5-month internship performed in the CEA of Grenoble in 2005 in the Fuel Cell Laboratory. It gave me a preview of what can be research. I confirmed my interest the following year through my Master research project performed in the CETHIL from January to September 2006 on pulsating saturated two-phase flows, for instance encountered in pulsating heat pipes (PHP). I think this Master project was the trigger of the rest of my research. Heat pipes fascinated me as a way to get around the physical limitations of conductive heat transfer and the field of possibilities only seemed to be limited by imagination and manufacturing technologies. The specific case of PHP gave me an idea of the numerous scientific questions that still had to be answered. From this project, I also kept my “plumber” approach: I discovered that in experimental studies of saturated two-phase systems, the main problem is often the tightness of the experimental set-up, the rest being only a question of quality of result analyses.
I must admit I had a lot of chance: this “innocence” was permitted to me thanks to the very favourable environment in which I was inserted. The two-phase research group of the CETHIL gave me the opportunity to develop my research skills, during my research project but also during my PhD that followed. Under the day-to-day supervision of Frederic Lefèvre and the more global supervision of Jocelyn Bonjour, I studied the thermal and hydrodynamic performance of grooved flat heat pipes by means of a phenomenological approach, both experimentally and numerically. My PhD was also an opportunity to try to understand the national and international scientific community in which I am involved today.
I said luck… After my PhD, I had the chance to perform an 18-month postdoctoral project in the University of Pretoria, in South Africa, under the supervision of Josua Meyer. This amazing experience brought me a new vision of the research field, more based on the Anglo-Saxon way of thinking. It developed my autonomy and I learned the necessity to have a global overview of the scientific advances in a specific domain. I choose to study the convective condensation in inclined tubes, in order to broaden my research fields, while focusing on experimental approaches.
Luck always… I was at the right place at the right moment… and probably with the right persons around me. An assistant professor position opened in the two-phase flow research group at CETHIL in September 2011 and I had the chance to get the position. My carrier was then definitely linked with INSA Lyon, in which I did my studies, my PhD, and thus my current research since 7 years now… It can be a weakness; it can be strength… I think it is both of them. It anyway enabled me to be quickly associated to the research projects of the group and to the teaching team of the energetic department. I kept my strategy: broadening my research field on two-phase systems, in general, and developing my experimental skills. I tried to give a coherence to my research by focusing on the cooling of electronic components. A specific application indeed gives a frame to the research and enables to study various systems, from the heat pipe systems to the thermal dampers and two-phase flows without dispersing too much. Of course, it does not prevent me to study two-phase systems for other applications, but I rather see it as a way to open the researchers mind to new constraints and new industrial contexts than to try to become a “universal” expert of two-phase systems.
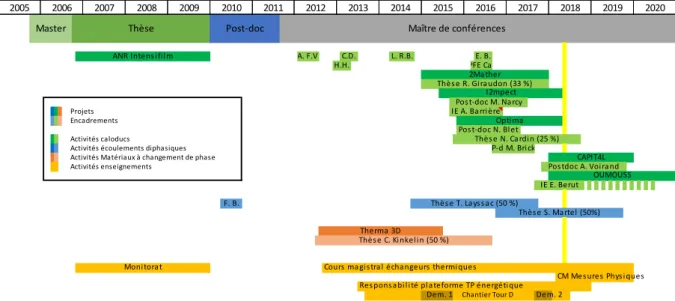
This strategy also enabled me to work with various people. I had the chance (once more) to co-supervise 5 PhD students, of which 3 have completed, with 4 different professors of HDR assistant professors of the group, namely Frederic Lefèvre, Valérie Sartre, Jocelyn Bonjour and Remi Revellin. This diversity of people, in terms of scientific approach, skills and human behaviour is very rich and I believe that it enabled me to reflect on my own approaches. Co-supervisors of other laboratories (MATEIS in INSA and SIMAP in Grenoble) also enabled me to broaden my point of view and to compensate a little bit my “INSA centred” environment. Of course, I did not perform my research alone, the results presented in the manuscript are the outcomes of the work of all the master students, PhD students, co-authors, technicians, engineers, and administrative staff I had the pleasure to work with. Figure 1-1 presents a simplified timeline of the various projects and supervision in which I have been involved. More details are available in the Curriculum Vitae provided at the end of the present document.
2
Figure 1-1. Simplified timeline of the various projects and supervisions in which I have been involved
1.2 Industrial and scientific challenges in the thermal management of electronic
components
Before presenting my research activities, it is useful to give a brief industrial context of the thermal management of electronic components. The industrial and scientific challenges are of course linked to the continuous increase of transistor performance (figure 1-2), coupled to the remarkable decrease of the size of the electronic components (figure 1-3), which leads to increasing heat fluxes, up to 100 to 200 W/cm² nowadays.
However, the cooling of electronic components cannot be viewed only through the heat flux that needs to be dissipated. The structure of these systems tends to become more and more complex and the trend is to try to achieve 3D electronic components in order to limit the length of the electrical connections between the various parts of the electronic systems (figure 1-4).
Figure 1-2. Evolution of the transistors number per chip and the clock speed of microprocessors (Waldrop,
2016)
Figure 1-3. Evolution of the size of the electronic component (Waldrop, 2016)
Figure 1-4. 3D electronic component (sources left: Fraunhofer IZM; centre: ITRS 2009; right: AES, Samsung)
Projets Encadrements Activités caloducs
Activités écoulements diphasiques Activités Matériaux à changement de phase Activités enseignements
Cours ma gi s tra l écha ngeurs thermi ques
CM Mes ures Phys i ques Res pons a bi l i té pl a teforme TP énergétique
Dem. 1 Chantier Tour D Dem. 2
CAPIT4L Pos tdoc A. Voi ra nd
2020 OUMOUSS I2mpect P-d M. Bri ck ANR Intens i fi l m H.H. A. F.V. 2015 Thès e C. Ki nkel i n (50 %) Maître de conférences 2016 2017 2018 2019 2010 2011 2012 2013 2014 Optima Pos t-doc M. Na rcy IE A. Ba rri ère Pos t-doc N. Bl et IE E. Berut 2005 2006 2007 2008 2009 Moni tora t Post-doc Thèse Master E. B. PFE Ca l 2Ma ther Therma 3D F. B. L. R.B. C.D. Thès e T. La ys s a c (50 %) Thès e R. Gi ra udon (33 %) Thès e N. Ca rdi n (25 %) Thès e S. Ma rtel (50%)
3
An example of advanced 3D structure is presented in figure 1-5: the memory is located directly on the microprocessor. This kind of architecture improves the system performance but increases the complexity of the system cooling, as the memory needs to be cooled through the microprocessor itself, which is often hotter. In the present example, thermal vias made of copper were added through the microprocessors layer. Even without adding phase-change heat transfer device, temperature prediction in this kind of structure is challenging (Monier-Vinard et al., 2016).
Together with the electrical connections, the thermal links between the various parts that need to be cooled and the heat sink is a major constraint of these systems. The maximum admissible temperature of the electronic components itself often depending on its structure and function (Figure 1-6), the thermal issues should be taken into account as early as possible in the design of the architecture of the electronic component and the complete system. However, it is unfortunately rarely the case today. More links are thus required between the electronic and the thermal scientific communities.
Figure 1-5. Example of 3D electronic component manufactured by ST-Ericsson / CEA (Vivet and Guérin, 2011)
Figure 1-6. Maximal admissible temperature on various location of a cell phone (Kinkelin, 2016)
Because of the important diversity of the electronic components sizes, constraints and heat fluxes, many cooling systems can be used for the thermal management. Many recent review articles are available in the literature on this topic, with specific reference to CFD modelling (Monier-Vinard et al., 2017), advanced cooling material (Qu et al., 2011; Tong, 2011), two-phase systems (Irissou et al., 2008; Saidur et al., 2011; Tadrist, 2007) or phase change materials (Ling et al., 2014). Other reviews are dedicated to specific applications, as automotive (Mallik et al., 2011), power battery (Rao and Wang, 2011) or military applications (Price, 2003). To have a global overview of the cooling technologies and their scientific challenges, the interested readers can refer to the very pertinent PhD thesis literature surveys of Lachassagne (2009), Hodot (2015) and Charnay (2014).
As a consequence, the goal is not to present here an exhaustive review of the work performed on the thermal management of the electronic components, but rather to draw a global overview of the various technologies that exist. Figure 1-6, which is strongly inspired by the literature survey cited above, gives a summary of these technologies. A distinction is made between three types of systems:
- The cooling system themselves, that can be directly considered as a heat sink, even if the heat will be eventually released with another system. Air cooling, liquid cooling and two-phase cooling systems can be implemented.
- The heat transfer systems that aims at transferring the heat from the electronic component to a distant heat sink. Contrarily to the previous type of systems, interactions can occur between the phenomena localised at the heat source and at the heat sink. Active systems and passive systems can be used for this purpose.
- The other thermal management systems whose goal is not to cool directly the electronic components, but rather to play on the thermal spreading and thermal damping phenomena.
1.3 Overview of my research work
Figure 1-6 highlights the richness of the scientific field linked to the thermal management of electronic components. Even if I try to maintain a general scientific culture of the various topics listed in this figure, for instance through international conferences and review articles, I am directly involved in only a very little number of scientific questions.
Etage mémoire Etage processeur Etage BGA Flux thermique Téléphone 45 °C Processeur : 125 °C Mémoire : 85 °C Boîtier (BGA) : 65 °C Plateforme (PCB) Puce
4
Figure 1-7. Various systems used for the thermal management of electronic components. In green, the systems which I had the opportunity to study. In blue, the systems I used commonly as an engineer tool
Amongst the various systems presented in figure 1-7, and beyond the systems highlighted in blue and corresponding to classical thermal management systems, I had the opportunity to work on three main types of systems, highlighted in green: the heat pipes, the two-phase flows and the thermal dampers using phase-change material.
In the present thesis, I will try to draw an overview of my research outcomes since my PhD defence in 2009. As many aspects of my research are discussed, I have tried not to enter too much into the details, except for specific scientific points. Each chapter corresponding to a different research field, I also tried to vary the philosophy of each of them. It may affect the uniformity of the present document, but the goal is rather that any concerned reader can find something interesting in it than to dedicate the whole document to a specific audience.
Chapter 2 is dedicated to the studies on heat pipes. In this field, my research consisted mainly in phenomenological analyses of various systems, in order to achieve a better understanding of their behaviour. I will firstly try to give the reader a short overview of the working principle, history and applications of these systems. The word “heat pipe” referring to multiples systems, a literature survey of the various type of studies available in the literature is then proposed. The scientific questions being numerous, I will not enter into the details but rather try to draw a global view of the scientific context and of the various approaches the scientific community uses to study these systems. With the same philosophy, I will then present my own approaches and outcomes on this field. A specific discussion on the link between thermal and materials sciences will close this chapter.
Chapter 3 is dedicated to my research work on phase flows. I am mainly interested in inclined two-phase flows with the idea of using this configuration to study the balance between the various forces involved in these systems. Contrary to Chapter 2, I will try to go a little bit deeper in the scientific questions linked to this domain. After a brief scientific context and the presentation of the test benches I have used to study inclined two-phase flows, some experimental results are presented and discussed in terms of flow patterns, heat transfer and pressure drops.
The last Chapter is a summary of the work on thermal dampers in which I was involved, mainly through the PhD thesis of Christophe Kinkelin. In this chapter, the idea is to present the complete analyses of this type of system, from the theoretical work consisting in defining and studying the notion of ideal thermal damper, to the characterisation of prototypes.
In each chapter, a brief literature review is presented. Perspectives are discussed at the end of each chapter, and are then summarised and prioritised in the global conclusion.
Air cooling Classical heat sinks Vortex generator Scroll heat sinks Ionic Wind Air Jet impingement Synthetic jets Liquid cooling Cold plates Compact heat exchangers Direct liquid cooling Liquid metal cooling system Two-phase cooling Spray cooling Two-phase microchannel cooling Immersion boiling cooling Vibration induced droplet atomisation Minipumped loop Active systems Vapor compression cycle Thermoelectric system Passive systems Conventional heat pipes Vapour chamber and flat heat pipes Pulsating heat pipe Loop heat pipes Thermal dampers Bulk material Phase change material Cooling technologies Heat transfer systems Other thermal management systems Conventionnal base plates Advanced base plates Conductive via Thermal spreaders Chemical storage
5
Chapter 2: Passive systems based on the liquid-vapour phase change:
Heat pipes and related devices
2.1 Working principle, history and applications
A heat pipe is a system able to transfer high heat fluxes from a heat source to a heat sink with a low thermal resistance using liquid-vapour phase-change. It consists of a cavity filled by a fluid at saturation. The liquid evaporates at the contact of the heat source and condenses close to the heat sink. The way the vapour and the liquid flow to the condenser and to the evaporator, respectively, depends on the type of heat pipe.
The main types of heat pipes are summarised in figure 2-1. A distinction can be made between conventional heat pipes, loop heat pipes and oscillating heat pipes. The family of conventional heat pipes comprises thermosiphons, cylindrical heat pipes, flat plate heat pipes and rotating heat pipes. The liquid and vapour flows are counter-current within the heat pipe body. The liquid flows from the condenser to the evaporator owing to either gravity, capillary, centrifugal forces or a combination of these forces. In capillary heat pipes, the capillary structure (grooves, meshes or porous medium) has to be continuous from the condenser to the evaporator.
Figure 2-1. Different heat pipe technologies (Lips, 2015)
co n d en se r q
h) Pulsating heat pipe (PHP)
vapor line condenser q liquid line
g) Capillary pumped loop
d) Rotating heat pipe
q condenser vapor liquid evaporator evaporator ev ap o ra to r capillary structure reservoir vapor channels Gravity assisted heat
pipes
Capillary heat pipes
Other heat pipes
e) Two-phase loop thermosyphon
condenser q g a) Thermosyphon evaporator condenser q g liquid vapo r evaporator
b) cylindrical heat pipe
condenser q liquid capillary structure vapo r evaporator
c) Flat plate heat pipe / vapor chamber
q condenser vap. liq. evaporator capillary structure
Conventional heat pipes Loop and pulsating heat pipes
vapor channels
condenser
q
f) Loop heat pipe
reservoir evaporator vapor line liquid line capillary structure
6
In figure 2-1, the generic term ‘loop heat pipes’ refers not only to loop heat pipes themselves (LHPs), but also capillary pumped loops (CPLs) and two-phase loop thermosiphons (also called closed-loop thermosiphons). In these systems, the liquid and vapour flows in separate lines. For LHPs and CPLs, the sum of frictional and gravitational pressure drops are compensated by the capillary forces in the capillary structure placed at the evaporator only. A CPL differs from a LHP by the place of the reservoir, which has a great importance on the overall system behaviour. In closed-loop thermosiphons, the gravitational forces compensate for the frictional pressure drop.
The oscillating heat pipes (figure 2-1h), also called pulsating heat pipes (PHPs) are made of a single meandering tube placed between the heat source and the heat sink. Its diameter, close to the fluid capillary length, leads to a distribution of the fluid within the tube into liquid plugs and vapour slugs. The violent vaporisation of multiple liquid slugs in the evaporator, associated to the condensation of multiple vapour plugs at the condenser, generates self-sustained oscillations of the fluid. It leads to an efficient heat transfer from the heat source to the heat sink, both by latent and sensible heat. These systems are cheap and easy to manufacture, but their behaviour is difficult to predict and they are currently sparsely used in the industry.
Despite the strong differences between the various heat pipe technologies, there are several phenomena shared by these systems. Obviously, liquid-vapour phase-change heat transfer is present in all heat pipes. The phase-change occurs at the scale of the capillary structure or at the scale of the thin liquid films present in the system. The capillary forces are indeed almost never negligible. Moreover, as the fluid is always heated through a wall, the interactions between the working fluid and the wall, mainly wetting effects, are of great importance. Lastly, there is always a coupling between hydrodynamic and thermal phenomena, as the working fluid follows a thermodynamic cycle in the systems.
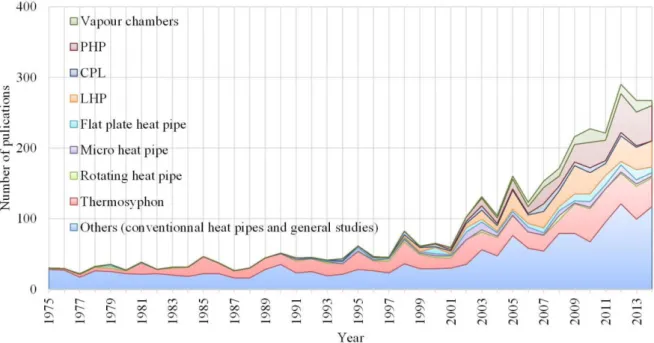
The similarity of the phenomena involved in all heat pipes induces that the progress in understanding of one kind of heat pipe generally helps to progress on the other kinds. Indeed, heat pipes are the topic of many research programs. Figure 2-2 presents the evolution of the number of articles related to heat pipes indexed on the Web of ScienceTM database between 1975 and 2014 (Lips, 2015).
The heat pipe science began during the sixties and conventional heat pipes were soon widely used in space applications, for instance to transfer the heat dissipated by the electronic components to the radiators. To try to reduce the weight of the systems, CPLs and LHPs were invented by the NASA during the sixties and by the Russian Federal Space Agency during the seventies, respectively. However, these technologies were not reliable enough during this period.
During the eighties, terrestrial applications of heat pipes were developed, mainly with thermosiphons because of the difficulty in overcoming the gravity forces. Thermosiphons have been widely used in industrial applications, as well as in the heat exchangers. The development of electric locomotives also motivated the use of heat pipes in mobile applications.
During the nineties, new types of heat pipes were invented and more and more studied. Micro heat pipes appeared, thanks to the progress in micro technologies. They aimed to reduce the thermal contact resistance between the electronic component and the heat sink by directly integrating the heat pipe into the silicon substrate of the electronic component. At the same time, the progresses in porous material technologies enabled the implementation of CPLs and LHPs in spacecrafts.
Since 2000, the number of papers dedicated to heat pipes has increased continuously and now stands at about 250 papers per year. According to Larsen and von Ins (2010), the general annual growth rate of scientific publications is close to 5%, which implies a doubling time of about 15 years. With a doubling time of about 8 years, the growth rate of publications dedicated to heat pipes is much higher than the growth rate of all scientific publications. This enhanced research effort is mainly motivated by the increase of the heat flux density dissipated by electronic components, which creates a need for efficient and reliable cooling systems. Heat pipes, especially CPLs and LHPs, are thus developed for terrestrial applications and the systems need to be optimised and perfectly understood in order to deal with gravitational forces and acceleration forces for on-board vehicle applications. At the same time, rising energy prices favour the use of heat pipes in numerous applications, either as a passive system to remove heat, to improve the efficiency of heat recovery systems, or to homogenise the temperature of various
7
systems. In parallel, the continuous progress in new materials and manufacturing processes enables the spreading of heat pipes in many other industrial applications.
In figure 2-2, one can note the important development of research on CPLs / LHPs over the last 15 years, and on PHPs over the last 10 years. Together, they represent currently one third of the papers devoted to heat pipes. The development of reliable LHP would open the use of heat pipes in many applications, as they enable to transfer heat over a longer distance than other types of heat pipes, while having a low sensitivity to gravitational and acceleration forces. The development of PHPs is mainly motivated by the low cost of these kinds of systems. One can also note the remaining importance of research on thermosiphons, despite the age of the early research on this field. These systems are more and more optimised and studies aim to push their operating limits, especially in terms of heat power, heat flux density and operating temperature.
Figure 2-2. Number of papers dedicated to heat pipes according to the database of Web of ScienceTM (Lips, 2015)
Since my Master thesis in 2006, I had the opportunity to work on several research projects linked to heat pipes. They led to several scientific papers in international journals and communications in international conferences. In the following of the present chapter, the goal is not to list every scientific studies and results, but rather to try to give an overview of the various research strategies I have used to improve the understanding of the phenomena involved in heat pipes. I will first give a brief overview the general approaches encountered in the heat pipe scientific community (section 2.2). I will then focus briefly on my research concerning heat pipe modelling and give some examples of specific experimental or theoretical studies in which I were involved in order to illustrates the various approaches and justify the need of research projects on heat pipes (section 2.3). Section 2.4 will be specifically dedicated to the links between the progress in material sciences and those in heat pipe sciences. Eventually, conclusions and perspectives on heat pipes sciences will be given in section 2.4.3.
2.2 General approach of the scientific community
This section is mainly drawn from of a keynote lecture, I had the opportunity to present at the HEFAT conference in 2015, and is devoted to the heat pipe studies presented in the literature between 2010 and 2015 (Lips, 2015). It has been completed with more recent studies. This brief summary will help to understand my own contributions to the community.
Scientific issues involved in heat pipes are usually classified in four categories: evaporation heat transfer, condensation heat transfer, flow patterns in heat pipes and capillary flows. In the present section, another classification of the studies available in the literature is proposed:
8
- The scientific issues linked to the working fluid behaviour,
- The studies aiming to predict the phase-change heat transfer in thin films, - The development of new heat pipe models.
This classification enables to highlight not only the different scientific issues but also the different scientific approaches that are used by the various research teams working on heat pipes.
2.2.1 Research motivated by heat pipe characterization
From an industrial point of view, an important outcome of heat pipe studies is the determination of the overall performance of the various heat pipes. The performance can be typically expressed in terms of system thermal resistance and of system capacity to operate in given operating conditions (imposed heat flux, ambient temperature, acceleration, orientation…). Many studies are thus devoted to the determination of the heat pipe performance and the numerous prototypes that are tested enable to build important databases for each type of heat pipes. The thermal resistance of a heat pipe usually depends on the heat transfer at the evaporator and at the condenser, and thus, on many parameters, such as the working fluid, the fluid fill charge and the effective thermal conductivity of the wick (when exists), but also on other phenomena as the operating regime, or the partial or total dry-out of the evaporator. For instance, the thermal performance of LHPs is often characterized by their operating curve (vapour or reservoir temperature as a function of the heat power) and not by their thermal resistance. Determining a heat pipe performance also leads to determine its operating limits, often detected by a sudden increase of the thermal resistance or of the operating temperature. If the different limits are well known from decades, it is not so trivial to link the observed heat pipe behaviour to a particular limit.
Many review articles on heat pipes are available in the literature. They are of a great interest as they enable to summarize the data scattered in a large number of articles. For instance, Maydanik et al. (2014) recently proposed a review on the performance of loop heat pipes with flat evaporators. The performance of the various geometries is compared, as well as the impact of the working fluid and the materials. Recommendations are then proposed in order to achieve a good performance when designing the evaporator of a LHP.
Other reviews are focused on specific applications instead of a specific type of heat pipe, as that of Srimuang and Amatachaya (2012), who proposed a review on heat pipe heat exchangers presented in the literature. It highlights the fact that the main design parameters strongly depend on the application in which the heat pipe is used and not only on the type of heat pipe itself.
Moreover, the performance of a heat pipe is not only limited to its thermal performance. For instance, Zhang et al. (2014) studied the socio-economic performance of a solar water heating system that includes a heat pump and a new type of two-phase loop thermosiphon. This example shows that reducing the heat pipe performance to its only thermal resistance minimizes the challenges that are to be faced by the heat pipe scientific community.
Besides academic papers, many patents are filed, in which specific geometries and configurations are proposed. Patents can deal with specific parts of heat pipe, as condensers (Fried et al., 2013) or wicks (Asfia et al., 2014). Additional parts are also proposed, as a reservoir filled with adsorbent material in order to deal with freezing problems (Bonjour et al., 2013). The large number of patents filed each year shows the strong links between the academic research on heat pipes and their industrial applications. In a general way, each time a new heat pipe design is proposed, the first step in studying a prototype is to determine its performance. As an example, Lachassagne et al. (2013, 2012) proposed a new kind of LHP, called CPLIP (Capillary Pumped Loop for Integrated Power), with a reservoir located above the evaporator. In their first paper they determined its performance, and subsequently proposed a model in steady-state conditions. Heat pipes also have to be tested in various operating conditions. For instance, Mameli et al. (2014) characterised a closed loop pulsating heat pipe in microgravity conditions. They showed that their heat pipe is more affected by the variation of the gravity than by the level of gravity itself. They also concluded that the performance of their heat pipe is similar in microgravity and when it is placed horizontally in normal gravity conditions. This kind of conclusion is important for the community to limit the number of tests required in microgravity, as they are expensive and difficult to perform.

![[PDF] TP sur la programmation Arduino avec correction | Cours PDF](data:image/gif;base64,R0lGODlhAQABAIAAAP///wAAACH5BAEAAAAALAAAAAABAAEAAAICRAEAOw==)