HAL Id: cea-01692842
https://hal-cea.archives-ouvertes.fr/cea-01692842
Submitted on 25 Jan 2018
HAL is a multi-disciplinary open access
archive for the deposit and dissemination of
sci-entific research documents, whether they are
pub-lished or not. The documents may come from
L’archive ouverte pluridisciplinaire HAL, est
destinée au dépôt et à la diffusion de documents
scientifiques de niveau recherche, publiés ou non,
émanant des établissements d’enseignement et de
Experimental demonstration of a synthetic aperture
compression scheme for multi-Petawatt high-energy
lasers
Jérôme Neauport, N. Blanchot, E Bar, G. Behar, C Bellet, D. Bigourd, F
Boubault, C. Chappuis, H. Coïc, C. Damiens-Dupont, et al.
To cite this version:
Jérôme Neauport, N. Blanchot, E Bar, G. Behar, C Bellet, et al.. Experimental demonstration of a
synthetic aperture compression scheme for multi-Petawatt high-energy lasers. Optics Express, Optical
Society of America - OSA Publishing, 2010, 18, pp.10088-10097. �cea-01692842�
Experimental demonstration of a synthetic
aperture compression scheme for multi-Petawatt
high-energy lasers
N. Blanchot*, E. Bar, G. Behar, C. Bellet, D. Bigourd, F. Boubault, C. Chappuis, H. Coïc, C. Damiens-Dupont, O. Flour, O. Hartmann, L. Hilsz, E. Hugonnot,
E. Lavastre, J. Luce, E. Mazataud, J. Neauport, S. Noailles, B. Remy, F. Sautarel, M. Sautet, and C. Rouyer
Commissariat à l’Énergie Atomique, Centre d’études scientifiques et techniques d’Aquitaine, BP 2, 33114 Le Barp, France
*nathalie.blanchot@cea.fr
Abstract: We present the experimental demonstration of a subaperture
compression scheme achieved in the PETAL (PETawatt Aquitaine Laser) facility. We evidence that by dividing the beam into small subapertures fitting the available grating size, the sub-beam can be individually compressed below 1 ps, synchronized below 50 fs and then coherently added thanks to a segmented mirror.
©2010 Optical Society of America
OCIS codes: (140.7090) Ultrafast lasers; (050.0050) Diffraction and gratings.
References and links
1. M. D. Perry, R. D. Boyd, J. A. Britten, D. Decker, B. W. Shore, C. Shannon, and E. Shults, “High-efficiency multilayer dielectric diffraction gratings,” Opt. Lett. 20(8), 940–942 (1995).
2. J. Néauport, E. Lavastre, G. Razé, G. Dupuy, N. Bonod, M. Balas, G. de Villele, J. Flamand, S. Kaladgew, and F. Desserouer, “Effect of electric field on laser induced damage threshold of multilayer dielectric gratings,” Opt. Express 15(19), 12508–12522 (2007), http://www.opticsexpress.org/abstract.cfm?URI=OPEX-15-19-12508. 3. J. Qiao, A. Kalb, M. J. Guardalben, G. King, D. Canning, and J. H. Kelly, “Large-aperture grating tiling by
interferometry for petawatt chirped-pulse-amplification systems,” Opt. Express 15(15), 9562–9574 (2007), http://www.opticsexpress.org/abstract.cfm?URI=OPEX-15-15-9562.
4. M. C. Rushford, J. A. Britten, C. P. Barty, T. Jitsuno, K. Kondo, N. Miyanaga, K. A. Tanaka, R. Kodama, and G. Xu, “Split-aperture laser pulse compressor design tolerant to alignment and line-density differences,” Opt. Lett. 33(16), 1902–1904 (2008).
5. N. Blanchot, G. Behar, T. Berthier, E. Bignon, F. Boubault, C. Chappuis, H. Coïc, C. Damiens Dupont, J. Ebrardt, Y. Gautheron, P. Gibert, O. Hartmann, E. Hugonnot, F. Laborde, D. Lebeaux, J. Luce, S. Montant, S. Noailles, J. Néauport, D. Raffestin, B. Remy, A. Roques, F. Sautarel, M. Sautet, C. Sauteret, and C. Rouyer, “Overview of PETAL, the multi-Petawatt project on the LIL facility,” Plasma Phys. Contr. Fusion 50(12), 124045–124054 (2008).
6. N. Blanchot, G. Marre, J. Néauport, E. Sibé, C. Rouyer, S. Montant, A. Cotel, C. Le Blanc, and C. Sauteret, “Synthetic aperture compression scheme for a multipetawatt high-energy laser,” Appl. Opt. 45(23), 6013–6021 (2006).
7. K. L. Baker, D. Homoelle, E. Utternback, E. A. Stappaerts, C. W. Siders, and C. P. J. Barty, “Interferometric adaptive optics testbed for laser pointing, wave-front control and phasing,” Opt. Express 17(19), 16696–16709 (2009), http://www.opticsexpress.org/abstract.cfm?URI=OPEX-17-19-16696.
8. J. Bunkenburg, T. J. Kessler, W. Skulski, and H. Huang, “Phase-locked control of tiled-grating assemblies for chirped-pulse-amplified lasers using a Mach-Zehnder interferometer,” Opt. Lett. 31(10), 1561–1563 (2006). 9. H. Habara, G. Xu, T. Jitsuno, R. Kodama, K. Suzuki, K. Sawai, C. Barty, T. Kawasaki, H. Kitamura, K. Kondo,
K. Mima, N. Miyanaga, Y. Nakata, H. Shiraga, K. Tanaka, K. Tsubakimoto, and M. Rushford, ““Pulse compression using segmented grating in Gekko MII system, ILE,” IFSA 2007, Fifth International Conference on Inertial Fusion Sciences and Applications,” J. Phys.: Conf. Ser. 112, 032017 (2008).
10. H. Huang, and T. Kessler, “Tiled-grating compressor with uncompensated dispersion for near-field-intensity smoothing,” Opt. Lett. 32(13), 1854–1856 (2007).
11. M. J. Guardalben, “Littrow angle method to remove alignment errors in grating pulse compressors,” Appl. Opt. 47(27), 4959–4964 (2008).
12. J. Crane, “Progress on converting a NIF Quad to eight Petawatt beams for Advanced Radiography,” IFSA 2009, Sixth International Conference on Inertial Fusion Sciences and Applications, 6 – 11 September 2009, San Francisco, Oral 2.4.3. (2009).
13. D. Meyerhofer, “Performances and Initial Experimental Results from the OMEGA-EP Laser System,” IFSA 2009, Sixth International Conference on Inertial Fusion Sciences and Applications, 6 – 11 September 2009, San Francisco, Oral 2.7.3. (2009).
14. S. Montant, G. Marre, N. Blanchot, C. Rouyer, L. Videau, and C. Sauteret, “3D numerical model for a focal plane view in case of mosaic grating compressor for high energy CPA chain,” Opt. Express 14(25), 12532–12545 (2006), http://www.opticsexpress.org/abstract.cfm?URI=OPEX-14-25-12532.
15. S. Mousset, C. Rouyer, G. Marre, N. Blanchot, S. Montant, and B. Wattellier, “Piston measurement by quadriwave lateral shearing interferometry,” Opt. Lett. 31(17), 2634–2636 (2006).
16. C. Grosset-Grange, J.-N. Barnier, C. Chappuis, and H. Cortey, “Design principle and first results obtained on the LMJ deformable mirror prototype,” Proc. SPIE 6584, (2007).
17. C. Dorrer, and I. A. Walmsley, “Simple linear technique for the measurement of space-time coupling in ultrashort optical pulses,” Opt. Lett. 27(21), 1947–1949 (2002).
18. C. Fiorini, C. Sauteret, C. Rouyer, N. Blanchot, S. Seznec, and A. Migus, “Temporal aberrations due to misalignments of a stretcher-compressor system and compensation,” IEEE J. Quantum Electron. 30(7), 1662– 1670 (1994).
19. E. Hugonnot, G. Deschaseaux, O. Hartmann, and H. Coïc, “Design of PETAL multipetawatt high-energy laser front end based on optical parametric chirped pulse amplification,” Appl. Opt. 46(33), 8181–8187 (2007).
1. Introduction
The generation of Ultra-High Intensity beam has significantly been improved by the progresses obtained in the field of femtosecond oscillators and Chirped Pulse Amplification technique combined with Optical Parametric Amplification (OPA). However, one of the main key issues remains in the compression stage. Classical high energy compression schemes are based on two parallel diffraction gratings used in single or double pass configuration. Final gratings in the compressor are exposed to the full beam energy in the ultra-short pulse regime (few kJ energy, ps pulse duration, 40 cm square beam size). For spectral bandwidth limited pulses of 3 nm, the optimal technology for the grating realization is the Multi Layer Dielectric (MLD) grating [1]. The MLD technology has reached damage fluence [2] of more than 4 J/cm2 at beam normal for an incidence angle of 77° for 500 fs pulse duration. The size available for these gratings does not exceed 1 meter. Then, to compress kilojoule of energy, the first solution proposed consists in a grating made of smaller coherently added gratings like for OMEGA-EP or FIREX [3,4]. For PETAL (PETawatt Aquitaine Laser) [5] we have proposed an alternative compression scheme [6]. Tiled gratings are brought into coherent addition by way of an auxiliary segmented mirror. Compressors tiling errors are corrected with adjustments of mirror array. A similar set-up was also retained for the NIF-ARC beamline [7].
The PETAL compressor scheme is based on coherent addition of beams instead of coherent addition of gratings. The initial beam is divided in sub-apertures which are independently compressed and synchronized with classical (micrometric range) precision. Finally, these sub-apertures are coherently added using only one segmented mirror with three interferometric displacements of each sub-aperture. To limit the volume of the vacuum compressor, the compression is achieved in two stages [Fig. 1(a)]. First, a compressor in air [Fig. 1(b)] reduces the pulse duration from a few nanoseconds to a few hundred picoseconds in a double pass configuration (or equivalent). The relatively long pulse duration allows using 1 meter monolithic gratings by decreasing the grating incident angle. A compressor under vacuum [Fig. 1(d)] finalizes the pulse compression down to 1 ps duration. The second compression stage is designed for a small compression factor to limit transverse chromatism in single pass configuration. This allows us to consider this compressor as four independent units, each one addressing one sub-aperture. Each independent compressor could even have different characteristics such as groove density or incident angle. Finally, a segmented mirror [Fig. 1(c)] placed between the two compression stages compensates for the spatial phase shift induced by the separation of the gratings in the final compressor. The characteristics of the first compressor are a groove density of 1680 g/mm, an incidence of 56° and a grating distance of 2.62 m. The characteristics of the second compressor are a groove density of 1780 g/mm, an incidence of 77.2° and a grating distance of 2 m.
Fig. 1. (a) Top view of the compression scheme with two stages. Bottom view: (b) PETAL compression for the first phase of the project with the first stage in air. (c) The segmented mirror. (d) The second stage with two independent gratings of the independent compressors.
In this paper, we detail the experiments we carried out to prove the feasibility of such a sub-aperture compression scheme. After detailing the challenges of a sub-aperture compressor with associated diagnostics and components, experimental results are presented. They deal with compression performances, synchronization of sub-apertures and beam phasing achievement.
2. Challenges of the sub-aperture compression scheme
2.1 Specificitions for the PETAL scheme
The main principle of the synthetic aperture compression scheme is already described in [6]. The entire scheme is based on the fact that the second stage is equivalent to independent compressors and not to mosaic gratings. The entire beam phasing (interferometric displacement) is achieved with a segmented mirror outside the vacuum chamber. The principle of using only one component to compensate mosaic misalignments was first demonstrated in [8]. As in the PETAL scheme, this hypothesis is valid in the case of no-energy coupling between neighbor gratings, tiled-grating assemblies are then not necessary.
The independent compressors are aligned with classical methods and the main issue involves the thermal stability. The position of the segmented mirror outside the vacuum chamber limits the thermal variation caused by motors. Moreover, the grating displacements for the first grating alignment process [9] are only used during the mounting or in case of maintenance.
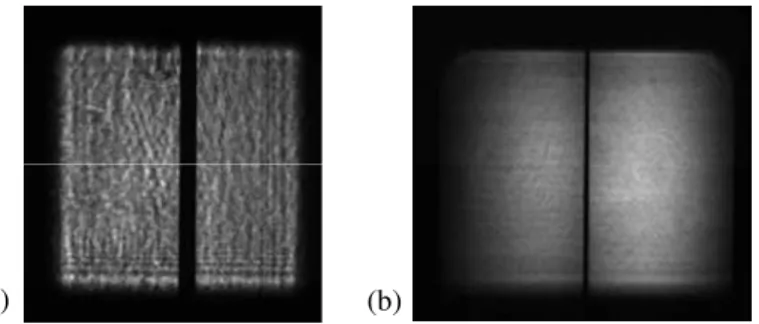
The single pass configuration of the second compression stage is design with a small grating distance to limit the effect of transverse chromatism which induces an inhomogeneous wave on target. However, this grating distance is long enough to realize a spatial beam smoothing in the direction of spectral dispersion [Fig. 2(b)] [10], compared to monochromatic beam [Fig. 2(a)].
(b) (a)
Fig. 2. Near-field profile of the output beam from the compressor. (a) for a monochromatic pulse, (b) for a 16 nm spectral bandwidth. Beam smoothing is observed (b) in the horizontal direction corresponding to the diffraction direction.
To optimize the alignment process, a specific design has been developed for the mechanical support of the gratings. The groove rotation is mounted on a goniometric structure (2 tilts) to align the axis to the vertical position (+/− 10 µrad Peak-to-Valley, absolute measurement). The gratings are positioned on the motorized rotation with two independent tilts: one for the groove tilt, one for the face tilt. Then, to take advantage of this, the incident beam is first aligned in a horizontal plane using a theodolite system. After, due to the relative small dimensions of the gratings and the spatial shift between gratings [6], the autocollimations at null incidence and at Littrow are easily realized, first with a monochromatic beam and then with the oscillator pulses (16 nm) [11].
The longitudinal spatial shifts between the gratings of the independent compressors [6] avoid spectral coupling between gratings. In this scheme, the beam shaping (band gap without energy to avoid spectral coupling) is limited compared to mosaic gratings [12,13]. This beam shaping is only made to limit energy on the edge of the components.
2.2 Alignment process
Alignment of such a system is done in three steps with increasing precision ranges: a few hundred micrometers for the compressed pulse duration, a few micrometers for synchronization, and an interferometric range for beam phasing.
At first, the sub-aperture beam pulses are independently compressed. The choice of the groove densities, incident angles, and grating distances depends on different constraints: limitation of the vacuum compressor size, efficiency of the multi-dielectric gratings, and compensation of the 2nd and 3rd orders of the spectral phase [6]. The residual spectral phase shift has been theoretically limited by adapting stretcher and compressors designs. The compression is finally experimentally adjusted with the grating distances of the second stage using a second harmonic autocorrelator.
In a second step, the relative grating distance of each independent compressor is adjusted in order to synchronize the sub-aperture pulses and to reach relative delays smaller than a tenth of the pulse duration, typically 50 fs. This corresponds to a differential optical path of 16 micrometers. To preserve the compressed pulse, the grating distance modification cannot exceed a few hundred micrometers. In case of large modifications, the incidence angle on the concerned independent compressor has to be readjusted. The delay measurement is critical to obtain synchronization. We developed a specific diagnostic: a 2D-Spectral Interferometer (2D-SI) [5]. With a 1D-spectral-interferometer, the temporal resolution is close to the compressed pulse duration, and typically reaches 800 fs for a spectral bandwidth of 8 nm. To decrease the resolution delay down to the specification of 50 fs, the unexploited second dimension of the interference pattern along the spectrograph input slit direction is used. Fringes parallel to the spectral direction are generated by creating an air wedge between sub-apertures. In case of perfect synchronization, horizontal fringes are observed. If a delay exists between the beams, modulation contributions appear in the spectral direction, rotating the horizontal fringes.
The third step in the interferometric range consists of the coherent addition of sub-apertures [14,8]. A segmented mirror implemented in air corrects the tilt, tip and piston of the different sub-aperture phase fronts. This mirror consists of four segments addressing the four independent compressors. Each segment, thanks to 3 piezoelectric actuators associated with 3 closed loop control capacitive sensors, conserves the alignment positions based on laser diagnostic measurements. The beam phasing is measured with a quadrilateral wavefront interferometer SID4 from Phasics Company [15] and checked by a focal spot diagnostic. Daily alignments (beam phasing) are insured by the segmented mirror with laser diagnostics before and during shot.
2.3 Segmented mirror
In the PETAL compression scheme, all the interferometric displacements are reported on a unique component: the segmented mirror [Fig. 1(c)]. This component is located between the two compression stages in air. The four segments are mirrors deposited on silica substrates and are maintained in an Invar mount, with three elastic fixation points on the top and bottom edges. The displacements are realized with piezoactuators. The spaces between segments are limited to 1 +/− 0.1 mm. The beam energy at the edge of the segments, and on the second stage gratings is limited by a spatial beam shaping at the front end.
The segmented mirror mounting and reference alignment are achieved by two diagnostics. A mechanical plane with a mechanical probe adjusts segment piston (less than 1 µm) in a first step. Then, the segments are simultaneously observed using a flat wavefront reference and a wavefront analyzer to adjust the tilts. This experimental set-up is used to realize the deformable mirror of the LIL and LMJ facilities [16]. The wave front distortions are estimated to 0.03 µm (RMS) and 0.17 µm (PV). The maximum displacements available for each segment are: a piston of +/− 10 µm, a tilt in the X-direction of +/− 40 µrad, and a tilt in the Y-direction of +/− 200 µrad. The precision is 50 nm in piston, and 1 µrad for the tilts. The stability in position is ensured by a closed loop control of the piezoactuators using capacitive sensors.
2.4 2D-Spectral Interferometer (2D-SI)
The synchronization is achieved with the 2D-SI, using oscillator pulses of 16 nm bandwidth. This 2D-SI uses a biprismatic plate with a tilt of 1.75 mrad, a cylindrical lens for the one direction focusing along the slit axis, and a spectrograph with a 0.05 nm spectral resolution. The temporal delay between the sub-apertures is visually deduced and precisely adjusted by analyses of the interference pattern using a 1D-Fourier transform along the slit axis. Moreover, a visual 2D-SI pattern observation allows qualifying and quantifying the differential spectral phase shift: delay, chirp, temporal distortion, and also residual dispersion [17]. The residual differential chirp is illustrated in Fig. 3(c), and the groove rotation in the grating plane in Fig. 4(c). This diagnostic is adapted for 2 subapertures. For the final phase of PETAL with 4 sub-apertures, a specific mechanical shutter will be developed to measure the synchronization of two subapertures at a time.
In presence of a residual chirp [Fig. 3(a)] in one of the independent compressors, the extreme spectral components arrive before and after the central wavelength. A curvature of the fringes is then observed [Fig. 3(b)]: the central fringes are horizontal and the extreme fringes have opposite slopes. A shift of 1 fringe corresponds to a phase shift of ∆φ = 2 π. The phase shift is directly linked to the differential second order phase term T2 by [18]:
² 2 2
ω
φ
= ∆ ∆ T , with ∆λ λ π = ω ∆ ² c 2 0, where c is the velocity of light, λ0 the central wavelength,
and ∆λ the spectral bandwidth.
The analysis of the fringes in Fig. 3(c) gives a residual differential second order chirp T2of 3 104 fs2. This second order term can be compensated by changing the incident angle (∆i) and/or the grating distance (∆L) of only one independent compressor. The expression for
second order chirp is:
α
π
λ
² cos ² ² 2 3 0 2 L N cT = , where N the groove density, L the grating distance, and α the diffracted angle. The modification of the differential second order term is given by:
(
)
− ∆ + ∆ + = ∆ α α α π λ ² cos ² cos ² 2 ² 3 0 2 L L L c N T with α ∆ − = α ∆ cos i cosi . Experimentally, a variation of the
incident angle of 0.59 mrad and of the grating distance of 3.6 mm reduce the residual chirp to less than 104 fs2, leading to horizontal fringes [Fig. 3(d)] having slight curvature at the edge of the aperture.
Fig. 3. 2D-Spectral Interferometry in presence of residual differential chirp. (a) The pulse profiles are plotted. (b) Theoretical fringe profiles. (c) Experimental pattern with a residual chirp. (d) Experimental pattern after compensation of the differential chirp.
Now, in the case of a groove rotation ϕ (in the grating plane) (see Fig. 4), a residual dispersion in the Y-direction is generated. This means that the pulse front is different for each wavelength [Fig. 4(a)]. Then the space between fringes ∆if depends on the wavelength and fan
shaped fringes are observed [Fig. 4(b) and 4(c)]. The change in the dispersion angle for each wavelength is given by ∆αy =Nϕ∆λ and deduced from the fringe shape shown in Fig. 3(b).
The groove inclination is deduced from the variation of the fringe number ∆Nfringes by the
relation: D Nfringes y λ α =∆
∆ with D the beam diameter. We observe a variation of 2.4 fringes on the diagnostic pattern. For a beam size of 170 mm, the change in the dispersion angle is ∆αy =
14.7 µrad. This dispersion angle corresponds to a groove inclination of 560 µrad for a bandwidth of 14.7 nm. The precise Fourier analysis of the fringes gives an inclination of 660 µrad.
Fig. 4. (a) Pulse front of 2 beams without and with spectrally dependent tilt. 2D-Spectral Interferometry results: (b) theory and (c) experiments.
2.5 Quadrilateral wavefront interferometer SID4
A quadrilateral wavefront interferometer SID4 measures the beam phasing after the second compression stage and simultaneously the far-field spot is measured. We have developed with
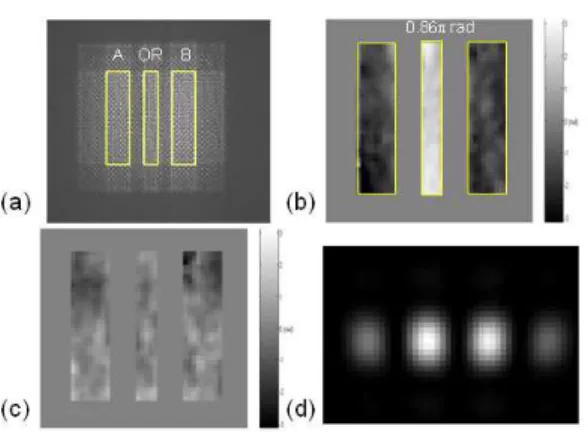
the Phasics Company an extension of the original SID4 to measure the differential phase between segmented beams. Figure 5(a) illustrates the interference pattern of a 4-wave replica of 2 sub-apertures, respectively A and B. Each sub-aperture wavefront is deduced from this interference pattern with the same reference using the overlapping region (OR). This diagnostic was tested to compare measurements with a single beam to measurements with two sub-apertures. We estimate a phase front error of less than 15 nm RMS. Figure 5(b), Fig. 5(c) and Fig. 5d show the algorithm we have developed to extract the gradients of the phase along the X direction [Fig. 5(b)], the Y direction [Fig. 5(c)], and the reconstructed focal spot [Fig. 5(d)]. The reconstructed focal spot is calculated with the near field measured with the SID4, with a factor two reduction of the sub-aperture width, the height is conserved. More, for this simulation, the near-field intensity where the wave-front is not defined has been put to zero. The piston between the sub-apertures is given by the OR region of Fig. 5(b). A piston of 0.86 π is measured leading to multi-spots for the far field [Fig. 5(d)].
Fig. 5. (a) SID4 interferogram. ‘A’ first subaperture, ‘B’ second subaperture, ‘OR’ overlapping region. (b) Gradients of the phase in X direction. (c) Gradients of the phase in Y direction. (d) Reconstructed focal spot.
3. Experimental demonstrations
3.1 Compression
Previous compression measurements were made at the front end output to control the spectral phase of the Öffner stretcher and of the OPCPA process [19]. The pulse duration was measured to be 400 fs, close to the Fourier-limited value (380 fs). In the first step of the PETAL project, only half of the final compressor is installed as shown on Fig. 6(a). The front end beam is expanded to a dimension of 170 x 170 mm2. This beam size covers two
independent compressors with 45 cm width gratings in the second compression stage. The first stage uses 83 cm gratings in a double pass configuration. The compressors are aligned with classical techniques and the far-field is observed with a large spectral bandwidth, allowing control of the grating parallelism. The pulse durations are adjusted with the grating distances of each independent compressor. The autocorrelation measurements [Fig. 6(c)] were limited due to the near-field beam quality [Fig. 6(b)] used during this campaign. The first autocorrelation profiles are plotted in Fig. 6(d). The pulse durations at full width at half maximum (FWHM) are 650 fs and 870 fs respectively. The spectral bandwidth was 2.7 nm and the compression durations were not optimized.
650 fs 870 fs
(b) (c) (d)
First compression stage in air : 2 monolithic gratings in double pass
Segmented mirror: 4 segments
Second compression stage in vacuum: 2 independent compressors (a)
650 fs 870 fs
(b) (c) (d)
First compression stage in air : 2 monolithic gratings in double pass
Segmented mirror: 4 segments
Second compression stage in vacuum: 2 independent compressors (a)
Fig. 6. (a) Experimental set-up for the first phase of the PETAL project with a double pass compressor and two independent compressors. Bottom view: (b) Near-field beam. (c) Associated autocorrelation traces. (d) Autocorrelation profiles of the two sub-apertures with pulse width values at half maximum of 650 fs for the 1st segment (continuous line) and of 870 fs for the 2nd segment (dotted line)
3.2 Synchronization
After compression, the synchronization is achieved with the 2D-SI, using oscillator pulses of 16 nm bandwidth. To perfectly adjust the synchronization, the delay versus the grating distance is estimated. The grating displacement is made along the beam propagation between the gratings. So a displacement of ∆L gives a delay
[
1 cos(i )]
c L
T=∆ + −α where i is the incident angle and α the diffracted angle. Figure 7 presents the comparison between 3 2D-SI measurements [Fig. 7(a)] and the equivalent displacements made on the grating distance [Fig. 7(b)]. Having achieved quite good agreement between theory and measurement, the required specification of less than 50 fs has been satisfied.
Fig. 7. a) Synchronization measurement made with the 2D-SI for different grating distances. b) Dots are the delays measured with the 2D-SI. The line represents the theoretical delay from the grating displacement.
3.3 Beam phasing
The focal spot measurements are presented in Fig. 8(c) as well as the corresponding near field [Fig. 8(a)], and phase shift. A Fourier transform of the near field profile gives the far field profile [Fig. 8(b)] and is compared to the experimental focal spot profile [Fig. 8(d)]. A good agreement is obtained for the maximum intensity I. When one sub-aperture is focused independently, a non-circular focal spot, due to its rectangular shape of 85 x 170 mm2, is
observed.
Fig. 8. (b) The calculated far field profiles are compared to the (c) direct focal spot measurements and (d) corresponding profiles. The calculated far fields are obtained by a 1D Fourier transform of (a) an experimental near field profile. The maximum intensities are compared to the ideal case for which the sub-apertures are in phase with a maximum intensity of I.
3.5 Stability
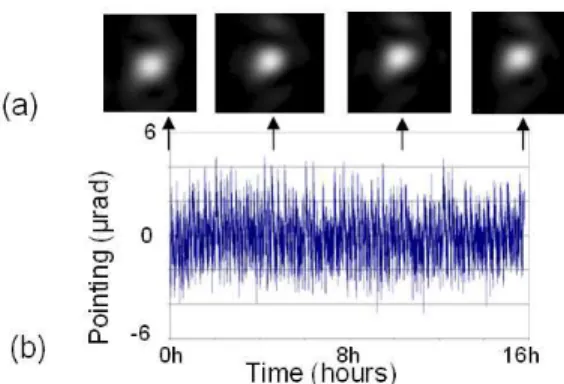
To ensure the stability of the PETAL compression stages, 16-hour measurements were recorded [Fig. 9]. Only one control-loop iteration was used for each segment of the segmented mirror. The far field [Fig. 9(a)] was observed on the compression diagnostic table at the compressor output. The compressor vessel was in air atmosphere but all the cryogenic pumping system was operating. The pointing stability [Fig. 9(b)] was of +/− 1.3 µrad (RMS) with a peak value of +/− 4 µrad, corresponding to +/− 5.3 µm (RMS) on target for the PETAL configuration with a focal length of 4 m. Concerning the beam phasing, the focal spot was well preserved,indicating that the stability of all the mechanical structures is well adapted to the sub-aperture compression scheme. This was achieved without beam closed-loop control of beam phasing.
Fig. 9. 16-hour measurements of pointing (X-direction) stability (b), and the associated focal spot (a).
4. Conclusion
We have experimentally demonstrated the feasibility of using a sub-aperture compression scheme for high energy Petawatt lasers. All the interferometric displacements are reported on a segmented mirror outside the vacuum chamber. The precision for each segment is a tilt of 1 µrad and a piston of 50 nm. This compression scheme requires specific diagnostics including a 2D-spectral interferometer for sub-aperture synchronization of 50 fs and an interferometer for beam phasing.
Acknowledgments
This work is supported by the Conseil Régional d’Aquitaine, the French Ministry of Research and of the European Union, and is performed under the auspices of the “Institut Lasers et Plasmas” (ILP). Special thanks to the LIL teams for their help in the implementation of the PETAL compression stage in the LIL facility.