HAL Id: hal-02264598
https://hal.inria.fr/hal-02264598
Submitted on 7 Aug 2019
HAL is a multi-disciplinary open access
archive for the deposit and dissemination of
sci-entific research documents, whether they are
pub-lished or not. The documents may come from
teaching and research institutions in France or
abroad, or from public or private research centers.
L’archive ouverte pluridisciplinaire HAL, est
destinée au dépôt et à la diffusion de documents
scientifiques de niveau recherche, publiés ou non,
émanant des établissements d’enseignement et de
recherche français ou étrangers, des laboratoires
publics ou privés.
EXAD: A System for Explainable Anomaly Detection
on Big Data Traces
Fei Song, Arnaud Stiegler, Yanlei Diao, Jesse Read, Albert Bifet
To cite this version:
Fei Song, Arnaud Stiegler, Yanlei Diao, Jesse Read, Albert Bifet. EXAD: A System for Explainable
Anomaly Detection on Big Data Traces. ICDMW 2018 - IEEE International Conference on Data
Mining Workshops, Nov 2018, Singapore, Singapore. �hal-02264598�
EXAD
: A System for Explainable Anomaly
Detection on Big Data Traces
Fei Song
Inria, France Ecole Polytechnique, France
Paris, France [email protected]
Arnaud Stiegler
Ecole Polytechnique, France Paris, France
Yanlei Diao
Ecole Polytechnique, France University of Massachusetts Amherst
Paris, France
Jesse Read
Ecole Polytechnique, France Paris, France
Albert Bifet
LTCI, T´el´ecom ParisTech Paris, France
Abstract—Big Data systems are producing huge amounts of data in real-time. Finding anomalies in these systems is becoming increasingly important, since it can help to reduce the number of failures, and improve the mean time of recovery. In this work, we present EXAD, a new prototype system for explainable anomaly detection, in particular for detecting and explaining anomalies in time-series data obtained from traces of Apache Spark jobs. Apache Spark has become the most popular software tool for processing Big Data. The new system contains the most well-known approaches to anomaly detection, and a novel generator of artificial traces, that can help the user to understand the different performances of the different methodologies. In this demo, we will show how this new framework works, and how users can benefit of detecting anomalies in an efficient and fast way when dealing with traces of jobs of Big Data systems.
Index Terms—anomaly detection, machine learning, Spark
I. INTRODUCTION
Big Data systems in real-time are becoming the core of the next generation of Business Intelligence (BI) systems. These systems are collecting high-volume event streams from various sources such as financial data feeds, news feeds, application monitors, and system monitors. The ability of a data stream system to automatically detect anomalous events from raw data streams is of paramount importance.
Apache Spark is a unified analytics engine for large-scale data processing, that has become the most used data processing tool running in the Hadoop ecosystem. Apache Spark provides an easy to use interface for programming entire clusters with implicit data parallelism and fault tolerance.
In this work, we consider anomalies in traces of Apache Spark jobs. These anomalies are patterns in time-series data that deviate from expected behaviors [1]. An anomaly can be detected by an automatic procedure, for which the state-of-the-art includes statistical, SVM, and clustering based tech-niques [1]–[3].
However, there is one key component missing in all these techniques: finding the best explanation for the anomalies detected, or more precisely, a human-readable formula offering
useful information about what has led to the anomaly. The state-of-art methods mainly focus on detecting anomalies, but not providing useful information about what led to the anomaly. Without a good explanation, anomaly detection is only of limited use: the end user knows that something anoma-lous has just happened, but has limited or no understanding of how it has arisen, how to react to the situation, and how to avoid it in the future. Most data stream systems cannot generate explanations automatically, even if the anomaly has been signaled. Relying on the human expert to analyze the situation and find out explanations is tedious and time con-suming, sometimes even not possible. Even as a human expert, the engineer cannot come up with an explanation immediately. The main contribution of this paper is EXAD (EXplainable Anomaly Detection System), a new integrated system for anomaly detection and explanation discovery, in particular for traces of Apache Spark jobs.
This demo paper is structured as follows. We describe the design of anomalies of traces of Spark jobs in Section II. In Section III we present the design of our new system EXAD, and we outline the demonstration plan in Section IV. Finally, in Section V we give our conclusions.
II. ANOMALYDESIGN
Because of the very nature of stream processing and the resorting to large clusters, failures are both real challenges and very common events for stream processing. A rule of thumb for Spark Streaming monitoring is that the Spark application must be stable, meaning that the amount of data received must be equal to or lower than the amount of data the cluster can actually handle. When it is not the case, the application becomes unstable and starts building up scheduling delay (which is the delay between the time when a task is scheduled and the time when it actually starts). With tools such as Graphite or even the Spark Web UI, it is quite simple to monitor a spark application and specially to make sure that the scheduling delay does not build up.
Live Monitoring
Running batches of1 second for 3 minutes 5 seconds since 2018/07/11 12:33:48 (186 completed batches, 7048 records)
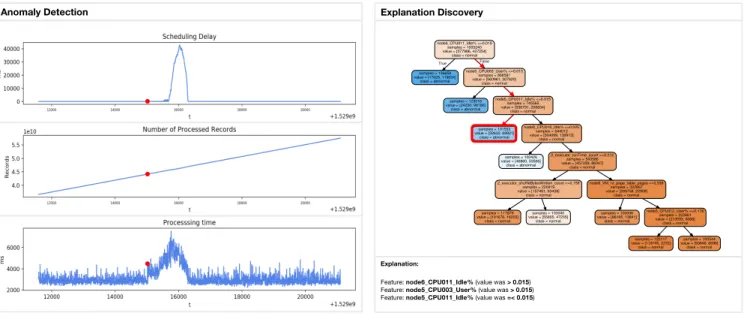
Anomaly Detection
Explanation:
Feature: node6_CPU011_Idle% (value was > 0.015)
Feature: node5_CPU003_User% (value was > 0.015)
Feature: node5_CPU011_Idle% (value was =< 0.015)
Explanation Discovery node6_CPU011_Idle% <=0.015 samples = 1005240 value = [577986, 427254] class = normal samples = 136659 value = [17025, 119634] class = abnormal True node5_CPU003_User% <=0.015 samples = 868581 value = [560961, 307620] class = normal False samples = 123016 value = [24230, 98786] class = abnormal node5_CPU011_Idle% <=0.015 samples = 745565 value = [536731, 208834] class = normal samples = 101553 value = [32632, 68921] class = abnormal node8_CPU018_Idle% <=0.025 samples = 644012 value = [504099, 139913] class = normal samples = 100426 value = [46860, 53566] class = abnormal 2_executor_runTime_count <=0.212 samples = 543586 value = [457239, 86347] class = normal 2_executor_shuffleBytesWritten_count <=0.158 samples = 220919 value = [157481, 63438] class = normal node8_VM_nr_page_table_pages <=0.539 samples = 322667 value = [299758, 22909] class = normal samples = 117879 value = [101676, 16203] class = normal samples = 103040 value = [55805, 47235] class = normal samples = 100006 value = [86165, 13841] class = normal node5_CPU012_User% <=0.176 samples = 222661 value = [213593, 9068] class = normal samples = 122117 value = [119745, 2372] class = normal samples = 100544 value = [93848, 6696] class = normal
Fig. 1. Graphical User Interface of EXAD, the new integrated system for anomaly detection and explanation discovery
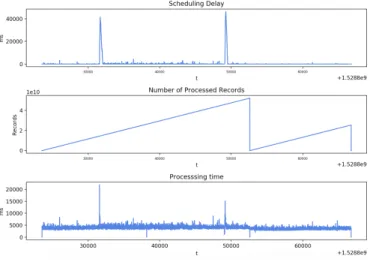
However, detecting anomalies in Spark traces is much more complex than just tracking the scheduling delay on each application. First of all, it is not a reliable indicator for a failure: for maximizing the use of the resources, users tend to scale down as much as possible the resources used by one application. As a consequence, having some scheduling delay from time to time is common practice and does not necessarily mean that a failure occurred (see on Figure 2). Moreover, the scheduling delay is only a consequence of a failure that can have occurred a while ago hence detecting the failure before the application actually generates substantial scheduling delay can provide the user some time to react.
For generating our synthetic data, we used a four-node cluster that was run with Yarn. We created a concurrent envi-ronment by running 5 jobs simultaneously on the cluster. The metrics are coming from the default Spark Metrics monitoring tool and we used a set of ten different spark workloads, with and without injected failures to constitute our dataset.
When designing the failures, we targeted the anomalies that had particular characteristics: the failure must have a significant impact on the application and must create some anomaly in the traces. Moreover, the failure must not lead to an instant crash of the application (otherwise, it is pointless to try to detect it). Finally, we must be able to precisely track the failure (start and end time) to produce some precise labeling of the data.
We designed three different types of failures, targeting
Fig. 2. Normal Trace
different levels of the application:
• Node failure: this is a very common failure specially on large clusters, and it is mostly caused either by hardware faults or maintenance. All the instances (driver and/or executors) located on that node will be unreachable. As a result, the master will restart them on another node, causing delay on the processing. On Figure 3, there are three distinct anomalies happening in the application: the first two instances are executor failures (hence the
peak in both scheduling delay and processing time) while the drop in the number of processed records indicates a driver failure (hence the reset of the number of processed records).
• Data source failure: for every application, the user expects a certain data input rate and scales the application resources accordingly. However, two scenarios need to be detected as soon as possible. If the input rate is null (meaning that no data is actually processed by Spark), it indicates a failure of the data source (Kafka or HDFS for instance) and a waste of resource on the cluster. On the contrary, if the input rate is way higher than what the application was scaled for, the receivers memory starts filling up because the application can’t process data as fast as it receives it. It can eventually lead to a crash of the application.
• CPU contention failure: clusters are usually run with a resource manager that allocate resources to each applica-tion so that each of them have exclusive access to their own resources. However, the resource manager does not prevent external programs from using the resources that it allocated previously. For instance, it is not uncommon to have a Hadoop datanode using a high amount of cpu on a node used by Spark. This generates a competition for resources between the applications and the external program which affect dramatically the throughput of the applications.
Fig. 3. Spark application with multiple failures
III. SYSTEMDESIGN
A. System Architecture
Our system implements a two-pass approach to support anomaly detection and explanation discovery in the same stream analytics system. Though closely related, anomaly de-tection and explanation discovery often differ in the optimiza-tion objective. Therefore, our two-pass approach is designed to handle anomaly detection and explanation discovery in two different passes of the data, as shown Figure 4.
Fig. 4. An integrated system for anomaly detection and explanation
discovery
In the forward pass, the live data streams are used to drive anomaly detection, and at the same time archived for further analysis. The detected anomalies will be delivered immediately to the user and the explanation discovery module. Then in the backward pass, explanation discovery runs on both the archived streams and feature sets created in the forward pass. Once the explanation is found, it is delivered to the user, with only a slight delay.
Anomaly detection in real-world applications raises two key issues. 1) Feature space: The vast amount of raw data collected from network logs, system traces, application traces, etc. does not always present a sufficient feature set, which are expected to be carefully-crafted features at an appropriate semantic level for anomaly detection algorithms to work. This issue bears similarity with other domains such as image search, where the raw pixels of images present information at a semantic level too low and with too much noise for effective object recognition. 2) Modeling Complexity: The labeled anomalies are often rare (in some cases non-existent), which indicates the need of unsupervised learning or semi-supervised learning. The effective model for anomaly detection may exhibit very complex (non-linear) relationship with the features, which in-dicates that the detection algorithms must have good expressive power. The generalization ability is also critical to anomaly detection since the task is often to detect anomalies that have never happened before. To address both issues, we seek to explore Deep Learning as a framework that addresses feature engineering and anomaly detection in the same architecture.
To respond to the two challenges, we explore Deep Learn-ing [4] as a new framework that addresses feature engineerLearn-ing and anomaly detection in the same mechanism. Deep Learning (DL) is a successful approach to processing natural signals, and has been applied to various applications with best known results achieved [4] due to its ability to learn more complex structures and offer stronger expressive power. In addition, deep learning produces a layered representation of features that can be used in both anomaly detection and subsequent explanation discovery.
As we discussed before, the logical formulas representing explanations can be divided into different categories. For the simple class (conjunctive queries), the explanations do not aim to include complex temporal relationships, and hence
the dataset can be viewed as time-independent. In this case, the auto-encoder method may be a candidate for anomaly detection, while other more advanced methods may be added later. For a broader class where the explanations include temporal relationships, LSTM is more appropriate for anomaly detection because it inherently models temporal information.
Unsupervised anomaly detection normally follow a general scheme of modeling the available (presumably normal) data and considering any points that do not fit this model well as outliers. Many static (i.e., in non-temporally-dependent data) outlier detection methods can be employed, simply by running a sliding window (which removes the temporal dependence) of instances. For a window of size w, each pseudo-instance has dw features. It can be remarked that due to the possibility of unlabeled outliers existing in the training set, methods should be robust to noise.
B. Methods for anomaly detection
Here we review the main approaches to anomaly detection. Simple statistical methods. Many simple statistic methods are appropriate for outlier detection, for example, measuring how many standard deviations a test point lies from its mean. Some approaches are surveyed in, e.g., [5]. Such methods, however, are not straightforward to apply on multi-dimensional data and often rely on assumptions of Gaussianity.
Density-based methods. Density-based methods, such as k-nearest neighbors based detection (kNN) and local-outlier-factor model (LOF) [6] assume that normal data will form dense neighborhoods in feature space, and anomalous points will be relatively distant from such neighborhoods. As non-parametric methods, they rely on having an internal buffer of instances (presumably normal ones) to which to compare a query point under some distance metric. LOF uses a reacha-bility distance to compute a local outlier factor score, whereas kNN is typically employed with Euclidean distance.
These kind of methods are generally easy to deploy and update, but they are sensitive to the data dimensions: Time complexity is O(nd) for each query (given n buffered in-stances each of dimension d), i.e., O(n2d) for n instances.
Isolation forest. In a decision tree, it is possible to consider path length (from root to leaf) as proportional to the probability of an instance being normal. Therefore, instances falling through short paths may be flagged as anomalies. When this effect is averaged over many trees – it is known as an isolation forest [7].
Auto-encoder. A deep auto-encoder aims to learn an ar-tificial neural structure such that the input data can be re-constructed via this structure [8], [9]. In addition, the hidden layer (of the narrowest width in the structure) can be used as a short representation (or essence) of input. It has been applied to anomaly detection, though often with a focus on image data [10]. There is also pioneering work to use Neural Networks for network anomaly detection. For example, in [11] the authors used a device called Replicator Neural Network (a concept similar to Auto-Encoder) to detect anomalous network behaviors, in a time even before the current wave of DL
activities. The underlying assumption justifying using an auto-encoder for anomaly detection is that the model will be formed by normal data if not labeled, we assume that abnormal data should be rare; if labeled, we can leverage supervised learning to fine tune the auto-encoder. Consequently, what it will learn is the mechanism for reconstructing data generated by the normal pattern. Hence, the data corresponding to the abnormal behavior should have a higher reconstruction error. In our work we applied auto-encoders in the Spark cluster monitoring task. Moreover, this deep auto-encoder extracts a short representation of the original data, which can be used as an extended feature set for explanation discovery in the backward pass.
Long Short-Term Memory. The second method uses Long Short-Term Memory (LSTM) [12]. It is an improved variant of RNNs (Recurrent neural networks), which overcomes the vanishing/exploding gradient difficulty of standard RNNs. It has the ability to process arbitrary sequences of input, and has been used recently to detect anomalies in time series. For example, in [13], the authors applied semi-supervised anomaly detection techniques. They first train a LSTM network of normal behaviors, then apply this network to new instances and obtain their likelihood with respect to the network. The anomaly detection is based on a pre-determined threshold. In this work, the measure used is the Euclidean distance between ground truth and prediction. Alternatively, in [14] the authors assumed that the error vectors follow a multivariate Gaussian distribution. In our work, we are adapting two methods to make them applicable in our setting.
Our initial results from cluster monitoring reveal that the LSTM outperforms the auto-encoder, in F-score and recall, for anomaly detection. Some possible explanations for why the LSTM outperforms the auto-encoder are: First, the LSTM has been provided with temporal information. To the contrary, the auto-encoder may need to extract extra information by itself (for example, the relative phase in a complete sequence that has a consistent signal). This often requires more training data and more complex structures. Second, our hypothesis that the anomalies injected are not associated with temporal infor-mation might not be true. Future research questions include: 1) Tuning architectures and cost functions: In current work, we only use standard architectures and cost functions for the neutral network architectures. It is worth investigating the best architecture and the customized cost function that can improve the detection accuracy for both methods. 2) Tradeoffs: We will further investigate for which workloads they provide better results for anomaly detection. Sometimes even if the intended explanation is a conjunctive query, LSTM still outperforms antoencoder for anomaly detection, which requires further understanding. 3) Incremental training: Most DL algorithms are designed for offline processing. However, in a stream environment, new data is arriving all the time and needs to be included in the training dataset. Ideally we need a mechanism to leverage the new data in a timely manner, but incremental training for DL methods is known to be hard. In ongoing work, we are exploring an ensemble method, i.e., to build a
0.0 0.2 0.4 0.6 0.8 1.0 Recall 0.0 0.2 0.4 0.6 0.8 1.0 Precision
Anomaly detection methods, their PRC and AUPRC
kNN : 0.76 LOF : 0.54
Fig. 5. The precision/recall curve (PRC) illustrates the tradeoff typical of anomaly detection: the detection rate on anomalies (precision; vertical axis) versus the total number of anomalies detected (recall; horizontal axis). A baseline classier (predicting either all anomalies, or all normal) will obtain performance relative to the class imbalance, shown as a dashed line (at 5% anomaly rate, in this example on synthetic data). More area under the PRC (AUPRC) indicates better performance; to a maximum of 1.
set of ”weak” detectors on the new data, and then to perform anomaly detection using the combined result. Another idea is to randomly initialize the weights of the last layer and retrain with all data – it is a tradeoff between breaking local optima and reducing training cost.
To make these methods adapting to dynamic environments: Most deep learning algorithms are designed for offline pro-cessing, especially for image propro-cessing, hence not good for dynamic environments. Network/system anomaly detection often requires the ability to handle a dynamically changing environment where concept drifts are possible. To deal with this, we are exploring a design that can make DL approaches more applicable to the anomaly detection in live streams. In an ongoing work we propose to separate the network architecture into two parts: feature extraction and prediction. The feature extraction part exhibit stable behavior (feature should be a stable concept) hence should be trained offline mostly; the prediction part is more sensitive to the dynamic changing en-vironment, hence better use online training. Also this division will reduce the cost for (online) training significantly which is a key factor to make online training applicable in DL approach. C. Performance Evaluation
Evaluation in anomaly detection is focused on the tradeoff between detecting anomalies and false alarms; on data which is typically very imbalanced. Setting a threshold for detection de-fines the tradeoff. By varying such a threshold we can obtain a precision-recall curve, and the area under this curve (AUPRC) is a good evaluation metric in this case, as exemplified in Fig III-C, since it evaluates the method’s general performance without a need to calibrate a particular threshold value.
However, in real-world systems, detection plays only part of the role. In most applications, interpretation of the anomaly,
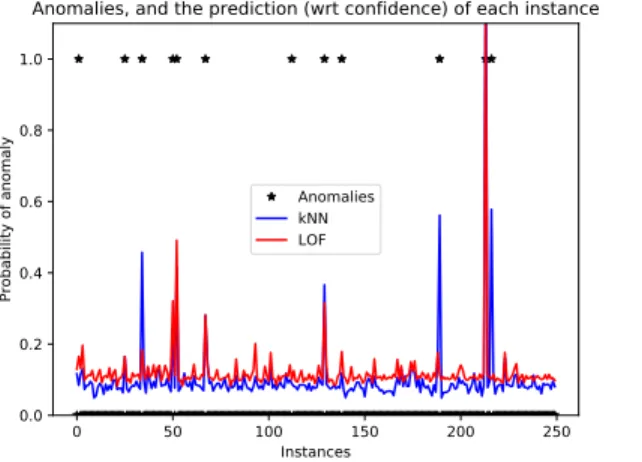
0 50 100 150 200 250 Instances 0.0 0.2 0.4 0.6 0.8 1.0 Probability of anomaly
Anomalies, and the prediction (wrt confidence) of each instance
Anomalies kNN LOF
Fig. 6. Prediction of anormality (synthetic data). Note the importance of
thresholding: neither method can be certain of any normal example, and not all methods (e.g., LOF) provide predictions bounded between 0 and 1.
i.e., explanation discovery, as explained in the following section.
D. Explanation discovery
It is of paramount importance that the human user can understand the ”root cause” behind an anomaly hehavior. After all, it is human user who make decision and prevent anomalies from happening. Hence the transformation of knowledge re-garding the anomalies to a human understandable form is the key in making anomaly detection fully useful. However, this component is often missing in the anomaly detection work.
Quite often, a good anomaly detection procedure is not good for generating human understandable explanation. For example, most machine learning based anomaly detection methods work as a black box by involving very complex, non-linear functions which are hard for human to understand. Also, thousands of parameters will participate in the anomaly detection work which is impossible for human user to learn knowledge from it.
We impose two special requirements for being a good expla-nation besides the detection power. They are: 1). simplification in term of quantity: we want to restrict the number of features involved. 2). simplification of the formality: the explanation should be easy to be interpreted by human user.
The simplest form we can imagine, is an atomic predicate of the form (v o c) (v is a feature, c is a constant, and o is one of five operators {>, ≥, =, ≤, <}). For each predicate of this form, one can build a measurement representing its separation power (the predicate can be viewed as a special binary classifier). For example, an entropy based reward function learned from the training data set based on their distinguishing power between the normal and abnormal cases [15]. However, due to the combinatorial explosion, it is not possible for us to use similar methodology in calculating this measurement for more complex combination of the atomic predicates.
In this work, we have tried two different ways to solve this problem. The first one is to build a conjunction of the atomic
predicates, and use it as the explanation. Such a simplified situation is indeed a submodular optimization problem. We use greedy algorithm to find an approximated solution. Greedy is a good and practical algorithm for solving monotonic submodular optimization problem. However, in our case, the problem is non-monotonic, which means there is no guarantee of the performance of a simple greedy algorithm.
The second method we implemented is from the work of [15], where we build the entropy based reward function for atomic predicates as before. The form of the explanation we are seeking is a Conjunctive Normal Form (CNF), and the way we construct this CNF is to use heuristic-based method. By searching through the achieved data set, we get some additional information which will guide the construction.
There is yet another method that we implemented which is learning based. It is inspired by a recent work [16]. We customize their approach to construct an anomaly detection model which can be translated directly into a logical formula. In our implementation, we restrict the explanation as a Dis-junctive Normal Form (DNF). First, we construct a neural network model as the anomaly detection device, then we approximate this neural network by a decision tree. In this case, the explanation can be formed by the paths leading to the leaves labeled as anomalies. Further, we impose a penalty term which try to minimize the number of attributes involved in the explanation (paths). For instance, we are able to produce an explanation for the anomaly seen in the GUI (see Figure 1): from a Spark point of view, there is no scheduling delay so a Spark user would probably not have seen the problem until the scheduling delay appears (minutes later), and the cause would have been hard to spot since the only visible shift is the processing time. Using our decision tree, we can easily identify the cause: the path indicates that the cpu consumption on node 5 is abnormally high (idle% is below 1.5%) and therefore indicates some cpu contention on this node.
Our demo system shows in the explanation discovery phase: 1) The root cause corresponds to the anomalous behavior. This is given by human experts. Also highlight some features in the data to give an explanation to these anomalies, this can be served as ground truth for human user.
2) Given a data set includes a time period labeled as anomalies, show the explanation constructed by different algorithms. Here we do not have rigorous measurement, some intuitive ones are: whether the features related to root cause have been included in the explanation, how complicated of the explanation, etc.
3) Use the explanation discovered as anomaly detection, run on a new test data set, show the detection accuracy (recall and precision, maybe detection phase as well).
IV. DEMONSTRATIONPLAN
In the demonstration, we will show the performance of our system in anomaly detection and in explanation discovery. We organize the demonstration by different type of anomalies. In the anomaly detection demonstration, we focus on the anomaly
detection accuracy and the ability to detect anomalies as early as possible, which means we have two measurement. In the explanation discover, we first show the ”root cause” given by human expert, then show the explanations discovered by different methods. Finally, we give another verification by running the explanation as the anomaly detection on the new test data.
V. CONCLUSIONS
We have built EXAD, a framework for anomaly detection, in particular for detecting anomalies from traces of Apache Spark jobs. In this framework we have gathered the most well-known approaches to anomaly detection. In particular, we have considered methods that can be easily adapted to a streaming environment – which is natural to live tasks such as job management. Our framework shows promise for studies and practical deployments involving anomaly detection and explanation.
ACKNOWLEDGEMENTS
This project has received funding from the European Re-search Council (ERC) under the European Union’s Horizon 2020 research and innovation programme (grant agreement n725561). Fei Song’s research was supported by an INRIA postdoc fellowship grant.
REFERENCES
[1] V. Chandola, A. Banerjee, and V. Kumar, “Anomaly detection: A survey,” ACM Comput. Surv., vol. 41, no. 3, pp. 15:1–15:58, 2009.
[2] M. H. Bhuyan, D. K. Bhattacharyya, and J. K. Kalita, “Network anomaly detection: Methods, systems and tools,” IEEE Communications Surveys and Tutorials, vol. 16, no. 1, pp. 303–336, 2014.
[3] M. Gupta, J. Gao, C. C. Aggarwal, and J. Han, “Outlier detection for temporal data: A survey,” IEEE Trans. Knowl. Data Eng., vol. 26, no. 9, pp. 2250–2267, 2014.
[4] Y. LeCun, Y. Bengio, and G. E. Hinton, “Deep learning,” Nature, vol. 521, no. 7553, pp. 436–444, 2015.
[5] V. Chandola, A. Banerjee, and V. Kumar, “Anomaly detection: A survey,” ACM Comput. Surv., vol. 41, pp. 15:1–15:58, July 2009.
[6] M. M. Breunig, H.-P. Kriegel, R. T. Ng, and J. Sander, “Lof: Identifying density-based local outliers,” SIGMOD, pp. 93–104, 2000.
[7] F. T. Liu, K. M. Ting, and Z.-H. Zhou, “Isolation-based anomaly detection,” ACM Trans. Knowl. Discov. Data, vol. 6, pp. 3:1–3:39, Mar. 2012.
[8] Y. Bengio, “Learning deep architectures for AI,” Foundations and Trends in Machine Learning, vol. 2, no. 1, pp. 1–127, 2009.
[9] G. Hinton and R. Salakhutdinov, “Reducing the dimensionality of data with neural networks,” Science, vol. 313, no. 5786, pp. 504 – 507, 2006. [10] D. Wulsin, J. A. Blanco, R. Mani, and B. Litt, “Semi-supervised anomaly detection for EEG waveforms using deep belief nets,” ICMLA, pp. 436– 441, 2010.
[11] S. Hawkins, H. He, G. J. Williams, and R. A. Baxter, “Outlier detection using replicator neural networks,” DaWaK, pp. 170–180, 2002. [12] S. Hochreiter and J. Schmidhuber, “Long short-term memory,” Neural
Computation, vol. 9, no. 8, pp. 1735–1780, 1997.
[13] P. Malhotra, L. Vig, G. Shroff, and P. Agarwal, “Long short term memory networks for anomaly detection in time series,” ESANN, pp. 89– 94, 04 2015.
[14] L. Bontemps, V. L. Cao, J. McDermott, and N. Le-Khac, “Collective anomaly detection based on long short term memory recurrent neural network,” CoRR, vol. abs/1703.09752, 2017.
[15] H. Zhang, Y. Diao, and A. Meliou, “Exstream: Explaining anomalies in event stream monitoring,” EDBT, pp. 156–167, 2017.
[16] M. Wu, M. C. Hughes, S. Parbhoo, M. Zazzi, V. Roth, and F. Doshi-Velez, “Beyond sparsity: Tree regularization of deep models for inter-pretability,” AAAI, 2018.