Appendix D
SIGN CONVENTION OF EXTENSOMETERS
Table of Contents
1. Introduction ... 1
2. Figure 1 sign convention ... 5
3. Consistent gap closing, negative sign convention ... 7
4. Conclusion ... 9
List of Figures Figure 1 Extensometer Sign Convention, from Phase 1A report, Vol. IV of X Validation of Ice Force Measurement, Gulf Canada... 1
Figure 2 North and south face movements with respect to the Deck on March 25... 2
Figure 3 Movement of the Deck with respect to the well casing ... 2
Figure 4 Time series plot of all 8 extensometers measuring movement of the Caisson with respect to the Deck ... 3
Figure 5 Time series plot of all 4 extensometers measuring movement of the Caisson faces with respect to the Deck ... 4
Figure 6 Time series plot of all 4 extensometers measuring movement of the Caisson corners with respect to the Deck... 4
Figure 7 Time series plot of 2 extensometers measuring movement of the Deck with respect to the Guide Pipe... 5
1. INTRODUCTION
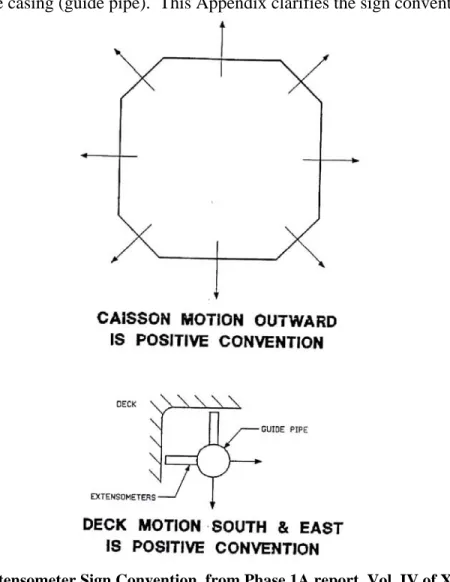
There was some uncertainty in the sign conventions for relative movements of the deck with respect to the casing (guide pipe). This Appendix clarifies the sign convention.
Figure 1 Extensometer Sign Convention, from Phase 1A report, Vol. IV of X Validation of Ice Force Measurement, Gulf Canada
The top part of Figure 1 indicates that when the gap between the caisson and deck increases (outward movement of the caisson with respect to the deck), the extensometer output increases. By looking at loading events it is possible to verify this sign convention. It is observed that loading on the outer caisson face results in the gap closing and a
decreasing output from the extensometer on the loaded face. On March 25 in the morning there was loading on the north face. Such loading should cause the output of the north face extensometer to decrease as load increases. Figure 2 plots north face load and north and south face extensometer output (face movement wrt deck). The extensometer output decreases, conforming to the sign convention in the top part of Figure 1. Note also that the gap from the south extensometer also closes, which supports the notion of “ovaling” of the caisson.
2 The lower part of Figure 1 indicates that Deck motion to the south (gap closing) should produce a positive or increasing output from the Guide Pipe extensometer. Referring toFigure 4, the output of EXT 736 GP N-S decreases, which implies the width of the gap in increasing. It would be expected that the gap between the Guide Pipe and the Deck would close with increasing load. It is hard to imagine a mechanism by which the deck would move to the north with respect to the Guide Pipe with loading on the north face.
0 20 40 60 80 100 120 08:24:00 08:38:24 08:52:48 09:07:12 09:21:36 09:36:00 09:50:24 Time Nor th Face M edo f Loa d (M N ) -16 -14 -12 -10 -8 -6 -4 -2 0 N & S Ext e ns ometers (mm) N Face MEDOF (MN) EXT 731 N (mm) EXT 735 S (mm)
Figure 2 North and south face movements with respect to the Deck on March 25
0 20 40 60 80 100 120 08:24:00 08:38:24 08:52:48 09:07:12 09:21:36 09:36:00 09:50:24 Time N o rt h Fa c e M e dof L oad ( M N ) -24 -23.5 -23 -22.5 -22 -21.5 -21 -20.5 GP (N -S ) Ex te ns o m et er ( mm) N Face MEDOF (MN) EXT 765 GP N-S (mm)
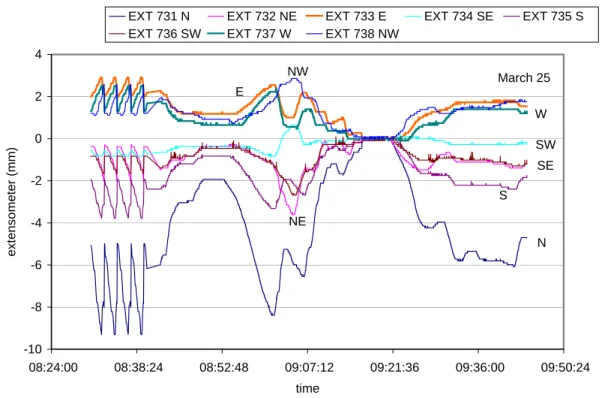
Additional time series plots, Figures 4 - 7 are prepared, zeroing traces to 09:21. March 25 -10 -8 -6 -4 -2 0 2 4 08:24:00 08:38:24 08:52:48 09:07:12 09:21:36 09:36:00 09:50:24 time ex tensom e te r ( m m )
EXT 731 N EXT 732 NE EXT 733 E EXT 734 SE EXT 735 S
EXT 736 SW EXT 737 W EXT 738 NW
N S NE NW E W SE SW
Figure 4 Time series plot of all 8 extensometers measuring movement of the Caisson with respect to the Deck
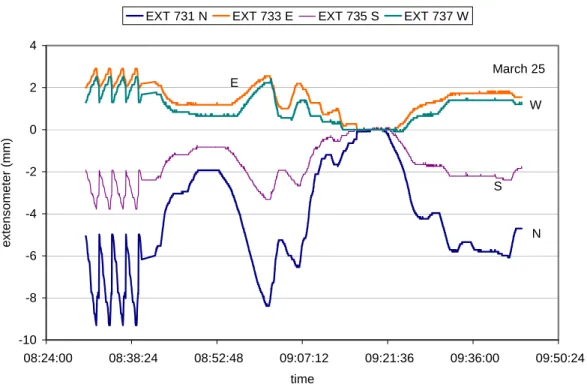
4 March 25 -10 -8 -6 -4 -2 0 2 4 08:24:00 08:38:24 08:52:48 09:07:12 09:21:36 09:36:00 09:50:24 time ex tensom e te r ( m m )
EXT 731 N EXT 733 E EXT 735 S EXT 737 W
N S E
W
Figure 5 Time series plot of all 4 extensometers measuring movement of the Caisson faces with respect to the Deck
March 25 -4 -3 -2 -1 0 1 2 3 4 08:24:00 08:38:24 08:52:48 09:07:12 09:21:36 09:36:00 09:50:24 time ex tensom e te r ( m m )
EXT 732 NE EXT 734 SE EXT 736 SW EXT 738 NW
NE
NW
SE SW
Figure 6 Time series plot of all 4 extensometers measuring movement of the Caisson corners with respect to the Deck
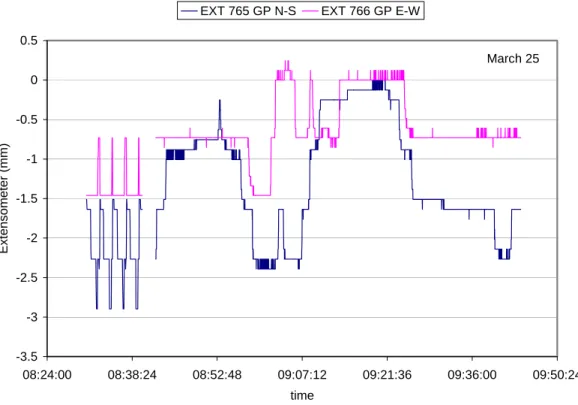
March 25 -3.5 -3 -2.5 -2 -1.5 -1 -0.5 0 0.5 08:24:00 08:38:24 08:52:48 09:07:12 09:21:36 09:36:00 09:50:24 time Ext e nsom eter ( m m )
EXT 765 GP N-S EXT 766 GP E-W
Figure 7 Time series plot of 2 extensometers measuring movement of the Deck with respect to the Guide Pipe
2. FIGURE 1 SIGN CONVENTION
Concentrating on the extensometer measured changes between 9:20 and 9:42 (where load increased from 0 to about 70? MN) the following movements were picked off:
location change of extensometer reading
from 9:20 to 9:42 sign convention of Figure 1 N -6.0 NE -1.4 E 1.7 SE -0.3 S -2.4 SW -1.3 W 1.4 NW 1.7
caisson-deck gap closing -ve
GP-NS -2.2 GP-EW -0.6
deck motion to South and East (deck-casing gap closing) +ve
These motions of caisson and deck following Figure 1 sign convention are plotted on the following sketch to make them easier to visualize.
6 Using the above measurements and the Figure 1 sign convention, the following net
movements of the caisson are determined. The sign convention for net motions are North positive and East positive. Note it is assumed the Deck does not deform.
location net caisson motions following Figure 1 sign convention N -3.8 mm NE E 1.1 SE S 4.6 SW W -2.0 NW GP-NS -2.2 GP-EW -0.6
Putting the above table into words:
Deck moves away (northward) from Guide Pipe -2.2 mm Net movement of North Caisson southward (6.0 – 2.2)= 3.8 mm
South Caisson moves northward? to reduce gap with Deck -2.4 mm
Deck moves away (northward) from Guide Pipe -2.2 mm
Net movement of South Caisson northward (2.4 + 2.2 )= 4.6 mm Å
East Caisson moves eastward to increase gap with Deck 1.7 mm
Deck moves away (westward) from Guide Pipe -0.6 mm Net movement of East Caisson eastward (1.7 – 0.6)= 1.1 mm
West Caisson moves westward to increase gap with Deck - 1.4 mm
Deck moves away (westward) from Guide Pipe -0.6 mm Net movement of West Caisson westward (1.4 + 0.6 )= 2.0 mm
It seems unreasonable that the South Caisson face would move 4.6 m northwards while the North Caisson face would move southwards by 3.8 mm with an ice force being applied on the north face.
3. CONSISTENT GAP CLOSING, NEGATIVE SIGN CONVENTION
location change ofextensometer reading from 9:20 to 9:42
sign convention of gap closing producing a decrease in extensometer
reading N -6.0 NE -1.4 E 1.7 SE -0.3 S -2.4 SW -1.3 W 1.4 NW 1.7
Caisson - deck gap closing -ve
GP-NS -2.2
8
Figure 8 Consistent gap closing: negative sign convention
Using the above measurements and the consistent gap closing –ve sign convention, the following net movements of the caisson are determined. As before the sign convention for net motions are North positive and East positive.
location net caisson motions consistent gap closing
-ve sign convention
N -8.2 mm NE E 2.3 SE S 0.2 SW W -0.8 NW GP-NS 2.2 GP-EW 0.6
Putting the above table into words:
North Caisson moves southward to reduce gap with Deck -6.0 mm
Deck moves towards (southward) Guide Pipe -2.2 mm Net movement of North Caisson southward (6.0 + 2.2)= 8.2 mm Å
South Caisson moves northward? to reduce gap with Deck -2.4 mm
Deck moves towards (southward) Guide Pipe -2.2 mm Net movement of South Caisson northward (2.4 – 2.2 )= 0.2 mm
East Caisson moves eastward to increase gap with Deck 1.7 mm
Deck moves towards (eastward) Guide Pipe -0.6 mm Net movement of East Caisson eastward (1.7 + 0.6)= 2.3 mm
West Caisson moves westward to increase gap with Deck - 1.4 mm
Deck moves towards (eastward) Guide Pipe -0.6 mm Net movement of West Caisson westward (1.4 – 0.6 )= 0.8 mm
4. CONCLUSION
The sign convention of a gap closing leading to a reducing output from the extensometers results in reasonable movements of the caisson faces under ice force action and is also a consistent sign convention. It applies to both north-south movements and east-west movements.