HAL Id: tel-03190474
https://hal.archives-ouvertes.fr/tel-03190474
Submitted on 6 Apr 2021
HAL is a multi-disciplinary open access
archive for the deposit and dissemination of sci-entific research documents, whether they are pub-lished or not. The documents may come from teaching and research institutions in France or abroad, or from public or private research centers.
L’archive ouverte pluridisciplinaire HAL, est destinée au dépôt et à la diffusion de documents scientifiques de niveau recherche, publiés ou non, émanant des établissements d’enseignement et de recherche français ou étrangers, des laboratoires publics ou privés.
for IP and mobile networks
Agathe Blaise
To cite this version:
Agathe Blaise. Novel anomaly detection and classification algorithms for IP and mobile networks. Networking and Internet Architecture [cs.NI]. Sorbonne Université, 2020. English. �tel-03190474�
THÈSE DE DOCTORAT DE SORBONNE UNIVERSITÉ
Spécialité Informatique
École doctorale Informatique, Télécommunications et Électronique de Paris Laboratoire d’informatique de Paris VI
Présentée par
Agathe BLAISE
Pour obtenir le grade deDOCTEUR de SORBONNE UNIVERSITE
Sujet de la thèse :
Novel anomaly detection and classification algorithms for IP and
mobile networks
soutenue le 14/12/2020 devant le jury composé de :
Marco Fiore, IMDEA Networks Rapporteur
Razvan Stanica, INSA Lyon, Inria Rapporteur
Clémence Magnien, CNRS, Sorbonne Université Examinateur
Sahar Hoteit, Univ. Paris Saclay, Centrale-Supélec Examinateur
Aline Carneiro Viana, Inria Saclay Examinateur
Thi-Mai-Trang Nguyen, LIP6, Sorbonne Université Membre invité
Sandra Scott-Hayward, Queen University Belfast Membre invité
Stefano Secci, Conservatoire National des Arts et Métiers Directeur de thèse
Vania Conan, Thales Co-encadrant
THÈSE DE DOCTORAT DE SORBONNE UNIVERSITÉ
Spécialité Informatique
École doctorale Informatique, Télécommunications et Électronique de Paris Laboratoire d’informatique de Paris VI
Présentée par
Agathe BLAISE
Pour obtenir le grade deDOCTEUR de SORBONNE UNIVERSITE
Sujet de la thèse :
Nouveaux algorithmes de détection d’anomalies et de
classification pour les réseaux IP et mobile
soutenue le 14/12/2020 devant le jury composé de :
Marco Fiore, IMDEA Networks Rapporteur
Razvan Stanica, INSA Lyon, Inria Rapporteur
Clémence Magnien, CNRS, Sorbonne Université Examinateur
Sahar Hoteit, Univ. Paris Saclay, Centrale-Supélec Examinateur
Aline Carneiro Viana, Inria Saclay Examinateur
Thi-Mai-Trang Nguyen, LIP6, Sorbonne Université Membre invité
Sandra Scott-Hayward, Queen University Belfast Membre invité
Stefano Secci, Conservatoire National des Arts et Métiers Directeur de thèse
Vania Conan, Thales Co-encadrant
Contents
1 Introduction 11
1.1 Context and motivation . . . 11
1.2 Statistical and ML techniques . . . 12
1.3 Data analysis applications to networking . . . 13
1.4 Contributions and thesis outline . . . 14
2 Related work 17 2.1 Statistical and machine learning techniques . . . 17
2.1.1 Statistical learning . . . 17
2.1.2 ML techniques: paradigms and addressed problems . . . 18
2.1.3 Data collection . . . 20
2.1.4 Feature design . . . 21
2.1.5 Performance metrics and model validation . . . 22
2.2 Intrusion detection . . . 23
2.2.1 Intrusion detection methodologies . . . 23
2.2.2 Large-scale intrusion detection . . . 24
2.2.3 Application to botnet detection . . . 25
2.3 Botnet Detection . . . 26
2.3.1 Flow-based techniques . . . 26
2.3.2 Graph-based techniques . . . 28
2.4 Spatiotemporal anomaly detection in cellular networks . . . 28
2.4.1 Detection of spatiotemporal anomalies . . . 28
2.4.2 Per-app mobile traffic analysis . . . 29
2.4.3 Group anomaly detection . . . 29
2.5 Summary . . . 30
3 Detection of zero-day attacks 31 3.1 Introduction . . . 31
3.2 Split-and-Merge Port-centric Network Anomaly Detection . . . 33
3.2.1 Rationale . . . 33
3.2.2 Features design . . . 34
3.2.3 Local anomaly detection . . . 35
3.2.4 Central correlation . . . 37
3.3 Network traffic datasets . . . 37
3.4 Evaluation . . . 38
3.4.1 Normal distribution fitting . . . 39
3.4.2 Local anomaly detection . . . 40
3.4.3 Comparison between aggregated and split views . . . 40 5
3.4.4 Last years panorama . . . 42
3.4.5 Anomaly score distribution . . . 46
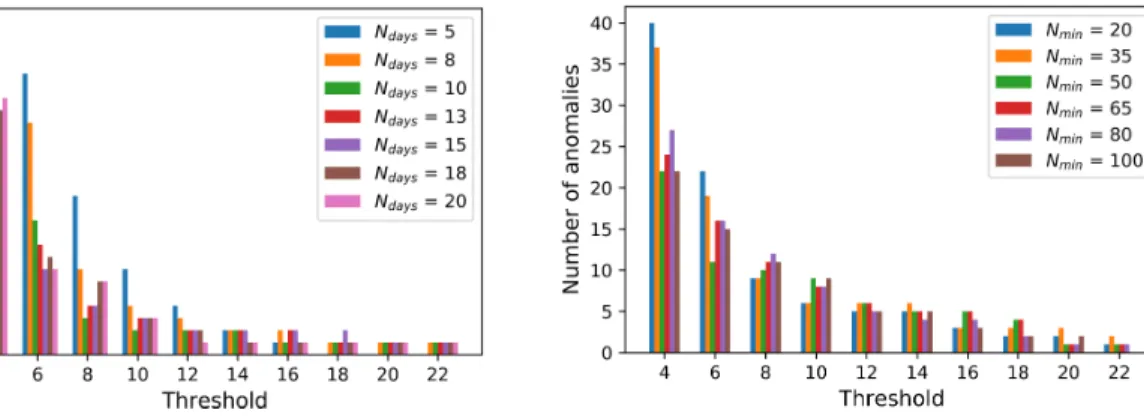
3.4.6 Features and parameters choice . . . 47
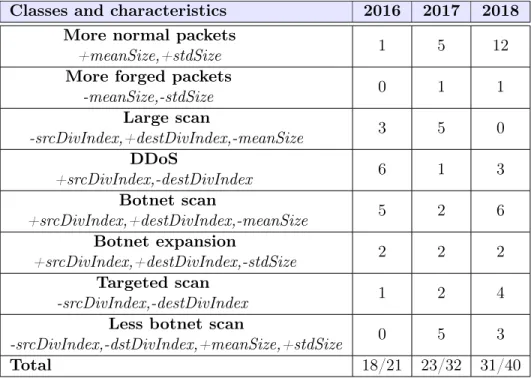
3.4.7 Anomalies classification . . . 50
3.4.8 Ground-truth . . . 51
3.5 Complexity and performances analysis . . . 52
3.5.1 Complexity analysis . . . 52 3.5.2 Execution performance . . . 53 3.6 Conclusion . . . 53 4 Botnet Fingerprinting 55 4.1 Introduction . . . 55 4.2 Dataset . . . 57 4.3 Bots Fingerprints . . . 58 4.3.1 Preliminary example . . . 58 4.3.2 Methodology . . . 58
4.3.3 Flow records collection and formatting . . . 60
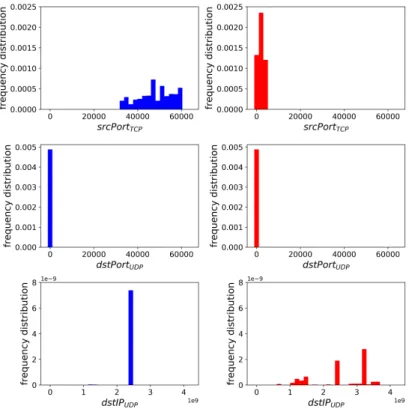
4.3.4 Quantification (attribute frequency distributions) . . . 60
4.3.5 Signatures formatting . . . 63 4.4 Bot Detection . . . 64 4.4.1 BotFP-Clus . . . 64 4.4.2 BotFP-ML . . . 67 4.5 Evaluation . . . 67 4.5.1 BotFP-Clus . . . 67
4.5.2 Comparison between BotFP-Clus and BotFP-ML . . . 70
4.5.3 Comparison to state-of-the-art detection techniques . . . 71
4.6 Complexity . . . 72
4.6.1 Attribute frequency distributions computation . . . 72
4.6.2 Training . . . 73
4.6.3 Classification . . . 73
4.6.4 Comparison to other techniques . . . 73
4.7 Conclusion . . . 75
5 Group anomaly detection in mobile apps usages 77 5.1 Introduction . . . 77
5.2 Measurements and dataset . . . 79
5.3 ASTECH Methodology . . . 80
5.3.1 Algorithmic approach . . . 80
5.3.2 Notations . . . 81
5.4 Time series anomaly detection . . . 83
5.4.1 Time series decomposition . . . 83
5.4.2 Detection of raw anomalies . . . 84
5.5 Group anomalies . . . 85
5.5.1 Identification of abnormal snapshots . . . 85
5.5.2 Detection of group anomalies . . . 86
5.5.3 Fine-grained characterization of group anomalies . . . 86
5.6 Numerical results . . . 89
CONTENTS 7
5.6.2 Group anomalies . . . 91
5.6.3 Group anomalies classification . . . 95
5.7 Conclusion . . . 98
6 Conclusion 99 6.1 Summary of contributions . . . 99
6.2 Perspectives . . . 100
6.2.1 Detection of zero-day attacks . . . 100
6.2.2 Botnet Fingerprinting . . . 101
6.2.3 Group anomaly detection in mobile app usages . . . 101
Appendix A Virtual network function service chaining anomaly detection 105 A.1 Introduction . . . 105
A.2 VNF Service Chaining Problematics . . . 106
A.3 VNF Service Markov Chain . . . 108
A.4 VNF Service Chain Classification . . . 109
A.4.1 Normal Behavior Cluster . . . 109
A.4.2 VNF Chains Classification . . . 110
A.5 Simulations and Performance Analysis . . . 111
A.5.1 Evaluation Metrics . . . 111
A.5.2 Resolution of the Decision Criterion . . . 111
A.5.3 Classification Results . . . 113
A.6 Conclusion . . . 113
Appendix B Botnet Fingerprinting supplementary materials 115 B.1 Observation of bots fingerprints . . . 115
B.2 Importance of features selection . . . 115
Abstract
English version
Last years have witnessed an increase in the diversity and frequency of network attacks, that appear more sophisticated than ever and devised to be undetectable. At the same time, cus-tomized techniques have been designed to detect them and to take rapid countermeasures. The recent surge in statistical and machine learning techniques largely contributed to provide novel and sophisticated techniques to allow the detection of such attacks. These techniques have multiple applications to enable automation in various fields. Within the networking area, they can serve traffic routing, traffic classification, and network security, to name a few. This thesis presents novel anomaly detection and classification techniques in IP and mobile networks. At IP level, it presents our solution Split-and-Merge which detects botnets slowly spreading on the Internet exploiting emerging vulnerabilities. This technique monitors the long-term evolutions of the usages of application ports. Then, our thesis tackles the detection of botnet’s infected hosts, this time at the host-level, using classification techniques, in our solution BotFP. Finally, it presents our ASTECH (for Anomaly SpatioTEmporal Convex Hull) methodology for group anomaly detection in mobile networks based on mobile app usages.
French version
Ces dernières années ont été marquées par une nette augmentation de la fréquence et de la di-versité des attaques réseau, qui apparaissent toujours plus sophistiquées et conçues pour être indétectables. En parallèle, des techniques sont développées pour les détecter et prendre des contre-mesures rapidement. Récemment, l’essor des techniques statistiques et d’apprentissage machine ("machine learning") ont permis un développement rapide de techniques innovantes visant à détecter de telles attaques. Ces techniques ont des applications dans de nombreux domaines qui gagneraient à être davantage automatisés. Dans le domaine des réseaux, elles s’appliquent par exemple au routage et à la classifcation de trafic et à la sécurité des réseaux. Cette thèse propose de nouveaux algorithmes de détection d’anomalies et de classification ap-pliqués aux réseaux IP et mobiles. Au niveau IP, celle-ci présente une solution Split-and-Merge qui détecte des botnets qui se propagent lentement sur Internet en exploitant des vulnérabil-ités émergentes. Cette méthode analyse l’évolution à long-terme de l’usage des ports applicatifs. Ensuite, celle-ci aborde la détection d’hôtes infectés par un botnet, cette fois en utilisant des tech-niques de classification au niveau de l’hôte, dans une solution nommée BotFP. Enfin, cette thèse présente notre algorithme ASTECH qui permet la détection d’anomalies brutes dans les séries temporelles dans les réseaux mobiles, les regroupe en enveloppes convexes spatio-temporelles, et finalement induit plusieurs classes d’événements.
Chapter 1
Introduction
The diversity and frequency of network attacks have boomed in recent years, and such attacks appear more sophisticated than ever and devised to be undetectable. At the same time, adaptive techniques have been designed to detect them as soon as possible and to take rapid countermea-sures. The recent surge in statistical and ML techniques largely contributed to provide novel and sophisticated techniques to allow the detection of such attacks. These techniques have multiple possible implications in any system that would require automation, in many fields. Within the networking area, they can serve traffic routing, traffic classification, network security, to name a few. We note that attackers may also leverage data analysis and ML techniques to finely craft their attacks and mimic normal end-user behaviors, which makes their detection even more com-plex. In this introduction, we first discuss the needs for appropriate data analysis techniques for cyber-security (Section 1.1). We then present the surge in statistical and Machine Learning (ML) techniques (Section 1.2), and their possible applications to address current challenges on network security (Section 1.3). We finally introduce our different contributions to the field (Section 1.4).
1.1
Context and motivation
The nature of anomalies detected in network traffic data is quite diverse [1]. Anomalies range from outages (including equipment malfunctions and outages from cloud and mobile network operators) and operational events (including updates and ingress shifts), to unusual end-users behaviors (including flash crowds and point to multi-point communications) and malicious ones (including denial of service attacks and malicious scans). Therefore, we rather look at different granularity levels and range of features to take into account each anomaly type’s peculiarities. For example, Denial-of-Service (DoS) events may be detected by looking at per-flow volume anomalies, rather than to per-packet attributes. Network and port scanning may be detected at the flow-level (or even at the port-level), as each new port or combination of port and target IP generates a new flow. Finally, botnet detection may be performed at the flow-level and preferably at the host-level.
Furthermore, even if we focus on the detection of malicious behaviors, we also notice a wide variety of attacks that require specific detection techniques. The diversity in attackers’ operating modes renders the appropriate detection more difficult. Attacks are also constantly more sophisticated, as illustrated by the Mirai botnet [2] that launched a massive attack towards DNS servers of major Internet providers in 2016, cutting access to high-profile websites for several hours. Beforehand, it reunited nearby 50,000 devices in its bot army, but has not been detected until too late. Mirai acted like a revolutionary IoT-based malware since the release of
its source code [3] that led to a huge increase in other botnets’ development. As a matter of fact, malware that targets Internet-of-Things (IoT) devices is responsible for many Distributed Denial-of-Service (DDoS) attacks. It exploits the lack of security of connected objects to create botnets, spreading extremely fast. We expect to see an increase in such IoT attacks, along with the explosion of IoT devices that could grow up to 125 billion by 2030 [4]. Recently, DDoS attacks significantly increased in terms of number and duration; indeed, the first half of 2018 saw seven times more large attacks (higher than 300 Gbps) compared to the same period in 2017, as noted in a Kaspersky report [5]. Furthermore, these botnets slightly propagate and affect whole networks without even being noticed, until they reach their real target. Most botnets today are designed to serve economic ends, as illustrated by Botnet as a Service (BaaS) [6] services that sold instances of botnets to third parties.
Designed to ensure cyber-security in networks, Intrusion Detection Systems (IDSs) aim to identify malicious activities and related threats. However, as a matter of fact, some botnets are not detected during their spreading, but only at the time of the final attack. We specifically study the case of the Mirai botnet and we invoke several reasons why it has not been detected soon enough. (i) Current IDSs traditionally work with traffic granularity such as the flow, host, or packet-level. They do not monitor application ports and thus may miss global changes on the ports involved during the propagation of botnets. Ports can be scanned to fingerprint the target machine, to exploit known vulnerabilities, or to communicate with a Command-and-Control (C&C) server [7]. The sole common denominator for a botnet coming from very distinct sources and targeting lots of hosts is the port it scans. However, an IDS working on IP addresses would be unable to notice the anomalous port. (ii) Moreover, most IDSs work on small variations of traffic, generally using sliding windows of several seconds. Therefore, they cannot build long-term profiles per port and detect major changes in their usage. (iii) IDSs are usually deployed at a single point in the network, while ISP-scale attacks are only visible by looking at a holistic view of a wide area network. For these reasons, several botnets like Mirai have not been detected until too late. It is thus possible to develop dedicated algorithms to detect botnets of these kinds, but by design, they are not made to adapt to other anomalies types and thus appear deficient in detecting them. In fact, we have to find a trade-off between the detection accuracy (which is high if the algorithm is crafted to detect a specific kind of attack) and its scope (which is high if the algorithm can adapt to variants of such attacks or even other attack types).
This introduces a number of challenges for network security: attackers employ complex tech-niques to hide and the attacks become more and more sophisticated. There is thus an urgent need to detect this kind of threat as soon as possible. Dedicated techniques are designed to prevent systems and networks from being corrupted and to limit harms in the case of an attack. Cybersecurity researchers and attackers are the two players in this cat-and-mouse fight. The first ones seek to understand the modus operandi of attackers, sometimes very complex, and to design robust Intrusion detection systems (IDSs) adapted to constantly evolving attacks. In return, attackers employ innovative techniques to slip by unnoticed and go through the radar.
1.2
Statistical and ML techniques
In 1959, Arthur Samuel, a pioneer in the field of Machine Learning, introduced it as the field of study that gives computers the ability to learn without being explicitly programmed: "A computer can be programmed so that it will learn to play a better game of checkers than can be played by the person who wrote the program" [8]. Such techniques are designed to solve complex problems and enable automation in different areas. However, it was initially eschewed due to its large computational requirements and the limitations of computing power present at that time.
1.3. DATA ANALYSIS APPLICATIONS TO NETWORKING 13 Due to the recent improvements in computing capacities and ML techniques and in big data storing and processing, last years have witnessed a large surge of statistical and ML techniques. Originally, statistical models have also been used to solve problems and enable automation. Like ML models, such techniques serve anomaly/outlier detection, for example through changepoint detection algorithms (e.g., based on the z-score metric) or time series decomposition. ML models are based on statistical learning theories and are classified into four learning paradigms: classi-fication, regression, clustering, and rule extraction, each of those including several algorithms.
Therefore, both statistical and ML models contribute to the field of data analysis, but with slightly different purposes [9]. Statistical models require a good understanding of the data and are designed for inference about the relationships between variables, whereas ML models are designed to make the most accurate predictions possible. They also work well in conjunction with each other. In [10], the authors compare the performances of statistical and ML methods, for multiple forecasting horizons. According to their results, ML methods need to become more accurate, requiring less computer time, and be less of a black box. They also demonstrate that traditional statistical methods are more accurate than ML ones, as they point out the need to discover the reasons involved and devise ways to reverse the situation. Nevertheless, the authors specify that their findings are only valid for the specific dataset being used. For more details about both techniques, Chapter 2 provides extensive background and related work that are fundamentally related to data analysis applied to network security.
1.3
Data analysis applications to networking
Data analysis, composed of statistical and ML techniques, has a myriad of possible applica-tions in the networking field. They include traffic prediction, traffic classification, traffic routing, congestion control, resource management, fault management, QoS and QoE management, and network security [11]. In our dissertation, we cover specifically the traffic classification and network security fields, seeking to provide novel algorithms designed to strengthen network cy-bersecurity. Traffic classification aims to accurately characterize and categorize network traffic into a number of classes of interest, according to various features. It enables network oper-ators to perform a wide range of network operation and management activities, like capacity planning, differentiation, performance monitoring, or resource provisioning. Generally, network traffic classification methodologies can be decomposed into four broad categories that leverage port number, packet payload, host behavior, or flow features, that we study later in Section 2. Network security intends to protect the network against cyber-threats that may compromise the network’s availability, or yield unauthorized access or misuse of network-accessible resources. Therefore, network security is quintessential for network operation and management. In addi-tion, current IDSs must take into account real-time constraints and manage to process large and fast-changing datasets.
In addition to network security, data analysis techniques generally enable one to provide a better characterization of traffic in mobile or IP networks and of the end-users behavior. These built profiles can help the design of methodologies to automatically detect unusual phenomena and attacks, but not only. Gaining better knowledge about end-users behaviors can be useful for resource provisioning or pervasive computing applications.
1.4
Contributions and thesis outline
The dissertation discusses several novel anomaly detection techniques in relation to important fields of networking in association with emerging technologies in it. We thus present such anomaly detection and classification techniques in three different contexts: the detection of vulnerabilities’ exploitation on the Internet, intrusion detection in IP networks (at enterprise-level), and anomaly detection cellular networks. On the same occasion, we develop methods that were not exploited before, by exploring novel points of view. The next three chapters of this manuscript correspond to each main technique.
First of all, Chapter 2 presents the background and related work of this thesis, first intro-ducing the state-of-the-art on statistical and machine learning techniques, and then covering the related work specific to each contribution.
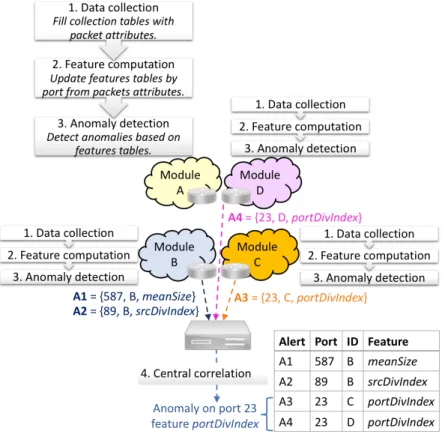
Chapter 3 proposes a technique for the early detection of emerging botnets and newly exploited vulnerabilities on the Internet, targeting botnets slightly spreading on the Internet not detected nor mitigated during their spreading. The Mirai botnet attack on September 2016, or more recently the memcached attack on March 2018, this time with no botnet required, are but two examples. Such attacks are generally preceded by several stages, including the infection of hosts or device fingerprinting; being able to capture this activity would allow their early detection. Our technique, named Split-and-Merge, consists in (i) splitting the detection process over different network segments, (ii) monitoring at the port-level, with a simple yet efficient change-detection algorithm based on a modified Z-score measure, (iii) aggregating local anomalies at a central correlation module to retain only the distributed ones. We argue how our technique can ensure the detection of large-scale attacks and drastically reduce false positives.
In Chapter 4, we explore another view angle for botnet detection, this time not at the Internet-level, but in IP networks and more especially in enterprise networks. Recent approaches supplant flow-based detection techniques and exploit graph-based features, incurring however in scalability issues, with high time and space complexity. Bots exhibit specific communication patterns: they use particular protocols, contact specific domains, hence can be identified by analyzing their communication with the outside. A way we follow to simplify the communication graph and avoid scalability issues is by looking at frequency distributions of protocol attributes capturing the specificity of botnets’ behavior. We propose a bot detection technique named BotFP, for BotFingerPrinting, which acts by (i) characterizing hosts behavior with attribute frequency distribution signatures, (ii) learning benign hosts and bots behaviors through either clustering or supervised Machine Learning (ML), and (iii) classifying new hosts either as bots or benign ones, using distances to labeled clusters or relying on an ML algorithm.
In Chapter 5, we leverage machine learning techniques in cellular networks to analyze mobile app communications and unleash significant information about the current social and infrastructure states. A wide variety of events can engender unusual mobile communication patterns that may be studied for pervasive computing applications, e.g., in smart cities. Among them, local events (like concerts), national events (like natural disasters), and network outages can produce anomalies in the mobile access network load. We propose our ASTECH (for Anomaly SpatioTEmporal Convex Hull) detection methodology that first decomposes cellular data usage features time series, then detects raw anomalies in the residual components derived from the decomposition. Our method then aggregates raw anomalies into snapshots first, and groups the most abnormal ones to form spatiotemporal clusters. We can so unveil details about the mobile events timeline, their spatiotemporal spreading, and their impacted mobile apps, by clustering them into broad categories.
1.4. CONTRIBUTIONS AND THESIS OUTLINE 15 thesis, which covers anomaly detection in service chains of virtual network function. Then, appendix B provides additional experiments related to our BotFP detection methodology pre-sented in Chapter 4, and in particular visual comparisons between different scanning processes and details about the feature selection process that we applied.
Chapter 2
Related work
This chapter introduces the concepts, background, and related work that are fundamentally related to data analysis applied to network security. It reviews the whole process of statistical and machine learning techniques, passing through their learning paradigms, performance metrics, and major applications. Then, the next three sections of this chapter follow the structure of the thesis, each of the sections corresponding to a chapter.
2.1
Statistical and machine learning techniques
Statistical and machine learning (ML) techniques can be leveraged for complex problems arising in network operation and management [11]. Last years have witnessed a surge of such tech-niques, thanks to significant improvements in computing capacities and recent advances in data storing and processing. Applied to network security, data analysis has been widely explored to develop novel automation and detection techniques. We first describe the theory behind statis-tical learning models and their relevance to the networking problem. Then we further review in detail the process for data analysis, which consists in various steps: (i) learning paradigms and ML techniques, (ii) data collection, (iii) features design, (iv) model evaluation, and (v) ML applications.
2.1.1 Statistical learning
Originally, ML detection tools rely on statistical learning theories to build their model. There also exist unsupervised detection tools that use plain statistical approaches; their central assumption is that the phenomena the most rarely observed are the most likely to be anomalous. In statistical approaches, the fine analysis of the built statistical profiles of traffic allows one to understand how the detected anomalous instances differ from the usual behavior; however, they work on a mono feature basis, thus do not correlate the different features by design. Moreover, statistical approaches work well combined with other algorithms as they are usually unable to provide additional information, such as the IP addresses of attackers or the attack root causes; in addition, they are of practically no computational complexity and easy to implement, which makes them a wise approach when the detection should operate with limited computational resources. Hidden Markov models
Hidden Markov Models (HMMs) are based on augmented Markov chains [12]. HMMs consist of statistical Markov models where the probability functions modeling transitions between the
states are determined in the training phase, contrary to Markov chains where they are set a priori. HMMs are widely used in pattern recognition, and now tend to be extensively applied to intrusion detection as well. They generally show excellent performance, although they are not yet adapted to fit real-world network constraints. Indeed, they require a large amount of time to model normal behaviors and the false positive rate stands relatively high. In [13], authors propose an IDS where the payload is represented as a sequence of bytes, and the analysis is based on an ensemble of HMMs.
Changepoint detection-based techniques
The implicit assumption behind changepoint detection-based techniques is that anomalies induce significant changes in the probability distribution of feature values. Therefore, these approaches are quite fit to detect coarse anomalies, which have a significant effect on traffic, as DoS and DDoS would do. A pioneer work devising an online anomaly detection technique in computer network traffic using changepoint detection methods is [14]. The algorithm is based on the multi-cyclic Shiryaev–Roberts detection procedure, which is computationally inexpensive and performs better than other detection schemes.
For changepoint detection algorithms, the z-score is a well-known and simple statistical met-ric commonly used to automatically detect sudden changes in time series. More precisely, it is the measure of how many standard deviations below or above the mean a data point is. Ba-sically, a z-score equal to zero means that the data point is equal to the mean, and the larger the z-score, the more unusual the value. An anomaly is detected if the absolute value of the modified z-score exceeds a given threshold. There also exist algorithms based on variants of this metric. The modified z-score uses the median and the median absolute deviation (MAD) from the median, instead of the classical mean and standard deviation respectively, which makes it outlier-resistant [15]. In addition, the smoothed z-score considers the influence of outliers, i.e., the weights of the past samples on the mean and standard deviation, with respect to the current sample.
Other approaches
Histograms are used to count or visualize the frequency of data (i.e., the number of occurrences) over bins, which consist of units of discrete intervals. Historically, they have been widely used in the data and image processing fields. Histogram-based algorithms, also named frequency-based or counting-based algorithms, rely on histograms containing the bins associated with the values of their attributes. [16] proposes an alternative approach to feature-based anomaly detection tools that builds detailed histogram models of the features and identifies deviations from these models. In addition, building comprehensive histograms is less computationally expensive than using coarse distribution or graph-based features.
2.1.2 ML techniques: paradigms and addressed problems
Now that we reviewed statistical learning-based approaches, we focus on ML techniques, inves-tigating the whole ML design pipeline.
Learning paradigms
2.1. STATISTICAL AND MACHINE LEARNING TECHNIQUES 19
Figure 2.1: Learning paradigms that benefit from machine learning: classification and regres-sion for supervised learning, and clustering and rule extraction for unsupervised learning.
1. Supervised learning techniques learn from a labeled dataset what constitutes either normal traffic or attacks – there exist different techniques such as SVM-based classifiers, rule-based classifiers, and ensemble-learning detectors [17].
2. Unsupervised approaches learn by themselves what is normal or abnormal – among them, MAWILab [18] finds anomalies by combining detectors that operate at different traffic granularities (the results against the MAWI dataset are in [18]); numerous works compare themselves to MAWILab, as for instance change-detection techniques [14, 19] (defining an anomaly as a sudden change compared to a model), and ORUNADA [20] (relying on a discrete time-sliding window to continuously update the feature space and cluster events). 3. Hybrid or semi-supervised approaches benefit from only a small part of labeled traffic,
meant to be enough to learn from, as proposed in [21].
4. Reinforcement learning (RL) is an iterative process with agents that take actions in order to maximize the notion of cumulative reward. In the purpose of decision making, the learning is traditionally based on exemplars from training datasets. The training data in RL constitutes a set of state-action pairs and rewards (or penalties).
Problem categories
Four broad categories of problems can leverage ML, namely classification, regression, clustering, and rule extraction, as illustrated in Fig. 2.1. First of all, classification and regression are two supervised learning approaches; their objective is to map an input to an output based on example input-output pairs from labeled data. Regression approaches predicts continuous values output, whereas classification predicts discrete values, consisting in the different labels. Then, clustering and rule extraction are unsupervised learning techniques: clustering is the task of partitioning the dataset into groups, called clusters - the goal is to determine grouping among unlabeled data, while increasing the gap between the groups; rule extraction techniques are designed to identify statistical relationships in data, by discovering rules that describe large portions of the dataset. Note that the choice of the learning paradigm strongly depends on the training data. For example, if the dataset is not labeled, supervised learning cannot be employed and other learning paradigms must be considered.
Concrete ML techniques applications.
To illustrate the diversity in ML techniques applications, we provide concrete use cases for each of the aforementioned learning paradigms:
• Classification techniques are traditionally used in problems that contain labeled datasets, with two or more distinct classes. Botnet detection is but one example of such cases, where we can distinguish between malicious and benign flows; this way, the ML algorithm implicitly learns the inherent characteristics of a bot, and those of a benign host.
• Regression techniques are traditionally used for time series forecasting [22, 23]. The objec-tive is to construct a regression model able to induce future traffic volume based on previous instances of traffic. Regression techniques are also employed to assess the impact of the global network condition on the QoS or QoE [24]. Finally, monitoring Key Performance Indicators (KPI) in large-scale networks enables the quick detection of network outages and attacks.
• Clustering techniques are usually employed for outlier detection purposes. In network cyber-security, many intrusion detection schemes [20] rely on data clustering to highlight significant deviations compared to usual end-user behaviors.
• Finally, rule extraction techniques, also named association rule mining, are commonly employed for personalized recommendations. Market Basket Analysis [25] is one of the key techniques used by large retailers to discover correlations within sets of items. These techniques are also used by recommendation engines as for Netflix (for personalized movies recommendation) and Amazon (for suggestions of other articles related to the purchased one).
2.1.3 Data collection
The process of collecting data to apply and validate a given ML technique is an important step, but nonetheless difficult. Finding representative data, possibly without bias and labeled is a non-trivial task. Datasets also vary from one problem to another and from one time period to the next one.
Data monitoring techniques are classified into active, passive, and hybrid techniques [26]. Active monitoring uses traffic measurement in order to collect relevant data and examine the state of networks. Such approaches commonly consist in a set of distributed vantage points hosting measurement tools like ping and traceroute; among them, RIPE Atlas [27] is a global network of over 10,000 probes that measure Internet connectivity and reachability, used for instance in [28] where authors identify data-center collocation facilities in traceroute data from RIPE Atlas built-in measurements, then monitors delay and routing patterns between facilities. In [29], given an arbitrary set of traceroutes, the authors first spot routing paths changing similarly over time, then aggregate them into inferred events and collect details to identify its cause.
In contrast, passive monitoring collects existing traffic and infer the state of networks from it. Compared to active monitoring, it ensures that the inferred statistics correspond to real traf-fic and it does not introduce additional overhead due to bandwidth consumption from injected traffic. Passive monitoring data can be obtained from various repositories, given it is relevant to the networking problem being studied. Such traces include CDN traces [30], darknets [31], and network telescope datasets [32, 33]. The latter consists of a globally routed, but lightly utilized
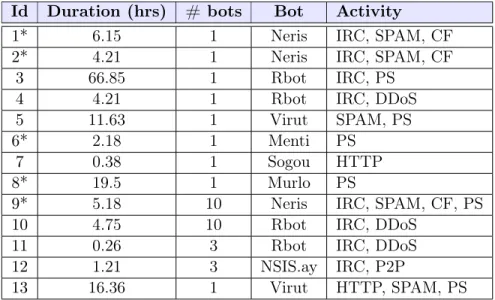
2.1. STATISTICAL AND MACHINE LEARNING TECHNIQUES 21 network prefix - a /8 for the University of California San Diego (UCSD) Network Telescope Aggregated Flow Dataset [32] and /20 for the Network Telescope dataset from LORIA [33]. Inbound traffic to non-existent machines is unsolicited and results from a wide range of events, including misconfiguration, scanning of address space by attackers or malware looking for vul-nerable targets, and backscatter from randomly spoofed DoS attacks. Other examples of passive data repositories include the Measurement and Analysis on the WIDE Internet (MAWI) Working Group Traffic Archive [34] and the CTU-13 dataset [35]. We later review these datasets in detail, respectively in Sections 3.3 and 4.2.
2.1.4 Feature design
Before applying an ML algorithm to the dataset, the collected raw data must be formatted to cover an adequate set of features. The first phase named Feature Extraction consists in cleaning the dataset that may contain missing values or noise. In addition, the collected raw dataset may be too voluminous to be handled. The need for dimensionality reduction is justified by multiple reasons. First, a large number of features may induce a high computational overhead. Also, a phenomenon called the curse of dimensionality refers to the sparsity in data increasing with the number of dimensions, which makes the dataset no more consistent. We first depict the features traditionally selected for anomaly detection depending on the aggregation level. We then review the main strategies employed for feature extraction.
Common feature choice
In reality, the feature choice directly depends on the problem formulation (i.e., the detection tar-get) and thus on the granularity level. The taxonomy of aggregation levels for network anomaly detection includes payload-based, host behavior-based, and flow feature-based techniques.
Payload-based anomaly detection systems parse the packet payload looking for known ap-plication signatures. However, this incurs a high computational overhead and requires manual interventions from humans to monitor the alerts and regularly update the signatures database. In addition, the payload tends to be systematically encrypted due to privacy concerns. Payload-based systems usually employ features such as the payload size, but also more complex ones like specific byte sequences or particular key-words present in the payload that would execute malicious actions.
Host behavior-based anomaly detection systems compute per-host traffic features to model behavioral characteristics of hosts. Contrary to payload-based systems, it examines the inherent characteristics of hosts but also assesses graph-based features by considering hosts as nodes in a graph, to measure for example the centrality of nodes or the amount and frequency of traffic exchanged between the nodes. IDSes implemented at the host-level are named Host-based Intrusion Detection Systems (HIDSes), whereas those at the network-level are named Network-based Intrusion Detection Systems (NIDSes). Common features used by such systems include packet counts exchanged between nodes [36], service proximity, activity profiles, session duration, periodicity [37], and byte encoding [38, 39] or statistical characterization of bytes [40], for each packet or each flow coming from a host.
Flow feature-based anomaly detection systems aggregate communications on a per-flow basis, which consists of a 5-tuple made from the protocol, the source and destination IP addresses, and the source and destination port numbers. It is then a unidirectional exchange of consecutive packets on the network from a port at an IP address to another port at another IP address using a particular application protocol, including all packets pertaining to session setup and tear-down, and data exchange. A feature is an attribute representing unique characteristics
of a flow, such as the number of packets in a flow, mean packet length, packet inter-arrival time, flow duration, entropy, to name a few. Entropy basically represents the traffic distribution predictability and enables one to detect volume-based anomalies such as DoS and DDoS. Flow feature-based techniques use flow features as discriminators to map flows to classes of interest. Feature extraction
Two main processes are usually employed to adequately select features. The process of Feature Selection consists in removing the features that are not relevant or redundant in order to keep only a limited set of features. The filtering strategy (e.g. information gain), the wrapper strategy (e.g. search guided by accuracy), and the embedded strategy (selected features are added or removed while building the model based on prediction errors) are three techniques for feature selection.
The second process, named Feature projection, projects the data from a high-dimensional space to a space of fewer dimensions. The variance between each class is accentuated in the re-sulting space, removing redundancy in data. Both linear and nonlinear dimensionality reduction techniques exist. The main linear technique is named Principal Component Analysis (PCA), which finds the directions of maximum variance [41]. The fraction of variance explained by a principal component is the ratio between the variance of that principal component and the total variance. The objective is to reduce the dimensionality while keeping a good amount of infor-mation, so that the cumulative explained variance ratio is close to 100%. PCA may also be used for traditional outlier detection [42, 43]. Using real traffic traces, [43] demonstrates that normal traffic data can reside in a low-dimensional linear subspace and form a low-rank tensor. The anomalies (outliers) should stay outside this subspace. Therefore, tensor-based approaches try to recover the normal data by separating the low-rank normal data and outlier data from the noisy traffic data captured, and then detect anomalies by using the outlier data separated. 2.1.5 Performance metrics and model validation
In the case of supervised learning, we are able to compute some metrics to assess the performance of our classification model. A confusion matrix is a table often used to evaluate the performance of a classification model [11]. The basic terms are the following (expressed as whole numbers and not rates): True Positive (T P ) is the number of bots correctly classified; True Negative (T N) is the number of benign hosts correctly classified; False Positive (F P ) is the number of benign hosts incorrectly classified; False Negative (F N) is the number of bots incorrectly classified. This is a list of rates that are often computed from the confusion matrix for a binary classifier:
• Accuracy, computed as ACC = T P +T N
T P +T N +F P +F N, shows the percentage of true detection
over the total number of instances. High accuracy is required. However, a bias may be introduced if the dataset is too unbalanced, then we need to consider other metrics. • True Positive Rate, defined as T P R = T P
T P +F N, also known as recall, shows the
percent-age of predicted malicious instances versus all malicious instances. A high T P R value is desirable.
• False Positive Rate, computed as F P R = F P
F P +T N, also known as false alarm rate, refers
to the ratio of incorrectly classified benign instances versus all the benign instances. A low F P Rvalue is desirable. If the dataset is too unbalanced, consider using the precision and recall instead of the TPR and FPR.
2.2. INTRUSION DETECTION 23 • Precision, computed as P = T P
T P +F P, refers to the ratio of incorrectly classified benign
instances versus all the benign instances. A high P value is desirable. • Recall, computed as R = T P
T P +F N, also known as false alarm rate, refers to the ratio of
incorrectly classified benign instances versus all the benign instances. A high R value is desirable.
• F1-score, computed as F 1 = 2 · P ·R
P +R, is defined as the harmonic mean of the precision and
recall. A high F 1 value is desirable.
When no ground-truth is available (e.g., in unsupervised learning), we cannot directly assess the quality of a model. Then we must create ground-truth labels ourselves, for example by comparing several datasets and mixing various sources.
2.2
Intrusion detection
In this section, we present intrusion detection methodologies and review related work related to Chapter 3, including the different families for intrusion detection systems (IDSs) and large-scale IDSs, and those centered around botnet detection. Fig. 2.2 shows the general classification of intrusion detection systems. We introduce granularity levels in Section 2.1.4, intrusion detection methodologies in Section 2.2.1, and the different architectures in Section 2.2.2.
Figure 2.2: General classification of Intrusion Detection Systems.
2.2.1 Intrusion detection methodologies
Many algorithms are proposed in the literature for network intrusion detection [44]. We can classify them into three main families: signature-based, anomaly-based, and hybrid techniques.
Signature-based, also referred to as knowledge-based or misuse-based, solutions such as Snort [45], Zeek (formerly Bro) [46], or Suricata [47], rely on a signature database to find attacks that match given patterns, such as malicious byte sequences or known malware signatures. The first step consists in building a set of rules based on signatures; large rules databases can be purchased online and one can also create custom rules. Then, a rule is defined as: the action to apply if there is a match (e.g., alert, log, pass), the protocol to filter, the source and destination IP addresses, the port numbers, the traffic direction, and the options (TCP flags, payload size, etc.). The network administrator then collects the logs produced by the IDS and manually visualizes the set of produced alerts. Up to now, most companies rely on signature-based IDSs as they are expressive and understandable by network administrators. Nevertheless, they are not able to detect zero-day attacks, i.e., attacks exploiting unknown vulnerabilities, for which no patch is available [48], and the signatures database must be updated regularly.
Anomaly-based approaches attempt to detect zero-day attacks, in addition to known ones. Compared to signature-based approaches, they require prior learning on data. They model the normal network traffic and qualify an anomaly as a significant deviation from it, with statistical or machine learning techniques. In such a case, we talk about anomalies rather than attacks. As ad-dressed in Section 2.1.2, the methodology to detect anomalies can leverage statistical techniques, or supervised, unsupervised or semi-supervised ML techniques. BotSniffer [49] utilizes statistical methods to detect Command-and-Control channels (C&C) botnets, in which bot-infected hosts listen for attack commands from the attacker via this channel. To detect them, the authors seek for coincident behaviors among hosts, like messages to servers, network scans, or spam. The authors in [50] observe changes in feature distributions to identify anomalies. Entropy and/or volume are such metrics used for this purpose.
Various IDSs systems in the literature propose to combine signature-based or supervised techniques with unsupervised ones, that we call hybrid systems. They present the advantage of improving the detection rate and minimizing the false positive rate, inheriting the advantages of both methods. ADAM [51], which stands for Audit Data Analysis and Mining, is one of the most popular hybrid IDSs. ADAM has two stages of detection: (i) it builds a set of recurrent benign instances from attack-free datasets; then (ii) it finds frequent itemsets in connections and classify them compared to the previous database, into known or unknown attack types or false alarms. Another approach, [52], proposes a hybrid intrusion detection method, composed of a misuse detection model based on the C4.5 decision tree algorithm and multiple one-class SVM models to model the normal behavior. Finally, [53] uses a Self-Organizing Map (SOM) structure to model normal behavior, and J.48 decision trees for the misuse module.
2.2.2 Large-scale intrusion detection
Coordinated attacks arise in multiple networks simultaneously and include large-scale stealthy scans, worm outbreaks, and DDoS attacks [54]. Traditional IDSs tend to fail at detecting these attacks as they commonly monitor only a limited portion of the network. Large-scale IDSs, in-stead, have a global view over the network, and can better scale by distributing the computational load between several detection agents. Two large-scale IDS approaches can be identified.
The first IDS approach consists in distributing flow collectors in different subnetworks and in running a central detection engine against aggregated data, as shown in Figure 2.3a. Raw packets are transmitted from the flow collectors to the detection engine [55]. Solutions exist to avoid the collection traffic overhead, as done by Jaal [56], which creates and sends concise packets summaries to the detector - with Jaal, one reaches a 35 % bandwidth overhead to get an acceptable true positive rate, which is still important.
2.2. INTRUSION DETECTION 25
(a) Local collection and central detection. (b) Centralized CIDS: local collection and detec-tion, and central correlation.
Figure 2.3: Two possible approaches for large-scale IDS.
The second IDS approach consists in Collaborative Intrusion Detection System (CIDS), which is a two-level anomaly detection system where monitors are physically split in the network to perform local detection. They generate low-level alerts then aggregated to produce a high-level intrusion report. Three types of CIDSes exist depending on communication architecture:
1. Centralized CIDSes are composed of several monitors that transmit the alerts to a central correlation engine, as illustrated in Figure 2.3b.
2. Hierarchical CIDSes use a multistage structure of monitors to achieve an increasingly higher alert aggregation until the alerts reach the top correlation engine.
3. Distributed CIDSes share the detection and correlation tasks between all monitors. This approach can be set up by a peer-to-peer network.
For instance, [57] presents a centralized CIDS framework composed of IDS clusters imple-menting both the detection and the correlation; Snort signatures are therein used to detect known attacks, while an unsupervised learning algorithm detects unknown attacks. [58] proposes a sort of distributed CIDS, composed of Intrusion Prevention Systems forming rings around the hosts to protect, in order to collaborate and forward the traffic adaptively depending on their findings. Inherent in the CIDSs, alert correlation algorithms can be divided into three categories [59]: (i) similarity-based algorithms, which compute the similarity between an alert and a cluster of alerts, and based on the result either merge it with the cluster or create a new one; (ii) knowledge-based algorithms, which rely on a database of attacks definitions; (iii) probabilistic algorithms, which use similar statistical attributes to correlate attacks.
2.2.3 Application to botnet detection Flow-based botnet detection
In the past years, several novel algorithms for botnet detection have been proposed, which can be classified into packet- or flow-based ones and graph-based ones. Among them, [60] compares the performances of four different approaches: Snort, BotHunter, and two data-mining based system ones, either based on the packet header/payload or on flows. They run their algorithm on public datasets, including the Conficker dataset from CAIDA, the ISOT-UVic dataset, and Zeus botnet datasets from Snort, NETRESEC, and NIMS. As a result, they get detection rates
approaching up to 100%. BotMark [61] exploits both statistical flow-based traffic features and graph-based features to build its detection model, then considers similarity and stability between flows as measurements in the detection. The authors test their algorithm by simulating five newly propagated botnets, including Mirai, Black energy, Zeus, Athena, and Ares, and achieve 99.94% in terms of detection accuracy. In [62], the authors create a complete characterization of the behavior of legitimate hosts that can be used to discover previously unseen botnet traffic. They employ the ISCX botnet dataset, a publicly available dataset composed of various IRC, P2P, and HTTP-based botnets. They find that their framework can detect bots in a network with 100% TPR and 8.2% FPR. It is worth noting that the aforementioned algorithms perform their analysis at the network-level, on traffic generated by botnets. Their objective is to distinguish between benign hosts and bots, to then draw a confusion matrix and evaluate their classifier. Then they are not designed to run at an Internet carrier link-level. We later expose in Chapter 3 our wish to analyzing the current trends in Internet traffic over several years, including trends in terms of botnets.
Port-based detection techniques
A few works specifically focus on port-based detection but they do not apply to CIDS. In [7], the authors propose a survey of the current methods to detect port scans. [63] aims to show the correlation between port scans and attacks. [64] examines the period during the release of a zero-day attack and its patching. Also, [63, 64] analyze port-usage but they do not use destination ports as the primary key. Actually, this last setting generates a high number of false positives, which can be mitigated by CIDS as we are doing. In the literature, the numbers of unique source IP addresses and unique active /24 blocks are used to detect Internet outages [65] and large-scale spoofing [66].
2.3
Botnet Detection
The last section covered the related work on intrusion detection systems, we now specifically address the field of botnet detection related to Chapter 4. The word "botnet" comes from the combination of "robot" and "network". In this display, the attackers infect and control thousands of machines, then send them malicious commands to execute, like infecting, attacking, or scanning other hosts. This large zombie network is then a major vector of large-scale attacks such as phishing DDoS, Trojans, spams, etc. To communicate with bots, cybercriminals use Command-and-Control (C&C) channels implemented in different ways (the most popular ones are IRC, HTTP, P2P, and Telnet [67]).
Considering the importance of the matter, an extensive number of works exist in this field. While traditional approaches rely on statistical and machine learning approaches over per-flow features, recently studied graph-based approaches analyze the relations between several hosts of a network.
2.3.1 Flow-based techniques
Flow-based techniques work by removing the packet payload and inspecting the packet header only [68]. Let us classify them as follows.
2.3. BOTNET DETECTION 27 Statistical methods
BotHunter [69] aims to recognize the infection and coordination dialog that occurs during a successful malware infection. A similar approach, BotSniffer [49], focuses on the detection of C&C channels which are essential to a botnet. Therefore it exploits the underlying spatiotemporal correlation and similarity property of botnet C&C (horizontal correlation). The C&C server uses to contact every bot at the same time, then each of them uses to undertake some malicious actions following the C&C commands; these behaviors can be observed simultaneously in a network to spot a C&C channel, thus an underlying botnet.
BotHunter and BotSniffer perform their evaluation on their own honeynet or on traces authors built by executing malware binaries. However, these traces are not publicly available and [70] highlighted the lack of suitable comparisons for botnet detection algorithms due to the lack of public botnet datasets. Hence the authors a labeled botnet dataset named the CTU-13 dataset [35] (later introduced in Section 4.2), including botnet, normal, and background traffic. In addition, the authors present two methods to identify botnets in these traces. The first one named BClus is a botnet detection approach. It creates models of known botnet behavior by computing features per source IP address, then it uses them to detect similar traffic on the network. The second one named CAMNEP is a network behavior analysis system that combines various state-of-the-art anomaly detection methods, such as MINDS, Xu, Lakhina volume, and Lakhina entropy [71].
Machine learning methods
Machine learning methods include artificial neural networks, support vector machines (SVM), k-nearest neighbor (k-NN), decision trees and clustering. As seen in Section 2.1.2, ML methods include supervised, unsupervised, and hybrid learning. Supervised learning techniques encompass different methods such as SVM-based classifiers, rule-based classifiers, and ensemble-learning detectors [17]. Due to its excellent generalization performance, Support Vector Machines (SVM) are used in many security applications [72, 73]. The unsupervised learning technique [74] proposes an unsupervised learning based ML solution to identifying known and unknown anomalies in IoT, more especially with auto-encoders; [75] also proposes an unsupervised approach, identifying the most dissimilar graphs. Finally, hybrid approaches benefit from only a small part of labeled traffic, meant to be enough to learn from, as proposed in [21].
Other methods
Other methods use various entropy measurements. For instance, [58] proposes a technique to detect large-scale anomalies in the network traffic, by measuring the deviation between the profiles of normal traffic and incoming flow records. [70] proposes a behavioral botnet detection method using Markov Chains to model the different states in the C&C channel. The proposed method is trained and evaluated using the CTU-13 dataset and gives a 92% F1-measure and a 0.05% false positive rate. The authors in [76] focus on detecting bot-infected machines at the enterprise-level, by considering the complete DNS activity of a host per hour. They used an extensive set of features computed over campus DNS network traffic, and as a result, identified suspicious DNS connections to detect infected machines.
However, flow-based techniques may miss some communication patterns between hosts that are quite specific to a botnet. Furthermore, working on a per-flow or per-host basis may incur a high computational overhead.
2.3.2 Graph-based techniques
Graph-based approaches [77] aim to model the relations between several hosts of a network. They are studied for various situations, for example, to detect P2P bots [78, 79] or to recognize DNS traffic from malicious domains [80]. In [81], the authors distinguish between several kinds of traffic and make groups of flows from: (i) the most frequent 11 destination port numbers used by TCP and UDP, (ii) all other TCP/UDP destination port numbers, and (iii) ICMP flows. They use plain and derived features for each of these categories, then they train three unsupervised learning algorithms on normal traffic with these features. As a result, with k-NN they achieve over 91% detection rate with around 5% false positive rate. BotGM [75] proposes an unsupervised graph mining technique to identify abnormal communication patterns and label them as botnets. The authors first construct a graph sequence of ports for each pair of source and destination IP addresses, then they compare each graph between them using the Graph-Edit Distance (GED). As a result, they reach a very good accuracy between 78% and 95%. However, this technique is very costly as the GED is computed once for each pair of graphs and its computation is known to be NP-complete. The authors in [82] model network communications as graphs, where hosts are edges and communications between hosts vertices. They compute graph-based features such as In-Degree and Out-Degree and diverse centrality measures. They use a hybrid learning method and test various ML techniques to achieve a good detection rate. However, this technique incurs a high computational overhead as features are computed over a large communication graph, e.g., used by shortest paths algorithms computed for centrality measures. Other graph-based detection methods [83, 84] seem promising, but their complexity is often high, NP-complete as for [84] and [75], or cubic for [82] (see Section 4.6).
2.4
Spatiotemporal anomaly detection in cellular networks
In this section, we now review the related work on spatiotemporal anomaly detection, per-app mobile traffic analysis, and group anomaly detection, related to Chapter 5.
2.4.1 Detection of spatiotemporal anomalies
The survey [85] reviews large-scale mobile traffic analysis with respect to social, mobility, and network aspects. From a social perspective, authors show how the relationships between mobile traffic and a wide set of social features are addressed in the state of the art. Demographic, eco-nomical, or environmental factors do influence the way users consume mobile apps indeed. These factors are classified into four broad categories: users’ interactions, demographics, environment, and epidemics. The possible relationships between the environment, in terms of both geograph-ical and temporal features, and the communication structure are also described. Among them, the authors focus on the detection of special events, ranging from political happenings (e.g., elec-tions or manifestaelec-tions) to entertainment occasions (e.g., concerts, sports games) and accidents (e.g., power outages or exception road congestion).
Authors in [86, 87] propose threshold-based algorithms to detect special events. In [88], au-thors use the information on residual communication to determine how different geographical areas are affected by a same unusual event. Using a time series decomposition, they: (i) first exploit the Seasonal Communication Series (SCS) to segment the city into distinct clusters by noticing similar patterns of socio-economic activity, and (ii) compare the Residual Communi-cation Series (RCS) of similar areas to detect local events. Another approach in [89] proposes a dedicated framework to detect general outlying behaviors, based on the hourly geographical
2.4. SPATIOTEMPORAL ANOMALY DETECTION IN CELLULAR NETWORKS 29 variations of mobile traffic, able to detect national holidays, political happenings, and sports events. First, it builds snapshots, i.e., representations of the load generated by mobile users at a given instant. Then, it forms snapshot graphs G(T , E) where T contains the snapshots from the training set; it computes traffic volume and traffic distribution similarities to perform snap-shot aggregation. Finally, it uses a hierarchical clustering method into a dendrogram structure and builds network usage profile categories. Authors so show it can coarsely classify snapshots: resulting clusters are mapped to network usage profile categories.
Finally, attention is also paid to events that are not the result of social behaviors, but of natural or human-caused disasters. E.g., in [90], authors focus on emergency situations, using a dataset containing a bombing, a plane crash, a mild earthquake, and a power outage in the target region.
2.4.2 Per-app mobile traffic analysis
Up to our knowledge, in the literature, the detection of anomalies such as special events is not tackled at the app level yet. We believe that analyzing per-app usages can give valuable details about the nature of events, thus can help finely characterizing them. In the literature, attention is paid to the app usage for other purposes than special events detection [91, 92, 93, 94]. In [91], authors provide an analysis of spatiotemporal heterogeneity in nationwide app usage - they notice a large bias between apps (even within the same category, like Chat or Download) that makes the time series clustering inconclusive, and some heterogeneity even when looking to activity peaks of individual apps. Authors in [92] investigate the similarities and differences across different apps using nine features; as a result, they identify several well-differentiated clusters for each category of apps. In [93], authors design a system able to identify key patterns of cellular tower traffic by clustering custom pattern identifiers in traffic into five categories: resident, transport, office, entertainment, and comprehensive, area. They study time and frequency-domain representations for traffic modeling by analyzing interrelationships between traffic patterns and using Fourier transform. [94] provides a complete comparative evaluation of the techniques for signature classification, including Weekday-Weekend, typical week, median week, etc. Results unveil the diversity of baseline communication activities across countries, but also evidence the existence of a number of mobile traffic signatures that are common to all studied areas and specific to particular land uses.
2.4.3 Group anomaly detection
While anomaly detection typically regards data point anomalies, group anomaly detection seeks to detect anomalous collections of points. Traditionally, Seeded Region Growing (SRG) [95] has been used in image processing to form regions into which the image is segmented, by group-ing seeds (i.e., either individual pixels or regions). The Mixture of Gaussian Mixture Model (MGMM) uses topic modeling for group anomaly detection. Adaptive topics are useful in rec-ognizing point-level anomalies, but cannot be used to detect anomalous behavior at the group level. More recently, [96] studies the group anomaly detection problem by discovering anomalous aggregated behaviors of groups of points. The authors propose the Flexible Genre Model (FGM), which is able to characterize groups’ behaviors at multiple levels, contrary to traditional topic models. This detailed characterization enables the detection of various types of group anomalies. [97] performs group anomaly detection with an emphasis on irregular group distributions (e.g., irregular mixtures of image pixels). The authors formulate two deep generative models for group anomaly detection.
Other approaches specifically focus on spatiotemporal outlier detection. In [98], the au-thors review outlier detection for spatiotemporal data, among other things. Considering the temporal and spatial neighborhood for detecting outliers, they define a spatiotemporal outlier (ST-Outlier) as a spatiotemporal object whose behavioral attributes are significantly different from those of the other objects in its spatial and temporal neighborhoods. They propose a typical spatiotemporal-outlier detection pipeline, taking as input spatiotemporal data composed of: (i) processing spatiotemporal data, (ii) finding spatial objects, (iii) find spatial outliers, (iv) verify/track temporal outliers, and (v) producing spatiotemporal outliers, as existing ap-proaches commonly find spatial outliers and then verify their temporal neighborhood. Many approaches leverage clustering to compute spatial outliers [99, 100]. Others use distance-based outlier detection and Voronoi diagrams to establish spatial clusters [101].
2.5
Summary
We draw in this chapter in a synthetic yet wide-enough way the composite field of machine learning, its recurrent relationships with statistics, with a particular focus on the metrics and methods we adopt in this thesis. We provide as well a background in the three main areas of application of the exposed principles and methods to our research. In the next chapters, we further precise our three contributions in the area, positioning our work with respect to this state of the art.
Chapter 3
Detection of zero-day attacks
Last years have witnessed more and more DDoS attacks towards high-profile websites, like the Mirai botnet attack on September 2016, or more recently the memcached attack on March 2018, this time with no botnet required. These two outbreaks were not detected nor mitigated during their spreading, but only at the time they happened. Such attacks are generally preceded by several stages, including infection of hosts or device fingerprinting; being able to capture this activity would allow their early detection. In this chapter, we propose a technique for the early detection of emerging botnets and newly exploited vulnerabilities, which consists in (i) splitting the detection process over different network segments and retaining only distributed anomalies, (ii) monitoring at the port-level, with a simple yet efficient change-detection algorithm based on a modified Z-score measure. We argue how our technique, named Split-and-Merge1, can ensure
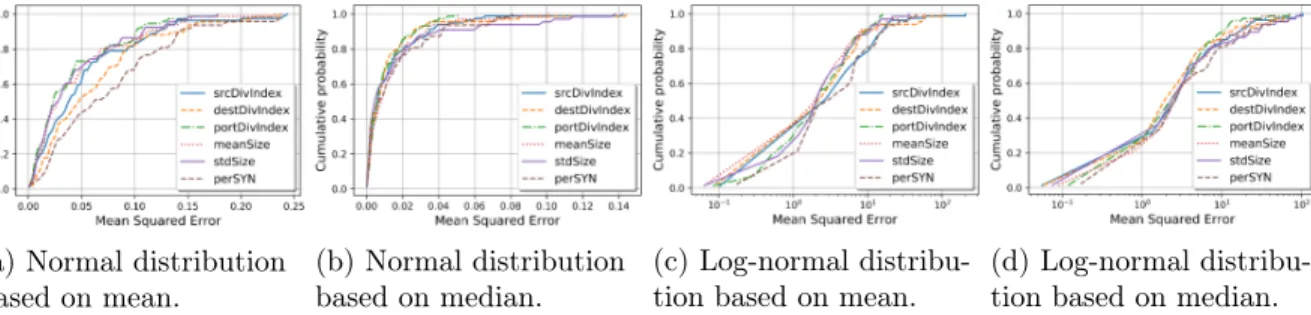
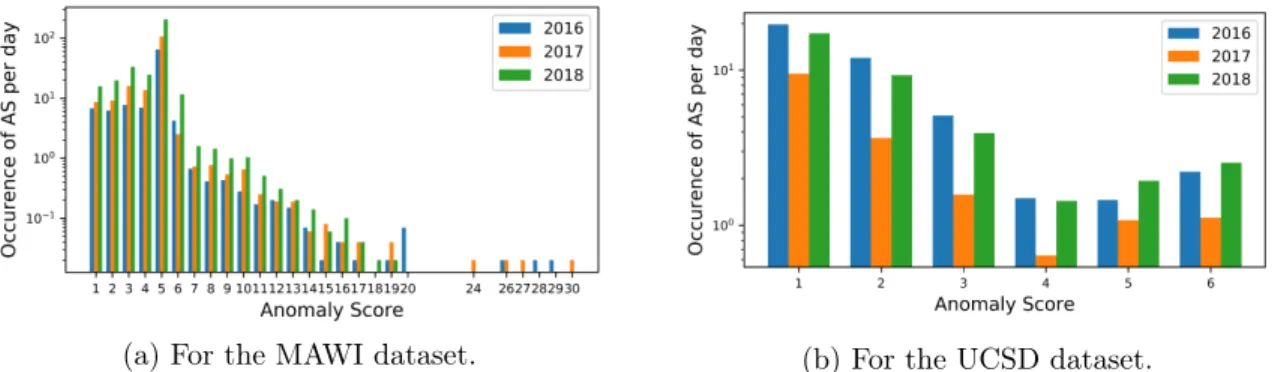
the detection of large-scale attacks and drastically reduce false positives. We apply the method on two datasets: the MAWI dataset, which provides daily traffic traces of a transpacific backbone link, and the UCSD Network Telescope dataset which contains unsolicited traffic mainly coming from botnet scans. The assumption of a normal distribution – for which the Z-score computation makes sense – is verified through empirical measures. We also show how the solution generates very few alerts; an extensive evaluation on the last three years allows identifying major attacks (including Mirai and memcached) that current Intrusion Detection Systems (IDSs) have not seen. Finally, we classify detected known and unknown anomalies to give additional insights about them.
3.1
Introduction
Back in September 2016, the Mirai botnet [2] struck the internet with a massive distributed denial of service (DDoS) attack. During several months, it spread slowly and reunited nearby 50,000 bots distributed over various parts of the internet, without being noticed. More recently, a record-breaking DDoS attack hit Github in February 2018 with a new amplification attack vector: UDP-based memcached traffic [105]. The caching system is supposed to be used internally, but sometimes runs on servers exposed without any authentication protection; several days later, most memcached servers have been patched, making the attack not efficient anymore [106]. Actually, malware targeting Internet-of-Things (IoT) devices and misconfigured servers are responsible for many Distributed Denial-of-Service (DDoS) attacks [107]. Detecting these
1This work was first presented at IFIP/IEEE IM 2019 [102], then extended for an article published in
Else-vier Computer Networks [103]. In addition, we propose in the book chapter [104] a model to simplify the detec-tion of large-scale network attacks combining data plane programming with control level collaboradetec-tion, inspired from Split-and-Merge.