Vol. 29 no. 7 2013, pages 963–964
BIOINFORMATICS
APPLICATIONS NOTE
doi:10.1093/bioinformatics/btt080Data and text mining
Advance Access publication February 15, 2013eMZed: an open source framework in Python for rapid and
interactive development of LC/MS data analysis workflows
Patrick Kiefer
1,*
,y, Uwe Schmitt
2,yand Julia A. Vorholt
11
ETH Zurich, Institute of Microbiology, 8093 Zurich, Switzerland and2mineway GmbH, 66121 Saarbru¨cken, Germany
Associate Editor: Jonathan Wren
ABSTRACT
Summary: The Python-based, open-source eMZed framework was developed for mass spectrometry (MS) users to create tailored work-flows for liquid chromatography (LC)/MS data analysis. The goal was to establish a unique framework with comprehensive basic function-alities that are easy to apply and allow for the extension and modifi-cation of the framework in a straightforward manner. eMZed supports the iterative development and prototyping of individual evaluation stra-tegies by providing a computing environment and tools for inspecting and modifying underlying LC/MS data. The framework specifically addresses non-expert programmers, as it requires only basic know-ledge of Python and relies largely on existing successful open-source software, e.g. OpenMS.
Availability: The framework eMZed and its documentation are freely available at http://emzed.biol.ethz.ch/. eMZed is published under the GPL 3.0 license, and an online discussion group is available at https:// groups.google.com/group/emzed-users.
Contact: [email protected]
Supplementary information: Supplementary data are available at Bioinformatics online.
Received on June 19, 2012; revised on February 8, 2013; accepted on February 11, 2013
1 INTRODUCTION
Liquid chromatography/mass spectrometry (LC/MS) data ana-lysis generally requires flexible software tools. Although a number of solutions for specific or multiple applications cur-rently exist, many of these belong to one of two extremes. The first group includes frameworks that are highly flexible but have been developed in languages (e.g. Cþþ) that require advanced programming skills, e.g. OpenMS (Sturm et al., 2008). Although such frameworks have a rapid application run time, the testing of new workflows and concepts is cumbersome because program-ming requirements are high, and edit-compile cycles are slow. The second group includes closed black-box solutions with graphical user interfaces that are easy to use but inherently non-transparent and inflexible, e.g. Maven (Melamud et al., 2010) and mzMine2 (Pluskal et al., 2010). Note that libraries such as the R-based XCMS (Smith et al., 2006) or the Matlab-based Bioinformatics Toolbox (Mathworks, Natick, MA, USA) lie between these extremes. The motivation to
develop eMZed was to provide an open-source framework to establish transparent and flexible workflows for high-end data treatment that requires only basic programming skills of the user. To this end, we combined the powerful and easy-to-learn programming language Python, a comprehensive library of elem-entary building blocks, and an integrated development environment.
2 RESULTS 2.1 Technical aspects
The eMZed framework is implemented in the Python program-ming language, which is well established in scientific computing (Oliphant, 2007) and bioinformatics in particular (Cock et al., 2009). Compared with R and Matlab, Python’s standard library is more extensive and enables rapid application development by various means; e.g. Python supports easy access to online ser-vices such as PubChem or Metlin, which are of great interest for metabolomics data analyses. We used the Python libraries PyQt4, spyderlib and guiqwt to build the workbench and graph-ical explorers and used numpy and scipy for the numergraph-ical data structures and algorithms.
One central concept in the development of eMZed was the integration of previously established algorithms into a single platform that minimizes error-prone import and export steps. Therefore, we integrated functionalities from the libraries XCMS and OpenMS. To call functionalities from XCMS, we built a bridge to R that enables eMZed to use the centWave feature detector (Tautenhahn et al., 2008) and ‘matched filter’ method (Smith et al., 2006). Enabling access to a subset of OpenMS functionalities for fast I/O and providing clustering-based retention time alignment (Lange et al., 2007) represented a major obstacle that was overcome by developing a code gen-erator. This generator is hosted at https://github.com/uwesch mitt/pyOpenMS and uses Cython for invoking C/Cþþ functions.
The current version of eMZed was developed and tested using 32-bit Windows 7 and was further tested using 64-bit Ubuntu 12.04 Linux. A 64-bit version for Windows is currently being developed.
2.2 Functionalities
eMZed provides simple and readily usable building blocks for rapid workflow development. In addition to data inspection, peak detection, alignment and integration, the current version possesses several dedicated helper modules that support the *To whom correspondence should be addressed.
yThe authors wish it to be known that, in their opinion, the first two
authors should be regarded as joint First Authors.
ß The Author 2013. Published by Oxford University Press.
This is an Open Access article distributed under the terms of the Creative Commons Attribution License (http://creativecommons.org/licenses/by/3.0/), which permits unrestricted reuse, distribution, and reproduction in any medium, provided the original work is properly cited.
building of graphical dialogues, statistical analyses and chemical data examinations, such as mass and isotope abundance analyses and the manipulation of molecular formulas, for example. For peak identification, access to the chemical compound database PubChem (Bolton et al., 2008) and the Metlin online service (Smith et al., 2005) is provided.
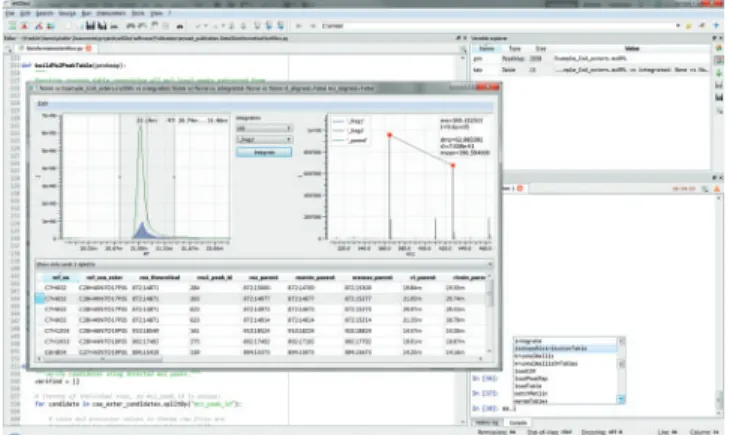
LC/MS data are handled using PeakMap and Spectrum data structures, and interactive explorer tools are linked to these data structures for visual data inspection. Table is a com-prehensive data structure supporting SQL-like operations. Tableplays a key role in eMZed workflows because it provides easy handling of peaks or chemical data and supports the iden-tification and integration of MS level 1 and level 2 peaks. Note that chromatographic peaks and spectra can also be directly visualized within Table structure (Fig. 1). In addition, Table can be edited, thereby allowing for the modification of peak and integration limits or the deletion and duplication of rows. PeakMapand Table are available in the workspace variable explorer, and interactive inspection can be integrated into work-flows to validate intermediate or final results. A complete over-view of all features can be found at the eMZed homepage.
2.3 Example application
To demonstrate the comprehensive functionalities of eMZed, we implemented a tailored workflow for the database-independent identification of coenzyme A thioesters of MS level 1 and level 2 spectra. The workflow can be subdivided into four steps:
(i) Creation of a coenzyme A ester solution space from a re-stricted recombination of chemical elements C, H, N, O, P and S.
(ii) Detection of high-resolution MS level 1 peaks using the centWave feature detector and the identification of candi-dates using the Table join operation.
(iii) Evaluation of candidates by comparing m/z values of mea-sured MS level 2 peaks with values of specific fragment ions calculated from assigned molecular formulas.
(iv) Visualization of a result table for inspection.
The given example demonstrates that even complex operations can be encoded easily owing to the multitude of functionalities that are available. A more detailed description of the workflow, the Python code and example data are provided in the Supplementary Material.
3 DISCUSSION
Metabolomics and related fields are rapidly progressing and re-quire the development and modification of workflows and ana-lytical strategies. In this context, the speed of data analysis routines is an important factor, although efforts to implement and test new solutions are equally important. To this end, eMZed provides a workspace and capability to inspect and visu-alize interim results at each step of data processing. In addition, eMZed provides a common base for developing individual ap-plications and supports interchangeable individual solutions. This approach may help to simplify the current landscape of existing LC/MS software, which is fragmented and often labora-tory specific.
4 OUTLOOK
Future work will be directed towards the implementation of new features, which, e.g. will allow for enhanced MS level 2 data handling, port eMZed to 64 bit Windows 7 operating system, better support of R and faster analysis by multi core support. These enhancements will be available in forthcoming versions of eMZed.
Funding: This project was support by ETH Zurich, Department of Biology, within the frame of an IT-strategy initiative. Complementary funding was obtained via the Swiss Initiative in Systems Biology SystemsX.ch, BattleX.
Conflict of interest: none declared.
REFERENCES
Bolton,E. et al. (2008) PubChem: integrated platform of small molecules and bio-logical activities. Annu. Rep. Comput. Chem., 4, 217–241.
Cock,P.J.A. et al. (2009) Biopython: freely available Python tools for computational molecular biology and bioinformatics. Bioinformatics, 25, 1422–1423. Lange,E. et al. (2007) A geometric approach for the alignment of liquid
chromatography-mass spectrometry data. Bioinformatics, 23, I273–I281. Melamud,E. et al. (2010) Metabolomic analysis and visualization engine for LC-MS
data. Anal. Chem., 82, 9818–9826.
Oliphant,T.E. (2007) Python for scientific computing. Comput. Sci. Eng., 9, 10–20. Pluskal,T. et al. (2010) MZmine 2: modular framework for processing, visualizing, and analyzing mass spectrometry-based molecular profile data. BMC Bioinformatics, 11, 395.
Smith,C.A. et al. (2005) METLIN - A metabolite mass spectral database. Ther. Drug Monit., 27, 747–751.
Smith,C.A. et al. (2006) XCMS: processing mass spectrometry data for metabolite profiling using nonlinear peak alignment, matching, and identification. Anal. Chem., 78, 779–787.
Sturm,M. et al. (2008) OpenMS-An open-source software framework for mass spectrometry. BMC Bioinformatics, 9, 163.
Tautenhahn,R. et al. (2008) Highly sensitive feature detection for high resolution LC/MS. BMC Bioinformatics, 9, 504.
Fig. 1. Screenshot of the eMZed workbench showing the editor, variable explorer, IPython console and interactive table explorer. The table ex-plorer shows the results of a coenzyme A ester identification workflow (see Supplementary Material). Peaks of the parent ion and integrated peaks of two fragment ions are depicted in the left plot. The right plot shows a corresponding MS level 2 spectrum that includes information on selected m/z peaks (red dots)
964