T1 hypointense lesions in secondary progressive multiple sclerosis: effect of interferon beta-1b treatment
7
0
0
Texte intégral
(2) Interferon treatment and black holes similar to that found for RR patients (Paty and Li, 1993; Li and Paty, 1999). The mechanisms that lead to relapse and MRI lesion activity may be similar in RR and SP patients, and the congruent results of interferon treatment in the two subtypes may therefore not come as a surprise. With regard to the development of disability, RR patients predominantly suffer from incomplete recovery from relapses, while SP patients, by definition, also suffer from chronic progression independently of relapses. In SP patients, the development of disability is likely to result from more pronounced progressive axonal loss, either in lesions or in the form of widespread non-focal disease. To gain further insight into the biological mechanisms underlying the slowing of progression in SP patients on IFNβ1b therapy, we evaluated the development of hypointense MRI lesions under treatment. In comparison with RR multiple sclerosis, hypointense T1 lesions are more prevalent in SP patients and correlate better with disability than hyperintense T2 lesions (Truyen et al., 1996). Data from post-mortem studies (van Waesberghe et al., 1999) and in vivo magnetic resonance spectroscopy (van Walderveen et al., 1999) indicate that lesion hypointensity is strongly correlated with axonal density, and it is thus well suited to address the rate of development of axonal loss in multiple sclerosis. In this paper we report the effect of IFNβ-1b treatment on the rate of development of hypointense lesions in SP multiple sclerosis.. 1397. whether our subset differed from the full study with regard to T2 lesion load or active lesions.. MR imaging protocol and image analysis The data used for this study comprised unenhanced T1weighted images obtained before the administration of gadolinium. All five centres operated at 1.5 T. T1-weighted images were obtained using a spin-echo sequence with a repetition time between 400 and 600 ms and echo time between 5 and 25 ms, using 5 mm slices and 1 mm in-plane resolution. To obtain a contiguous data set of 24 slices, two interleaved series of 12 slices each were acquired. On these T1-weighted images, hypointense lesions were marked using a mouse-controlled cursor on the electronic data by a single experienced observer. Lesion hypointensity was defined as a signal clearly lower than the surrounding white matter, but not necessarily lower than the grey matter. Identification of lesions was done by checking, for each lesion that was visible on a T2-weighted image, whether it was hypointense on the corresponding T1-weighted image. The observer marked all scans of a given patient consecutively in order to reduce observer variability, but without knowledge of clinical data and treatment allocation. The marked lesions were then quantified by another observer on the electronic MRI data using home-developed software based on seeding and local thresholding, and the result was multiplied by the interslice distance to obtain volumetric data; the intra-observer variation for the quantification is 5% (Truyen et al., 1996). These observers were fully blinded to the clinical data and treatment allocation.. Material and methods This study was performed in a subgroup of 95 multiple sclerosis patients participating in a large European, multicentre, randomized, double-blind, placebo-controlled trial (Polman et al., 1995; European Study Group on interferon beta-1b in secondary progressive multiple sclerosis, 1998). In brief, patients with SP multiple sclerosis were randomized to receive IFNβ-1b (Betaferon; Schering, Berlin, Germany) 8 MIU, subcutaneously on alternate days, or placebo injections. The study was approved by the Ethical Committees of the participating centres, and all patients gave informed consent. The full study included 718 patients, all of whom underwent yearly conventional T2-weighted imaging; in a subset of 125 patients from seven centres, frequent gadolinium-enhanced images were also obtained (Miller et al., 1999). In five of those centres (Amsterdam, Milan, Munich, Wu¨ rzburg and London), additional unenhanced T1weighted images were obtained at 6-month intervals to assess the development of hypointense lesions. Clinical disability was measured at 3-month intervals using the Expanded Disability Status Scale (EDSS) score by the assessing physician, who was blinded to treatment-related activities (Polman et al., 1995). The T2-weighted and gadoliniumenhanced MRI results have been reported previously (Miller et al., 1999), and we used the existing database to assess. Statistical analysis Data were entered into a database by an independent contract research organization (independent from the sponsor) and checked for consistency. Therefore, even though the analyses were performed after unblinding of the study, the analyses were performed in a strictly blinded fashion. Statistical analyses were performed for both absolute and percentage changes in hypointense lesion load compared with baseline. Analyses include all patients with data available at baseline and at least once during treatment. All data available at any given point in time were evaluated with missing data maintained as missing. In additional analyses, missing data were imputed by linear interpolation; because these yielded the same results, only data without replacement are presented in this report. Furthermore, changes in hypointense lesion load at individual last visits (last scan available) were evaluated. Comparisons of baseline data between groups were performed using the Wilcoxon rank-sum test and Fisher’s exact test. To assess changes in hypointense lesion load from baseline within treatment groups, the paired t test was used. Comparisons between groups were performed using nonparametric analysis of covariance with stratification.
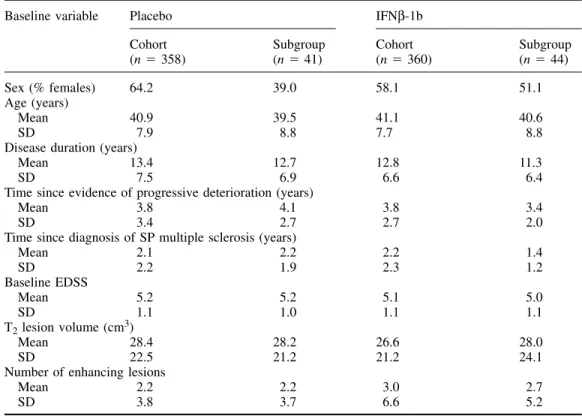
(3) 1398. F. Barkhof et al. Table 1 Baseline demographic and disease characteristics of cohort as a whole (n ⫽ 718) and the subgroup evaluated for T1 hypointense lesions (n ⫽ 85) Baseline variable. Placebo Cohort (n ⫽ 358). IFNβ-1b Subgroup (n ⫽ 41). Sex (% females) 64.2 39.0 Age (years) Mean 40.9 39.5 SD 7.9 8.8 Disease duration (years) Mean 13.4 12.7 SD 7.5 6.9 Time since evidence of progressive deterioration (years) Mean 3.8 4.1 SD 3.4 2.7 Time since diagnosis of SP multiple sclerosis (years) Mean 2.1 2.2 SD 2.2 1.9 Baseline EDSS Mean 5.2 5.2 SD 1.1 1.0 T2 lesion volume (cm3) Mean 28.4 28.2 SD 22.5 21.2 Number of enhancing lesions Mean 2.2 2.2 SD 3.8 3.7. adjustment for centre and covariance adjustment for baseline lesion load. To assess the association between T1 hypointense lesion load and EDSS, non-parametric (Goodman–Kruskal) correlation coefficients were calculated; because we assumed that changes in data for month 6 may have been confounded by temporary hypointense lesions (and minor fluctuations in EDSS), assessments were correlated from month 12 onwards.. Results For seven patients no valid T1 data were available and for three others the baseline value was missing, leaving 85 valid cases for analysis, 41 on placebo, 44 on IFNβ-1b. Table 1 shows that the demographics and baseline descriptive findings of those patients were similar to those of the total study population, indicating that no major selection bias had occurred. Also, none of the baseline descriptive data differed between placebo and verum at the 5% significance level. For T2 lesion load, there was a median increase of 4.19 cm3 (17.5%) at month 36 in the placebo group, whereas the IFNβ1b group showed a median decrease of 0.35 (4.0%) at month 36 (P ⬍ 0.0001 between groups). At month 36, the median cumulative number of new or enlarged lesions on T2-weighted images was 7 in the placebo group and 1 in the IFNβ-1b group (P ⫽ 0.038). Similarly, highly significant differences favouring the IFNβ-1b group were seen in the numbers of enhancing lesions during the monthly scanning blocks for months 1–6 and 19–24 (P ⬍ 0.0005 between groups for both periods). All these data are consistent with. Cohort (n ⫽ 360). Subgroup (n ⫽ 44). 58.1. 51.1. 41.1 7.7. 40.6 8.8. 12.8 6.6. 11.3 6.4. 3.8 2.7. 3.4 2.0. 2.2 2.3. 1.4 1.2. 5.1 1.1. 5.0 1.1. 26.6 21.2. 28.0 24.1. 3.0 6.6. 2.7 5.2. the analysis performed on the full data set (European Study Group on interferon beta-1b in secondary progressive multiple sclerosis, 1998). The median baseline lesion load for hypointense T1 lesions was 5.1 cm3 for the placebo group and 4.9 cm3 for the IFNβ1b patients (P ⫽ 0.56). Both arms showed a linear increase in lesion load across time (Table 2). In the placebo-treated patients, this increase was significant from month 6 onwards; by month 36 they had increased their T1 lesion load by a median value of 2.43 cm3, corresponding to a median change from baseline of 41.8% (P ⫽ 0.0002 compared with baseline), with an average an increase of 14% per annum (Fig. 1). The IFNβ-1b patients also showed a linear increase from baseline, which became statistically significant at month 18 for the first time, and by month 36 the median increase in lesion load was 0.76 cm3, corresponding to a median change from baseline of 23.2% (P ⫽ 0.006), with an average increase of 7.7% per annum. The rate of increase in T1 hypointense lesion load was significantly slower in the IFNβ-1b treated patients than in the placebo-treated group (P ⫽ 0.0003). This was also true when individual last-scan data were analysed (P ⫽ 0.0001, adjusted value for treatment effect between groups). The correlations between absolute change in T1 lesion load and EDSS are reported in Table 3. For the whole group, there was a positive correlation (r ⫽ 0.28 at month 36, P ⫽ 0.007). Within the individual arms, the correlations were weak in the placebo arm, whereas statistically significant correlations were found in the IFNβ-1b arm from month 12.
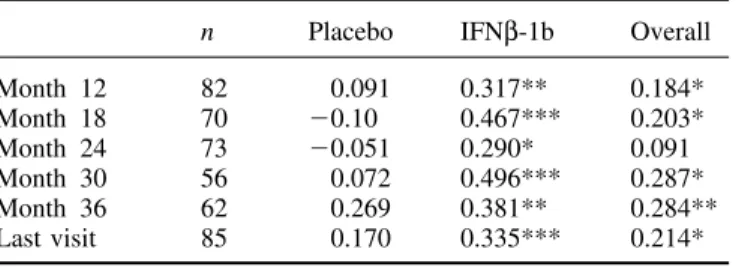
(4) Interferon treatment and black holes Table 2 Hypointense lesion load: baseline findings and percentage change from baseline. Baseline volume n Mean (SD) Median Percentage change Month 6 n Mean (SD) Median P† Month 12 n Mean (SD) Median P† Month 18 n Mean (SD) Median P† Month 24 n Mean (SD) Median P† Month 30 n Mean Median P† Month 36 n Mean Median P† Last visit n Mean (SD) Median P†. Placebo. IFNβ-1b. 41 8.9 (8.1) 5.1. 44 7.8 (8.3) 4.9. Table 3 Correlations (r) between change in T1 hypointense lesion load and EDSS. P*. 0.5586‡. from baseline volume. 1399. Month 12 Month 18 Month 24 Month 30 Month 36 Last visit. n. Placebo. IFNβ-1b. Overall. 82 70 73 56 62 85. 0.091 ⫺0.10 ⫺0.051 0.072 0.269 0.170. 0.317** 0.467*** 0.290* 0.496*** 0.381** 0.335***. 0.184* 0.203* 0.091 0.287* 0.284** 0.214*. *P ⬍ 0.05; **P ⬍ 0.01; ***P ⬍ 0.001.. 39 16.6 (40.2) 9.0 0.0140. 43 2.7 (18.6) 2.2 0.3457. 0.0943. 39 19.5 (29.5) 11.1 0.0002. 43 2.5 (22.9) 2.7 0.4718. 0.0064. 34 28.8 (34.9) 24.2 ⬍0.0001. 39 8.7 (26.4) 8.5 0.0474. 0.0108. 34 35.6 (43.0) 29.5 ⬍0.0168. 41 12.3 (31.6) 9.6 0.0168. 0.0009. 26 52.4 (54.1) 39.1 ⬍0.0001. 30 8.0 (32.1) 13.9 0.1850. 0.0002. 29 60.0 (78.0) 41.8 0.0002. 37 17.4 (36.5) 23.2 0.0063. 0.0003. 41 57.5 (70.8) 38.6 ⬍0.0001. 44 14.9 (35.1) 19.5 0.0075. 0.0001. onwards (r ⫽ 0.38 at month 36, P ⫽ 0.002). In the same subgroup of patients, no significant correlations were detected between EDSS and T2 lesion load (not tabulated), with a maximum correlation of 0.16 for the IFNβ-1b arm after 3 years (P ⫽ 0.19).. Discussion. *Non-parametric analysis of covariance with stratification adjustment for centre and covariance adjustment for baseline hypointense T1 lesion load; †t test for significance of within group change from baseline; ‡Wilcoxon rank-sum test for comparison between groups.. Fig. 1 Median percentage change in hypointense T1-lesion load from baseline. M ⫽ month.. Traditionally, MRI measures used in treatment trials include the number of active (e.g. gadolinium-enhancing or new T2) lesions and changes in T2 lesion load. The behaviour of these MRI measures has been fairly well established, and they provide high statistical power in detecting anti-inflammatory treatment effects (Sormani et al., 1999; Molyneux et al., 2000a). MRI-monitored interferon-beta studies have systematically shown dramatic treatment effects on active lesions and T2 lesion load, typically with a dose–effect relationship (Paty and Li, 1993; Multiple Sclerosis Collaborative Research Group, 1996; Li and Paty, 1999; Miller et al., 1999). On the basis of these and other results, an ad hoc committee of the National Multiple Sclerosis Society of the USA decided to advocate the use of MRI measures as a primary outcome measure in exploratory (phase II) trials (Miller et al., 1996). However, given the uncertain relationship between changes in MRI and clinical parameters over time, it also recommended that MRI should only be used as a secondary outcome measure in definitive (phase III) trials (Miller et al., 1996). There are many problems in detecting a relationship between MRI measures and clinical status. Apart from problems with clinical scales, the location of lesions and the duration of follow-up, the lack of histopathological specificity beyond the inflammatory stage (identified by gadolinium enhancement) is a major weakness of MRI. On T2-weighted images, almost any alteration in brain tissue composition will lead to increased signal, including oedema, partial demyelination, gliosis and axonal loss. There is evidence that even remyelinated lesions may return high signal on these T2-weighted images (’t Hart et al., 1998; van Walderveen et al., 1998). This could explain the poor correlation with clinical disability, which is likely to be determined mainly by axonal loss. There are several magnetic resonance techniques with improved histopathological specificity, including magnetic resonance spectroscopy, magnetization.
(5) 1400. F. Barkhof et al.. transfer and T1 hypointensity. In this study we evaluated the effect of IFNβ-1b treatment on T1 hypointensity as a marker of matrix destruction and axonal loss in progressive multiple sclerosis (van Walderveen et al., 1998, 1999; van Waesberghe et al., 1999). The subset of patients presented here is comparable with the full data set (European Study Group on interferon beta-1b in secondary progressive multiple sclerosis, 1998), indicating that no significant selection bias occurred and that the treatment arms were well matched. Valid T1 data were available for the vast majority of patients. The T1 lesion load at baseline was slightly higher than in an earlier study on the natural history of multiple sclerosis (Truyen et al., 1996), in which a median volume of 3.0 cm3 was reported for SP multiple sclerosis patients, who progressed to 4.15 cm3 after an average of 3.5 years. The increase of 12% per annum in that natural course study is similar to the increase in lesion load in the placebo arm of the present study (42% over 3 years). The finding of an expected pattern of behaviour in the placebo arm is an essential element in the interpretation of randomized controlled trials (Li and Paty, 1999). In studies of SP multiple sclerosis, the increase in T1 hypointense lesion load may seem large with respect to the increase in T2 lesion load (Truyen et al., 1996); in our study the median increase in T1 hypointense lesion load was 2.43 cm3, while the T2 hyperintense lesion load increased by a median of 4.19 cm3. This may reflect three phenomena. First, the net change in lesion load is derived from an increase by new lesions and shrinkage by others (Lee et al., 1998), a phenomenon that is much less plausible for T1 hypointense lesions. Secondly, progressive damage in pre-existing lesions has been demonstrated (Rocca et al., 1999), suggesting that ongoing axonal damage may occur in pre-existing lesions, especially in patients with SP multiple sclerosis, which may eventually lead to hypointensity on T1-weighted SE images. Lastly, the relatively small lesion load at baseline compared with the T2-hyperintense lesion load may influence the increase in T1 hypointense lesion load, expressed as a percentage. The latter phenomenon may also explain the findings in patients with RR multiple sclerosis, with a yearly increase of 14.5% per year (Simon et al., 2000), the low lesion load at baseline (median 0.64 cm3) providing a small denominator. In the IFNβ-1b-treated arm, the increase in T1 lesion load was significantly lower than in the placebo arm (P ⫽ 0.0003), with a 45% reduction in the increase in T1 hypointense lesion load. This is the first parallel-design controlled study to demonstrate a therapeutic effect on this MRI parameter in SP multiple sclerosis patients. An effect on the development of hypointense lesions has also been noted in a phase II trial of interferon alpha-1a in RR multiple sclerosis, in which patients served as their own controls (Gasperini et al., 1999). In this phase II study, a lower percentage of new lesions on T2-weighted images with persistent hypointensity on T1weighted images was suggested (Paolillo et al., 1999a). A phase III trial with interferon alpha-1a failed to find a. significant treatment effect, even though a clear trend was suggested (Simon et al., 2000). Both post-mortem MRI data (van Waesberghe et al., 1999) and in vivo magnetic resonance spectroscopy data (van Walderveen et al., 1999; Brex et al., 2000) indicate that the degree of T1 hypointensity relates to the amount of axonal damage (resulting in widening of extracellular space, with more free, slowly relaxing water). The smaller increase in T1 hypointense lesion load in the IFNβ-1b group in our SP multiple sclerosis study indicates less progression of axonal loss in lesions. As axonal loss is the most likely correlate of clinical progression, our findings are comparable with the moderate clinical effect of 40% reduction in time to progression (12 months delay after a median time on study of 18 months (European Study Group on interferon beta1b in secondary progressive multiple sclerosis, 1998). The causality between these two measures is suggested by the finding of positive correlation coefficients in the IFNβ-1b arm; the absence of similar correlations in the placebo arm could be explained by more relapse-related changes in disability. The fact that even in the IFNβ-1b arm the correlations are still modest indicates that other mechanisms leading to disability (e.g. diffuse disease leading to atrophy) may still be at play. The 45% reduction in development in T1 hypointense lesions is closer to the clinical effect size than the enormous effect seen on T2 lesion load; the latter even showed a slight decrease in lesion load in the IFNβ-1b arm after 3 years (Miller et al., 1999). The overestimation of the treatment effect on T2 lesion load relates to an initial decrease in lesion load, which has been a consistent finding in previous interferon studies (Paty and Li, 1993; Li and Paty, 1999) . This probably reflects the resolution of oedematous and inflammatory changes caused by active lesions present at baseline, and the subsequent increase in T2 lesion load during the trial is too small to offset this initial dip. A similar phenomenon is not detectable for the development of T1 hypointensity using this 6-monthly analysis, even though monthly studies have noted that a percentage of lesions may become hypointense initially (van Waesberghe et al., 1998; Rovira et al., 1999). However, the vast majority of the temporary hypointense lesions revert to isointensity after 1 or 2 months, which probably explains why lesion load measurements of unenhanced and gadolinium-enhanced images (where acutely hypointense lesions are masked by their enhancement) show an extremely high correlation (O’Riordan et al., 1998). Therefore, in this study, with a low sampling rate (relative to the duration of enhancement and oedema of new multiple sclerosis lesions), we are confident that the increase in hypointense lesions measured in this study was not due to temporary hypointensity (with marked oedema), but rather to the development of chronic ‘black holes’ (with axonal loss). Previous studies in SP multiple sclerosis have shown a relationship between change in the T1 hypointense load and the rate of atrophy (Paolillo et al., 1999b). The fact that such.
(6) Interferon treatment and black holes measures are correlated indicates that both are (indirect) measures of axonal damage. On the other hand, the correlations are far from perfect, indicating that severe tissue damage in lesions (i.e. black holes) and overall cerebral tissue loss are not invariably linked. This partial independence may also account for the disparate effect of INFβ-1b on a measure of cerebral volume in the same trial with SP multiple sclerosis patients (Molyneux et al., 2000b). In that study, a progressive decrease in cerebral volume was noted in both placebo- and interferon-treated patients, with no clear treatment effect. The partial effect on T1 hypointense lesions in the absence of a clear effect on cerebral volume loss indicates that, in this group of SP multiple sclerosis patients, axonal loss may progress to a certain extent. Similar uncoupling has been noted with other immunomodulatory drugs that have a clear effect on gadolinium enhancement, but no effect on T1 hypointense lesion load and atrophy (Coles et al. 1999; Filippi et al., 2000). In conclusion, this is the first phase III trial to show a beneficial effect of IFNβ-1b on the development of T1 hypointense lesion load, a marker of axonal loss in the lesions of SP multiple sclerosis.. Acknowledgement This study was sponsored by Schering AG, Berlin, Germany.. 1401. Prevention of relapses and disability by interferon-beta1a subcutaneously in multiple sclerosis. Ann Neurol 1999; 46: 197–206. Miller DH, Albert PS, Barkhof F, Francis G, Frank JA, Hodgkinson S, et al. Guidelines for the use of magnetic resonance techniques in monitoring the treatment of multiple sclerosis. US National MS Society Task Force. Ann Neurol 1996; 39: 6–16. Miller DH, Molyneux PD, Barker GJ, MacManus DG, Moseley IF, Wagner K. Effect of interferon-beta1b on magnetic resonance imaging outcomes in secondary progressive multiple sclerosis: results of a European multicenter, randomized, double-blind, placebo-controlled trial. European Study Group on Interferon-beta1b in secondary progressive multiple sclerosis. Ann Neurol 1999; 46: 850–9. Molyneux PD, Miller DH, Filippi M, Yousry T, Kappos L, Gasperini C, et al. The use of magnetic resonance imaging in multiple sclerosis treatment trials: power calculations for annual lesion load measurement. J Neurol 2000a; 247: 34–40. Molyneux PD, Kappos L, Polman C, Pozzilli C, Barkhof F, Filippi M, et al. The effect of interferon beta-1b treatment on MRI measures of cerebral atrophy in secondary progressive multiple sclerosis. Brain 2000b; 123: 2256–63. Multiple Sclerosis Collaborative Research Group. Intramuscular interferon beta-1a for disease progression in relapsing multiple sclerosis. Ann Neurol 1996; 39: 285–94. O’Riordan JI, Gawne Cain M, Coles A, Wang L, Compston DA, Tofts P, et al. T1 hypointense lesion load in secondary progressive multiple sclerosis: a comparison of pre versus post contrast loads and of manual versus semi-automated threshold techniques for lesion segmentation. Mult Scler 1998; 4: 408–12.. References Brex PA, Parker GJ, Leary SM, Molyneux PD, Barker GJ, Davie CA, et al. Lesion heterogeneity in multiple sclerosis: a study of the relations between appearances on T1-weighted images, T1 relaxation times, and metabolite concentrations. J Neurol Neurosurg Psychiatry 2000; 68: 627–32.. Paolillo A, Bastianello S, Frontoni M, Gasperini C, Giugni E, Ciccarelli O, et al. Magnetic resonance imaging outcome of new enhancing lesions in relapsing-remitting multiple sclerosis patients treated with interferon beta1a. J Neurol 1999a; 246: 443–8.. Coles AJ, Wing MG, Molyneux P, Paolillo A, Davie CM, Hale G, et al. Monoclonal antibody treatment exposes three mechanisms underlying the clinical course of multiple sclerosis. Ann Neurol 1999; 46: 296–304.. Paolillo A, Coles AJ, Molyneux PD, Gawne-Cain M, MacManus D, Barker GJ, et al. Quantitative MRI in patients with secondary progressive MS treated with monoclonal antibody Campath 1H. Neurology 1999b; 53: 751–7.. European Study Group on interferon beta-1b in secondary progressive MS. Placebo-controlled multicentre randomised trial of interferon beta-1b in treatment of secondary progressive multiple sclerosis. Lancet 1998; 352: 1491–7.. Paty DW, Li DK. Interferon beta-1b is effective in relapsingremitting multiple sclerosis. II. MRI analysis results of a multicenter, randomized, double-blind, placebo-controlled trial. UBC MS/MRI Study Group and the IFNB Multiple Sclerosis Study Group. Neurology 1993; 43: 662–7.. Filippi M, Rovaris M, Rice GP, Sormani MP, Iannucci G, Giacomotti L, et al. The effect of cladribine on T(1) ‘black hole’ changes in progressive MS. J Neurol Sci 2000; 176: 42–4. Gasperini C, Pozzilli C, Bastianello S, Giugni E, Horsfield MA, Koudriavtseva T, et al. Interferon-beta-1a in relapsing–remitting multiple sclerosis: effect on hypointense lesion volume on T1 weighted images. J Neurol Neurosurg Psychiatry 1999; 67: 579–84. Lee MA, Smith S, Palace J, Matthews PM. Defining multiple sclerosis disease activity using MRI T2-weighted difference imaging. Brain 1998; 121: 2095–102. Li DK, Paty DW. Magnetic resonance imaging results of the PRISMS trial: a randomized, double-blind, placebo-controlled study of interferon-beta1a in relapsing–remitting multiple sclerosis.. Polman CH, Dahlke F, Thompson AJ, Ghazi M, Kappos L, Miltenburger C, et al. Interferon beta-1b in secondary progressive multiple sclerosis—outline of the clinical trial. Mult Scler 1995; 1 Suppl 1: S51–4. Rocca MA, Mastronardo G, Rodegher M, Comi G, Filippi M. Longterm changes of magnetization transfer-derived measures from patients with relapsing–remitting and secondary progressive multiple sclerosis. AJNR Am J Neuroradiol 1999; 20: 821–7. Rovira A, Alonso J, Cucurella G, Nos C, Tintore M, Pedraza S, Rio J, et al. Evolution of multiple sclerosis lesions on serial contrastenhanced T1-weighted and magnetization-transfer MR images. AJNR Am J Neuroradiol 1999; 20: 1939–45..
(7) 1402. F. Barkhof et al.. Simon JH, Lull J, Jacobs LD, Rudick RA, Cookfair OL, Herndon RM et al. A longitudinal study of T1 hypointense lesions in relapsing MS: MSCRG trial of interferon beta-1a. Neurology 2000; 55: 185–92.. P, Lycklama a` Nijeholt GJ, Polman CH, et al. Patterns of lesion development in multiple sclerosis: longitudinal observations with T1-weighted spin-echo and magnetization transfer MR. AJNR Am J Neuroradiol 1998; 19: 675–83.. Sormani MP, Molyneux PD, Gasperini C, Barkhof F, Yousry TA, Miller DH, et al. Statistical power of MRI monitored trials in multiple sclerosis: new data and comparison with previous results. J Neurol Neurosurg Psychiatry 1999; 66: 465–9.. van Waesberghe JH, Kamphorst W, De Groot CJ, van Walderveen MA, Castelijns JA, Ravid R, et al. Axonal loss in multiple sclerosis lesions: magnetic resonance imaging insights into substrates of disability. Ann Neurol 1999; 46: 747–54.. ’t Hart BA, Bauer J, Muller HJ, Melchers B, Nicolay K, Brok H, et al. Histopathological characterization of magnetic resonance imaging-detectable brain white matter lesions in a primate model of multiple sclerosis: a correlative study in the experimental autoimmune encephalomyelitis model in common marmosets (Callithrix jacchus). Am J Pathol 1998; 153: 649–63.. van Walderveen MA, Barkhof F, Pouwels PJ, van Schijndel RA, Polman CH, Castelijns JA. Neuronal damage in T1 hypointense multiple sclerosis lesions demonstrated in vivo using proton magnetic resonance spectroscopy. Ann Neurol 1999; 46: 79–87.. Truyen L, van Waesberghe JH, van Walderveen MA, van Oosten BW, Polman CH, Hommes OR, et al. Accumulation of hypointense lesions (‘black holes’) on T1 spin-echo MRI correlates with disease progression in multiple sclerosis. Neurology 1996; 47: 1469–76. van Waesberghe JH, van Walderveen MA, Castelijns JA, Scheltens. Appendix I List of investigators Amsterdam: C. Polman, J. Valk, F. Barkhof, J. H. van Waesberghe and T. Schweigmann. London: D. Miller, I. F. Mosely, P. Molyneux, P. Brex, D. MacManus. Milan: G. Comi, M. Filippi and M. Rovaris. Munich: R. Hohlfeld, T. A. Yousry, C. Becker, F. Stadie and P. Eppmann. Wu¨ rzburg: R. Gold, H.-P. Hartung, D. Hahn, W. Kenn and T. Pabst. MRI Central Evaluation: Image Analysis Center, Amsterdam F. Barkhof, J. H. T. M. van Waesberghe, J. Seebus, M. de Vos and L. Bergers.. van Walderveen MA, Kamphorst W, Scheltens P, van Waesberghe JH, Ravid R, Valk J, et al. Histopathologic correlate of hypointense lesions on T1-weighted spin-echo MRI in multiple sclerosis. Neurology 1998; 50: 1282–8.. Received March 6, 2000. Revised January 29, 2001. Accepted February 27, 2001. Steering Committee C. H. Polman, L. Kappos, A. J. Thompson, C. Pozzilli, F. Dahlke, M. Ghazi and K. Wagner (Schering AG).. Independent Advisory Board H. McFarland (Chairman), J. Petkau (Statistical Advisor), O. Sabouraud and K. Toyka.. Statistician K. Beckmann (Schering AG)..
(8)
Figure
Documents relatifs
