Thermal and Mechanical Responses Resulting From Spatial and Temporal Snow
Cover Variability in Permafrost Rock Slopes, Steintaelli, Swiss Alps
Daniel Draebing,1,2†Anna Haberkorn,3,4*†Michael Krautblatter,1Robert Kenner3and Marcia Phillips3 1
Faculty of Civil, Geo and Environmental Engineering, Technische Universität München, Munich, Germany
2
Department of Geography, University of Bonn, Bonn, Germany
3
WSL Institute for Snow and Avalanche Research SLF, Davos, Switzerland
4
Department of Geosciences, Unit of Geography, University of Fribourg, Fribourg, Switzerland
ABSTRACT
The aim of this study is to investigate the influence of snow on permafrost and rock stability at the Steintaelli (Swiss Alps). Snow depth distribution was observed using terrestrial laser scanning and time-lapse photography. The influence of snow on the rock thermal regime was investigated using near-surface rock temperature measurements, seismic refraction tomography and one-dimensional thermal modelling. Rock kinematics were recorded with crackmeters. The distribution of snow depth was strongly determined by rock slope micro-topography. Snow accumulated to thicknesses of up to 3.8 m on less steep rock slopes (<50°) and ledges, gradually covering steeper (up to 75°) slopes above. A perennial snow cornice at the flat ridge, as well as the long-lasting snow cover in shaded, gently inclined areas, prevented deep active-layer thaw, while patchy snow cover resulted in a deeper active-layer beneath steep rock slopes. The rock mechanical regime was also snow-controlled. During snow-free periods, high-frequency thermal expansion and contraction occurred. Rock temperature locally dropped to -10 °C, resulting in thermal contraction of the rock slopes. Snow cover insulation maintained temperatures in the frost-cracking window and favoured ice segregation. Daily thermal-induced and seasonal ice-induced fracture kinematics were dominant, and their repetitive occurrence destabilises the rock slope and can potentially lead to failure.
KEY WORDS: snow cover; rock permafrost; rock wall stability; thermal processes; one-dimensional thermal modelling; seismic refraction tomography
INTRODUCTION
The interactions between the atmosphere, snow cover, permafrost and rock mechanical properties in steep slopes are complex and poorly understood. The reaction of Alpine rock walls to significant warming over the last three decades is expressed by rapid active-layer (AL) thickening and permafrost degradation (Gruber et al., 2004a; Fischer et al., 2006; Ravanel et al., 2013). Frozen rock walls are destabilised due to the mechanical effects of changing ice and bedrock temperatures, which can lead to rock slope failure (Davies et al., 2001; Krautblatter et al., 2013).
Spatial and temporal variations in snow depth strongly in-fluence the ground thermal regime in alpine environments (Keller and Gubler, 1993; Bernhard et al., 1998; Luetschg et al., 2004). Snow leads to an increase in the surface albedo and longwave emissivity, and high energy consumption during snowmelt (Keller and Gubler, 1993; Zhang et al., 2001). The initial timing and depth of the snow cover, its mean depth and the date of disappearance critically in flu-ence the thermal regime of the ground (Hoelzle et al., 2003; Zhang, 2005; Luetschg et al., 2008) and control the absence or presence of permafrost. The early onset of a thick, long-lasting snow cover exceeding 0.2–0.6 m (Keller and Gubler, 1993; Hanson and Hoelzle, 2004; Haberkorn et al., 2015a) can reduce the freezing of the AL by insulat-ing the ground from cold atmospheric conditions in winter and delay the thawing of the AL in spring and summer (Hoelzle et al., 2003). In contrast, shallow snow depths< 0.15 m allow pronounced ground surface cooling
* Correspondence to: A. Haberkorn, WSL Institute for Snow and Avalanche Research SLF, Flüelastrasse 11, 7260 Davos, Switzerland. E-mail: [email protected]
†D. Draebing and A. Haberkorn are co-first authors.
http://doc.rero.ch
Published in "Permafrost and Periglacial Processes 28(1): 140–157, 2017"
which should be cited to refer to this work.
in response to low air temperatures (Keller and Gubler, 1993; Luetschg et al., 2008).
In steep, rugged rock walls, snow depth measurements using terrestrial laser scanning (TLS) confirm that up to 2 m of snow can accumulate on slopes steeper than 75°, due to complex micro-topography (Wirz et al., 2011). Here, the heterogeneously distributed snow cover causes spatially variable ground temperatures (Stocker-Mittaz et al., 2002). Annually, a thick, insulating and long-lasting snow cover smooths differences in rock surface temperatures between steep north- and south-facing rock slopes (Haberkorn et al., 2015a, 2015b; Magnin et al., 2015). In contrast, at locations lacking snow, different aspects induce large daily and annual temperature differences (Gruber et al., 2004b; Hasler et al., 2011a).
In rock walls, the evolution of the snow cover in flu-ences ground heat fluxes (Draebing et al., 2014). Both conduction in intact rock and convective heat flux along fractures (Moore et al., 2011) occur during snow-free pe-riods, whilst conduction presumably dominates during snow-covered periods. During snowmelt or heavy rainfall events, water percolating along fractures may cause signif-icant advective heat transport (Gruber and Haeberli, 2007; Scherler et al., 2010).
In addition to thermal processes, ice in joints (Krautblatter et al., 2013) and water percolating in fractures alter the mechanical properties of rock walls (Hasler et al., 2011b). Krautblatter et al. (2013) analysed the impact of degrading permafrost: permafrost warming or thaw decreases shear resistance of the rock wall while hydrostatic pressure due to snowmelt (Blikra and Christiansen, 2014), cryostatic pressure due to volumetric expansion of ice (Matsuoka and Murton, 2008) and ice segregation (Murton et al., 2006) increase shear forces. Seasonally, snowmelt may increase hydrostatic pressure in early summer and AL freezing in autumn may increase cryostatic pressure, both of which may cause rock movements (Draebing et al., 2014). However, snowmelt infiltration can sometimes be prevented by an impermeable basal ice layer (Phillips et al., 2016).
In this study, we investigate the effects of the unevenly distributed snow cover on the ground thermal regime, and the mechanical response of the steep, fractured permafrost rock slopes at Steintaelli, Switzerland. The Steintaelli is a unique mountain permafrostfield site, where unstable rock conditions prior to and initiating failure can be observed and monitored. We identify topographic influences on the spatial and temporal snow depth distribution using TLS and automatic photographs. The effects of the snow cover on the rock thermal regime close to the surface are quanti-fied using continuous near-surface rock temperature (NSRT) measurements at 0.1 m depth. To assess the in flu-ence of ground temperature variations on rock mechanical properties, seismic refraction tomography (SRT) was car-ried out annually, complemented by one-dimensional (1D) continuous rock temperature modelling. The mechanical response of the rock walls was monitored continuously with crackmeters.
RESEARCH AREA
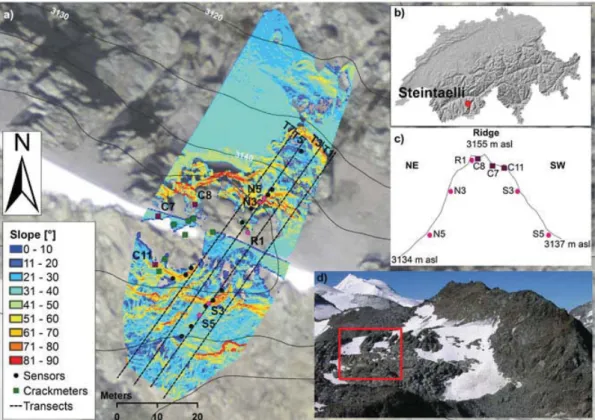
The Steintaelli (46°11’12.62"N; 7°44’20.87"E) is a north-west to south-east-oriented ridge, located on the crest be-tween the Matter and Turtmann valleys (3050–3150 m asl) at the Alpine main divide of the western Swiss Alps (Figure 1). The 50 m long north-east (NE) and south-west (SW)-oriented study slopes consist of schistous and slaty paragneiss and generally have a mean angle of 35°, with some steep sectors (>70°). The whole catchment area was covered by the NE Rothorn glacier in the Little Ice Age (Krautblatter and Hauck, 2007). Remnants of the glacier re-main at the foot of the SW slope (Figure 1d). The investi-gated rock slopes have been ice-free for approximately 100 years, leading to rock block sliding. This has led to the formation of a double ridge and a depression at the top of the slope, resulting from the deformation as part of paraglacial adjustment (Krautblatter, 2009). Although rock stability analyses (without considering ice and permafrost effects) using the Geological Strength Index (Hoek and Brown, 1997) and the Total Friction Concept including the Joint Roughness Coefficient (Barton and Choubey, 1977) indicate rock stability, the Steintaelli rock slopes have seven fracture sets and display instability due to active crack opening and closing. This is due to the occurrence of deep ice-filled fractures with a fracture aperture width between 0.1 and 1.0 m intersecting the rock slope (Halla, 2013).
Geophysical methods indicate the occurrence of perma-frost in the NE-facing slope, while permaperma-frost is absent in the SW-facing rock slope (Krautblatter and Draebing, 2014). Active-layer thickness (ALT), monitored using elec-tric resistivity tomography and SRT, ranged between 0 and 10 m in the NE slope between 2005 and 2007 (Krautblatter and Hauck, 2007; Krautblatter and Draebing, 2014). The mean annual air temperature at Steintaelli was -3.2 °C for the study period, from 1 September 2012 to 31 August 2014. The 30 year average (1981–2010) annual precipita-tion at Steintaelli and its surroundings ranges between 900 and 1100 mm a-1(MeteoSwiss).
METHODS
The methods used to monitor the meteorological conditions, snow cover, thermal regime and mechanical response of the rock slopes between August 2012 and September 2014 are summarised in Figure 2.
Meteorological Data
Meteorological data from 1 September 2012 to 31 August 2014 were obtained from the Swiss Intercantonal Measurement and Information System (IMIS) automatic weather station (AWS) Oberer Stelligletscher (46° 10’48"N; 7°45’0"E; 2910 m asl), 2.2 km south-east of Steintaelli. To set the air temperature evolution during the investigation period in a long-term meteorological context,
we compared annual and monthly means of air temperature measured for the years 2012–13 and 2013–14 at the IMIS Oberer Stelligletscher to a 12 year annual and monthly average of air temperature for the reference period 2000–2012.
Continuous snow depth data measured at the IMIS Oberer Stelligletscher were used to visualise the general pattern of snow cover development during the two winters,
althoughflat-field snow depth measurements cannot be used to estimate catchment-wide snow amounts accurately (Grünewald and Lehning, 2011). Since liquid precipitation data are not available at the IMIS Oberer Stelligletscher, long-term liquid precipitation data (1981–2010) were ob-tained from the nearby, but significantly lower MeteoSwiss AWS Grächen (1617 m asl, 8 km east of Steintaelli). Local precipitation patterns were assumed to resemble those at Figure 1 Overview of the Steintaelli study site: (a) Slope angles based on TLS data. Black dots indicate the NSRT sensors, green squares the crackmeters and
black, dashed lines the SRT transects (T1, T3, T5 and T7). Locations discussed in detail are marked as pink dots (NSRT sensors) and purple squares (crackmeters) (map data: swissimage©2015 swisstopo 5704 000 000). (b) Location of Steintaelli in the Valais Alps, Switzerland (map data: DHM L2©2015
swisstopo 5704 000 000). (c) Cross-section of Steintaelli showing the NE and SW faces and the locations discussed in detail. (d) The NE-facing slope of Steintaelli (photograph: M. Krautblatter). The study area is surrounded by a red rectangle. See text for abbreviations.
Figure 2 Methods applied at Steintaelli and their timing. White parts indicate data gaps; x indicates discontinuous surveys. See text for abbreviations.
Steintaelli, since they are located opposite each other in the Matter Valley.
Snow Cover Observations
In summer, long-range terrestrial laser scanners (LPM321 and VZ6000, RIEGL Laser Measurement Systems, Horn, Austria) were used to acquire high-resolution (<0.2 m) digital elevation models of the rock surface for both the NE- and the SW-facing study slopes at Steintaelli (Haberkorn et al., 2015b). In the winters 2012–13 and 2013–14, TLS was used to measure spatially distributed snow depth vertically to the snow surface with a resolution of 0.2 m, but only on the NE-facing slope (‘snow depth’ henceforth refers to vertical snow depth). In summer, snow depth was measured manually using snow probes inserted vertically along the geophysical transects (see Seismic refraction tomography in the Methods section) with an accuracy of ± 0.05 m. The point data were interpolated using the kriging algorithm by SURFER 8.05 (SURFER, Golden Software, Golden, CO, USA). In addition, time-lapse cameras registered information at 2 h intervals about snow cover distribution, the timing of the onset and disap-pearance of the snow cover, and on weather conditions above both rock slopes.
Near-surface rock temperature
Maxim iButtons® DS1922L temperature loggers (Maxim Integrated, San Jose, CA, USA) were used to continuously measure the spatially variable NSRTs in the rock slopes at 2 h intervals. Instrument accuracy was ± 0.25 °C at 0 °C after calibration in an ice-water mixture.
Fifteen temperature loggers spaced about 4 m apart were deployed in a linear array in 0.1 m long horizontal boreholes (0.02 m diameter) over the NE- and the SW-facing rock slopes. Four additional loggers were distributed over the ridge (Figure 1a). The boreholes cover various slope angles, aspects and elevations, which were registered in situ (see Figure 1c for selected loggers). Logger positions were recorded using differential GPS. The loggers were placed in water-resistant plastic capsules and the boreholes sealed with a gum plug to protect the devices from water in filtra-tion, atmospheric influences and direct exposure to solar radiation (Haberkorn et al., 2015a).
Snow cover duration could be detected on the basis of NSRT measurements and their daily standard deviation, due to the insulating properties of the snow (Schmid et al., 2012). A uniform NSRT standard deviation threshold of< 0.5 °C for both positive and negative NSRT (Haberkorn et al., 2015a) was applied. In addition, days with NSRTs between -0.25 and 0.25 °C were detected (Gubler et al., 2011) to determine zero-curtain periods. NSRT data from representative logger locations were used as input for simulations using the SNOWPACK model.
Rock Temperature Modelling
The 1D physics-based energy balance model SNOWPACK (Lehning et al., 2002a, 2002b) was used to simulate the temporal evolution of the rock thermal regime to 10 m depth at Steintaelli during the investigation period 2012–14. Modelled rock temperatures were used tofill the temporal gap between annual geophysical surveys and were compared to SRT measurements at rock slopes with differ-ent aspects (NE, SW) and gradidiffer-ents (30 to 50°).
SNOWPACK solves the surface energy balance for a va-riety of layers within the snowpack (Bartelt and Lehning, 2002) and for defined ground layers (Luetschg et al., 2003), all represented asfinite elements. Ground temperature simulations were run with Dirichlet boundary conditions, using NSRT data measured at 0.1 m depth as the upper boundary condition. As NSRT data already comprise indirect snow cover information and to avoid the calculation of the entire surface energy balance, snow depth and incoming shortwave radiation were forced to be zero. The geothermal heatflux (QG) was set to 0.001 W m-2, since it is not known in high-Alpine rock slopes. The physical properties of the paragneiss bedrock are based on values given by Cermák and Rybach (1982): rock density was set to 2600 kg m-3, thermal conductivity 2.5 W m-1K-1and specific heat capacity 800 J kg-1K-1. The porosity of the rock (2.40 ± 0.12%) was measured in the laboratory (Draebing and Krautblatter, 2012) and the solid content was assumed to be 97%, account-ing for pores and fractured space containaccount-ing ice or water.
SNOWPACK has been applied successfully for model-ling ground temperatures in permafrost (Luetschg et al., 2008) and in steep rock walls (Haberkorn et al., 2015b). Model uncertainties resulting from the use of only NSRT as the upper and QGas the lower boundary condition were evaluated. On account of the lack of temperature validation data at depth for the modelled rock thermal regime at Steintaelli, test simulations were performed at Gemsstock, central Swiss Alps. Here, modelled rock temperatures accord well with borehole rock temperatures measured at various depths down to 15 m for both NE- and SW-facing locations (r2= 0.6–0.88). Correlation decreases with increasing depth, since modelled temperatures are biased by the QG. Consequently, simulated rock temperatures are only considered to a depth of 10 m at Steintaelli.
Seismic refraction tomography
Three-dimensional SRT spatially quantifies ALT and possi-ble permafrost distribution (Krautblatter and Draebing, 2014). The measurements were conducted along four 80 m long parallel transects (T1, T3, T5, T7 in Figure 1a) from the NE slope across the ridge towards the SW slope once a year in summer 2012, 2013 and 2014 (Figure 2). Data acquisition, processing with Reflex W 7.0.5 (manufactured by Dr K.J. Sandmeier, Karlsruhe, Germany) and details of parameters are given by Krautblatter and Draebing (2014). The first arrival times of seismic waves were picked
manually (travel times) and inverted by distance into p-wave velocities. Picking errors ranged up to 1 ms, which resulted in an inaccuracy of p-wave velocities of up to 0.3 km s-1. The SRT model presents the spatial p-wave velocity distribution in the rock slopes. Travel time data were analysed to estimate the quality of the tomography, and root mean square error analysis and total absolute time difference were used to quantify tomography reliability. The latter sums all travel time differences between measured and calculated data and displays the quality of the overall adaption of the tomography (Sandmeier, 2012). The total absolute time differences ranged from 1.27 to 1.89 ms and root mean square error from 1.70 to 2.91 ms, both indicating a good overall reliability. Laboratory calibration of rock samples was transferred into field scenarios of possibly frozen (>4.1 km s-1) and frozen conditions (>5.3 km s-1). The repetitive measurements were analysed using a time-lapse approach to quantify temperature evolution (Hilbich, 2010). In addition, mean travel time and the mean source-receiver offset of every 5 m offset were calculated to analyse the warming and cooling trends.
Crackmeter Measurements
On the less steep areas (<20°) of the slopes at similar elevations, ten 0.4 m long Geokon 4420-1-50 vibrating wire crackmeters (Geokon, Lebanon, NH, USA) were installed across fractures approximately 0.3 m wide to monitor ice- and temperature-induced crack movements (Figure 3). The crackmeters (Figure 1a), anchored in bedrock, were located on a transect from the NE slope (2 crackmeters) across the ridge (6) towards the SW slope (2). Thus, their spatial distribution allows monitoring of rock movements only in a one-vector dimension. Robust half tubes were used to protect crackmeters from snow. Below crackmeter 7, a
piezometer was installed on the top of fracture ice-filling at 2 m depth to monitor crack water pressure, which is used as a proxy for cryosuction (Harris et al., 1995; Murton et al., 2001). As a result of coherent growth of the fracture ice body, the piezometer was enclosed by ice since approxi-mately November 2012. Data were collected using a Geokon LC2x16 data logger. Crackmeters include a temperature logger (Figure 3) measuring crack-top temperature (CT) with a resolution of ± 0.5 °C to correct for thermal expansion of the vibrating wire. All fracture movements were cali-brated according to the calibration protocol of the manufac-turer and the accuracy is approximately ± 0.1%, resulting in a maximum deviation of ± 0.07 cm during snow-free condi-tions. CT and crack expansion were recorded at 3 h intervals. Snow cover duration obtained from CT was calculated according to Near-surface rock temperature in the Methods section.
RESULTS
Meteorological Analysis
The annual mean air temperature (AMAT) at Steintaelli in 2012–13 was -3.7 °C and thus 1 °C lower than in 2013–14 (Table 1). Comparing values for both 2012–13 and 2013– 14 to the 12 year average measured at the IMIS Oberer Stelligletscher revealed that in 2012–13, the AMAT was 1 °C lower. The 2013–14 AMAT corresponded to the 12 year average. Maximum snow depths and the timing of snow cover onset and disappearance (Figure 4a) measured at the IMIS Oberer Stelligletscher were similar during both winters. Time-lapse photographs showed that the snow cover at Steintaelli lasted until August and September in both 2012–13 and 2013–14 due to the cold and wet spring 2013 and summer 2014. The air temperature was up to 3.7 °C lower in May and June 2013 and up to 2.2 °C lower in July and August 2014 than the 12 year average measured at the IMIS Oberer Stelligletscher. Monthly precipitation increased by a factor of 1.5 in May 2013 and by 2.5 in July 2014 compared to the reference period 1981–2010 (MeteoSwiss AWS Grächen), and mainly fell as snow at the Steintaelli.
Figure 3 Crackmeter 7 installed on the ridge across a 0.3 m wide, partially ice-filled fracture. The grey half tube protects the crackmeter and thermistor from snow loads. A piezometer at 2 m depth is located on top of ice within
the fracture. Photograph taken during installation in August 2012.
Table 1 Measurement periods and air temperatures at Steintaelli.
Date AMAT [°C] WMAT [°C] SMAT [°C]
1 September 2012 to 31 August 2013 -3.7 -11.5 3.8 1 September 2013 to 31 August 2014 -2.7 -7.8 2.7
AMAT = Annual mean air temperature; WMAT = winter mean air temperature calculated for December, January and February; SMAT = summer mean air temperature calculated for June, July and August.
Snow Cover Distribution
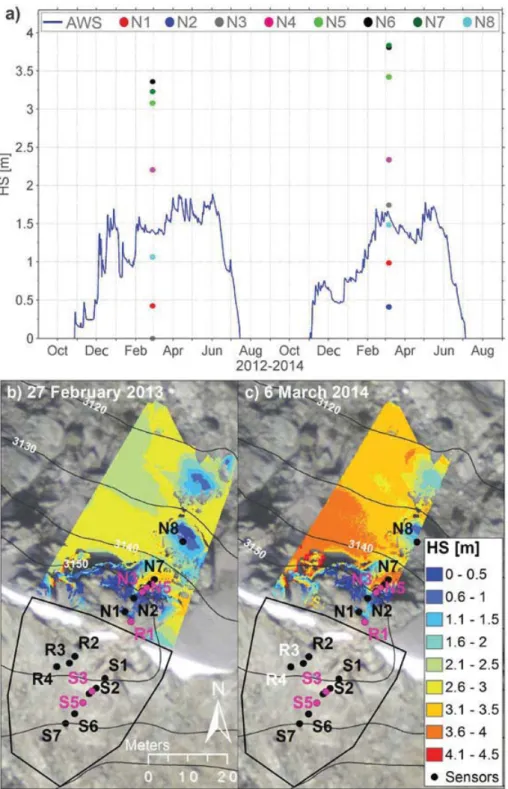
In Figure 4, snow depth distribution obtained using TLS is shown on the NE slope of the Steintaelli. Snow depth varied
by up to 3 m. Loggers located at the foot of the rock slope (N4–N8) accumulated up to 3.8 m of snow, whereas on the upper and rougher rock slope section (N1–N3) snow depths reached 1.5 m. Figure 5 shows the temporal and Figure 4 (a) Time series of snow depth (HS) at the IMIS Oberer Stelligletscher (blue line), as well as the snow depths at the NSRT sensors in the NE-facing rock slope (coloured dots) obtained by TLS. Snow depth distribution for (b) 27 February 2013 and (c) 6 March 2014 on the NE slope measured using TLS (map data: swissimage©2015 swisstopo 5704 000 000). No TLS data are available for the SW-facing rock slope. Black dots indicate temperature logger
locations. Pink dots indicate logger locations discussed in detail. See text for other abbreviations.
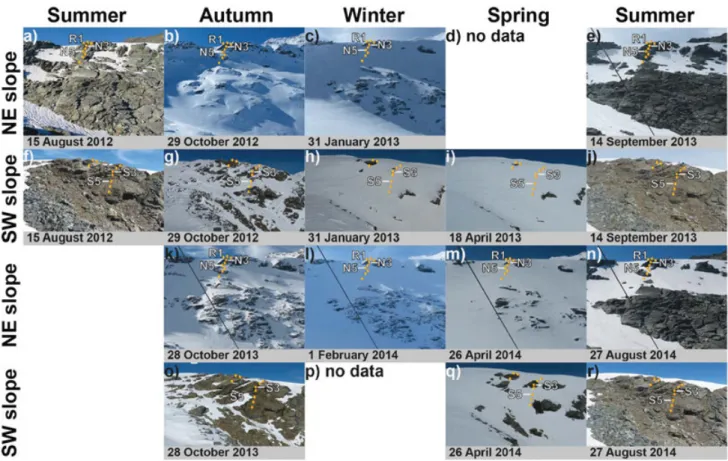
spatial distribution of the snow cover indicated by time-lapse photographs. Similar interannual snow accumulation patterns were evident on both the NE- and the SW-facing slopes. The predominantlyflat ridge was covered by a thick snow cornice in both years.
In winter 2013–14, the onset of the snow cover was 2 weeks earlier than in winter 2012–13, with around 0.5 m higher snow depths. There were also differences, partly in-duced by aspect, in the date of snow disappearance between 2012–13 and 2013–14 (black vertical lines in Figure 6). Snow disappearance was about 4 weeks later or the snow even persisted throughout the whole summer on the lower NE-facing slope in 2013–14 due to recurring summer snow-fall events. In contrast, the date of snow disappearance (mid/end June) was very similar on the lower SW slope and on the steep NE-facing slope sectors in both years. After the snow cornice formed on the ridge in autumn 2012, it only melted partly at its margins in both summers. Snow probing revealed that the remaining snow depths varied between 1.2 m in summers 2012 and 2014 and up to 3 m in summer 2013 (see Figure 8b).
Near-surface rock temperature
The variability of annual mean NSRT (AMNSRT) along the individual rock slopes (Table 2) was similar in the
NE-facing slope (AMNSRT around -2.7 °C) and in the SW-facing slope (AMNSRT of 1.1 °C) for both 2012–13 and 2013–14. AMNSRT variability within the individual NE and SW slopes was less than 2 °C.
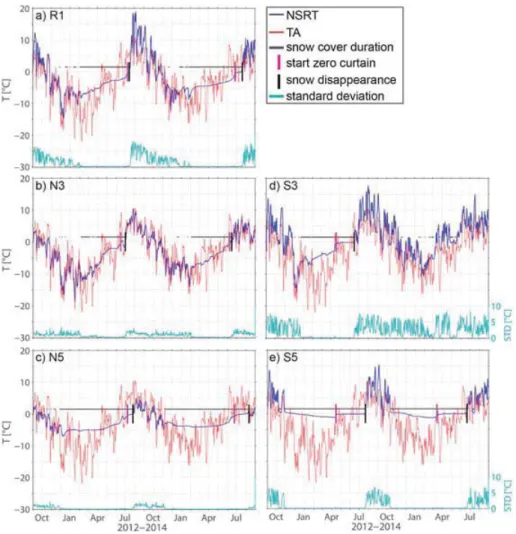
The detailed evolution of NSRT forfive selected temper-ature loggers (Figure 1c; Table 2) in both the NE- and the SW-facing rock slopes, and one on the ridge is shown in Figure 6. These loggers are representative of the majority of NSRTs in, and snow conditions occurring on the rock slopes. Logger N5 (Figure 6c) was located in steep rock, but only 0.1 m above the moderately inclined, lower NE-facing rock slope sector. Here, AMNSRT was up to -2.9 °C and a con-tinuous snow cover existed for around 9 months. Although the snow lasted 3 weeks longer in winter 2013–14, the AMNSRT (N5 in Table 2) was 0.7 °C warmer than in the previous year 2012–13. The NSRT data show the postpone-ment of efficient thermal insulation caused by the 2 week delay in the onset of the thin snow cover and by lower air temperatures in autumn in 2012–13.
During the snow-free periods, the NSRT at logger N3 (Figure 6b), located in shaded steep rock 3 m above a ledge, closely followed air temperature. The snow cover onset was in early February in both 2012–13 and 2013–14 and lasted until mid (2013–14) to end June (2012–13). The same inter-annual AMNSRT differences were observed here (N3 in Table 2) as those at logger N5.
Figure 5 Spatial and temporal snow cover distribution recorded on time-lapse photographs during the study years (a-j) 2012–13 and (k-r) 2013–14 on the NE and the SW slopes of Steintaelli. The diagonal line is an anchor cable. Orange dots indicate temperature logger locations. Logger locations discussed in detail are labelled.
Logger S3 was located in steep rock exposed to the sun, several metres above a ledge (S3 in Table 2 and Figure 6d). This logger accumulated snow for 5 months in 2012–13, whereas only an ephemeral snow cover persisted here during the winter 2013–14, as indicated by pronounced daily
temperature amplitudes. Here, the AMNSRT increase was also 0.7 °C in 2013–14.
Only logger R1 (Figure 6a), located on the flat ridge, and logger S5 (Figure 6e), located in moderately inclined SW-facing rock, did not show increasing AMNSRT in the Figure 6 Daily mean values of NSRT and air temperature (TA) between 1 September 2012 and 31 August 2014. Snow cover duration based on daily NSRT standard deviation (STD), the start of the zero-curtain period and the day of snow disappearance is shown. Selected temperature loggers are located in the (b, c)
NE- and (d, e) SW-facing slopes, as well as on (a) the ridge. See text for other abbreviations.
Table 2 Slope, aspect, distance to ledge below (DLB), annual mean near-surface rock temperature (AMNSRT) and number of snow-covered days (SCD) for selected temperature loggers with different snow conditions for the years 2012–13 and 2013–14. The AMNSRTs for the entire NE- and SW-facing rock slopes are also shown.
2012–13 2013–14
Logger/location Slope [°] Aspect [°] DLB [m] AMNSRT [°C] SCD [days] AMNSRT [°C] SCD [days]
N5 87 0 0.1 -2.9 242 -2.2 278 N3 82 83 3 -3.7 147 -3.0 134 R1 48 88 0 -1.6 185 -1.8 208 S3 76 221 3 0.5 178 1.2 43 S5 30 221 0 1.4 268 1.4 254 NE slope — — — -2.8 — -2.6 — SW slope — — — 1.1 — 1.1 —
http://doc.rero.ch
year 2013–14 (R1, S5 in Table 2). At both logger R1 and S5 the timing of the snow cover onset and disappearance differed by around 2 to 3 weeks between 2012-2013 and 2013-2014. At R1 NSRT decreased below 0 °C, while at S5 NSRT remained close to 0 °C below the snow. Modelled Rock Temperature
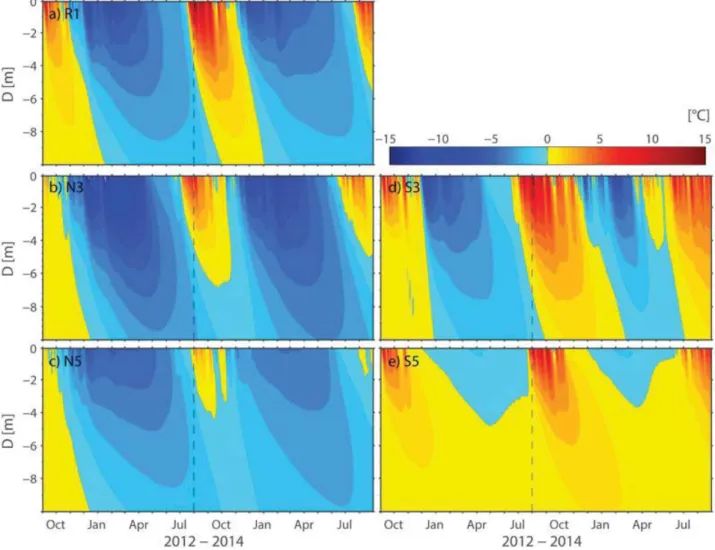
Close to the surface, simulated rock temperatures at selected NSRT logger locations (see Near-surface rock temperature in the Results section) displayed transient, diurnal and seasonalfluctuations, while they were damped and lagged with increasing depth. At the start of the modelling period in September 2012, the AL was modelled to depths> 10 m over the entire rock mass. Modelled rock temperatures then decreased efficiently in winter 2012–13. Although modelled rock temperatures decreased more efficiently in the steeper parts of the NE slope during winter (N3 in Figure 7b), tem-peratures in the lower rock slope sectors (N5 in Figure 7c) remained below 0 °C for a longer period (10 to 11 months
per year). ALT reached 4 m in summer 2012–13 and less than 1.5 m in summer 2013–14 at N5. At N3, the AL was thicker (6 and≤5m respectively). At the steep location on the SW side (S3 in Figure 7d) and on the ridge (R1 in Figure 7a), annual freeze-thaw cycles occurred to depths> 10 m. Positive modelled rock temperatures with large diurnal amplitudes were observed for up to 4 months during both summers 2012–13 and 2013–14, whereas during winter the ground cooled efficiently. During winters 2012–13 and 2013–14, modelled rock temperatures were< 0 °C. In the lower and gently inclined SW-facing part of the rock slope (S5 in Figure 7e), simulated rock temperatures remained close to 0 °C between November and June.
Seismic refraction tomography
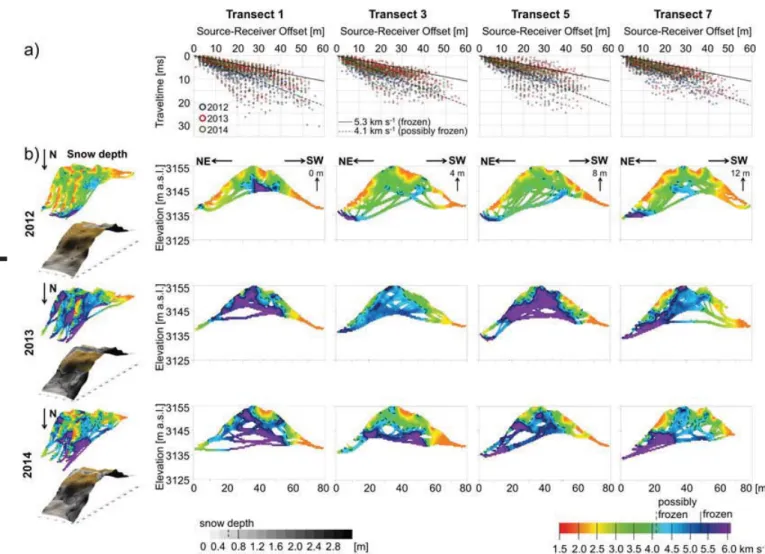
The travel time data analysis shows p-wave velocities that indicate possibly frozen (4.1 km s-1) and frozen (5.3 km s-1) conditions in all transects (Figure 8a). The SRTs display
Figure 7 (a-e) Modelled rock temperatures (°C) to a depth (D) of 10 m atfive different NSRT locations between 1 September 2012 and 31 August 2014. The dashed line indicates the date of the SRT survey in summer 2013. See text for other abbreviations.
the spatial distribution of unfrozen, possibly frozen and fro-zen areas (Figure 8b). The NE face of the rock slope showed p-wave velocities in the unfrozen range to depths of 5 to 10 m in 2012, 4 m in 2013 and 5 m in 2014. Frozen areas were re-stricted to the snow-free foot of the NE slope in 2012. Snow-covered areas were frozen up to the surface in 2013 and 2014. On the ridge, unfrozen areas reached depths between 5 and 12 m in 2012 and were reduced to depths of up to 4 m in 2013 and 5 m in 2014. On the contrary, the SW slope did not reveal frozen areas to the maximum detected depth.
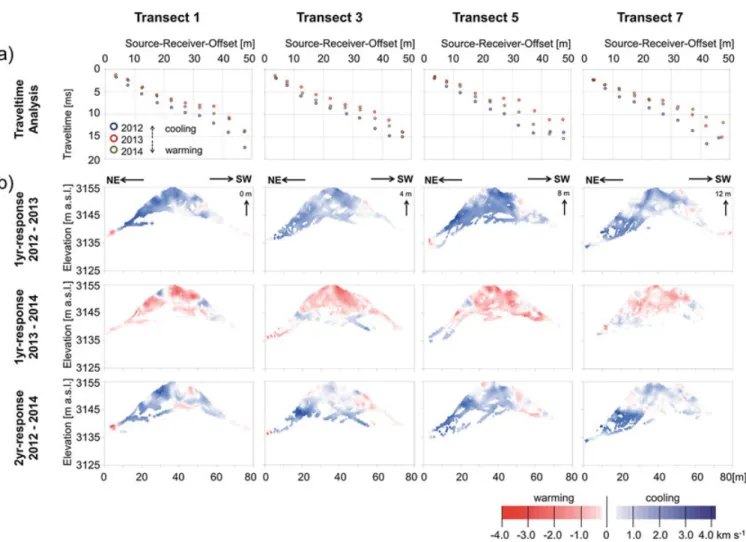
Analysis of mean travel times for each 5 m source-receiver offset showed a decrease in mean travel times between 2012 and 2013, indicating a cooling trend. This was followed by a small increase or warming in 2014 (Figure 9a). However, mean travel times over the entire period indicate an overall cooling trend.
Time-lapse SRT demonstrates an increase in p-wave velocities between 2012 and 2013 (Figure 9b). Increased
p-wave velocities in the range from 0.8 to 2.0 km s-1 indicate a phase transition from unfrozen to frozen state, as demonstrated in laboratory measurements on Steintaelli rock samples by Krautblatter and Draebing (2014). The NE slope and the ridge showed p-wave ve-locity increases higher than 0.8 and 2.0 km s-1, respec-tively, indicating cooling. The SW-facing slope only displayed a slight increase in p-wave velocities between 2012 and 2013. One year later, p-wave velocity generally decreased. The highest p-wave velocity decrease in the range of phase transition from the frozen to unfrozen state was observed on the ridge. Comparing 2012 and 2014, the 2 year response of the rock slope shows an overall increase in p-wave velocities, with a maximum increase on the NE-facing slope. Small patches of rock with decreased p-wave velocities, indicating a warming, were located on the lower parts of the NE- and SW-facing slopes.
Figure 8 SRT transect results: (a) Travel times plotted against source-receiver offset show the occurrence of p-wave velocities in the frozen and possible frozen range in all transects in 2012 to 2014; (b) left: summer snow depth; right: SRT-indicated p-wave velocities along the four transects, each 80 m (x axis)
long. Location of transects is shown in Figure 1a. See text for abbreviations.
Crackmeter Measurements
In 2012–13 and 2013–14, crackmeters registered respective annual mean CTs of -4.0 and -3.7 °C on the NE slope, -2.3 and -2.0 °C on the ridge and -1.0 and -1.3 °C on the SW slope. Snow cover lasted longest on the ridge (226 to 365 days) and decreased towards the NE- (265 to 342 days) and SW-facing slopes (0 to 285 days).
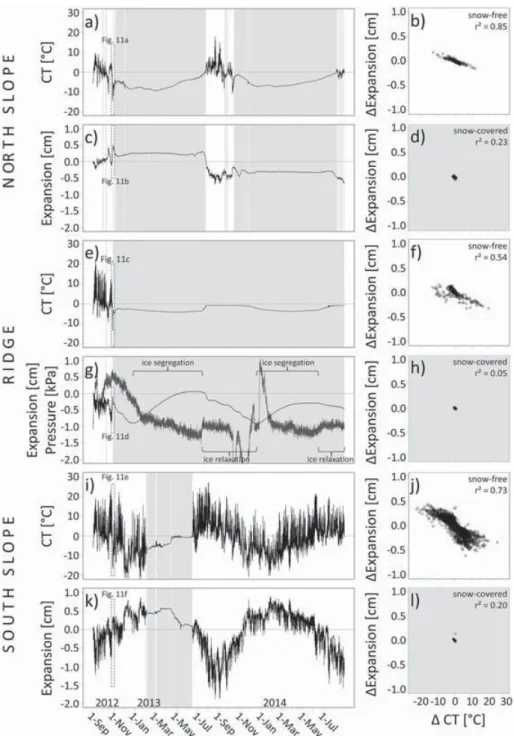
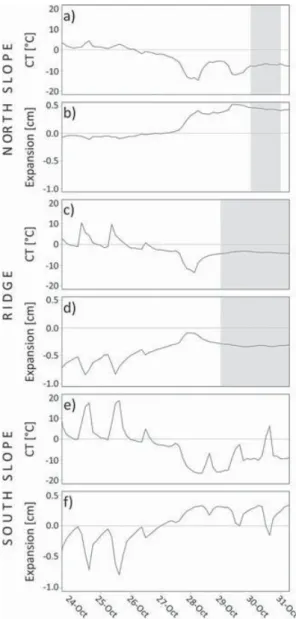
The data from three representative crackmeters (C8, C7, C11) for the NE- and the SW-facing slopes and the ridge (Figure 1c) are presented in Figure 10. During snow-free periods, the three crackmeters showed dailyfluctuations of CT (Figure 10a, e, i) and daily fluctuations of expansion (Figure 10c, g, k). Change in CT and change in crackmeter expansion are significantly correlated (r2= 0.54–0.85; Figure 10b, f, j). During warming, the rock slope expanded and as a result crackmeter length decreased, while cooling resulted in an increase in crackmeter length. Temperature drops from positive CT to -10 °C and below (Figure 11a, c, e) resulted in a sudden increase in crack expansion due to
thermal contraction of the rock (Figure 11b, d, f), which may have been amplified by volumetric expansion due to phase transition from in-situ water to ice.
During the snow-covered periods, CT remained at sustained negative values and varied little. The NE-facing crackmeter remained in an expanded state (Figure 10c), while the SW-facing crackmeter contracted during the zero-curtain (Figure 10k). In contrast, the crackmeter on the ridge expanded by 1 cm with coincident negative crack water pressure values between December 2012 and July 2013 (Figure 10g). The opening was followed by a closure of 1 cm (Figure 10g), starting when CT (Figure 10e) and crack water pressure both suddenly increased in July 2013; the fracture closing lasted until December 2013. This opening pattern repeated itself in a reduced manner (0.6 cm) from December 2013 onward and was followed by a minor decrease in crack expansion from June 2014 onward. Crack water pressure fluctuated strongly after October 2013 and subsequent to mid-January 2014, when negative values up to -1.2 kPa were registered. When CT Figure 9 (a) Mean travel times plotted against mean source-receiver offset for each 5 m along transects 1, 3, 5 and 7. A cooling trend from 2012 to 2013 was followed by a smaller warming trend from 2013 to 2014. (b) Time-lapse SRT shows p-wave velocity increases that indicate the spatial distribution of the
intense cooling effect due to snow cover along the four transects. See text for abbreviations.
started to increase in mid-June, crack water pressure fluc-tuated around -1 kPa and the closing pattern repeated it-self. As a consequence of insulation by the snow cover, daily temperature changes and thus thermal expansion and contraction were absent. The change in CT therefore did not correlate significantly with change in expansion (r2= 0.05–0.23; Figure 10d, h, l).
Annually, crack expansion showed a sinusoidal behav-iour, with inverse development of CT at the snow-free crackmeter on the SW slope (Figure 10i, k). Annual expan-sion of the crackmeters ranged between 1 cm on the NE slope (Figure 10c) and the ridge (Figure 10g) to 2 cm on the SW slope (Figure 10k); however, net expansion between September 2012 and August 2014 covered a much smaller Figure 10 (a, e, i) CT and (c, g, k) fracture expansion for crackmeters C8 on the NE slope, C7 on the ridge and C11 on the SW slope as well as (g) crack water pressure (dark grey) in the fracture blow C7 between September 2012 and August 2014. Snow cover presence is indicated by grey rectangles. Dotted rect-angles show the data time series presented in Figure 11. Correlation between change in CT and change in expansion shows a significant relation for snow-free
conditions (b, f, j) and an insignificant relation for snow-covered conditions (d, h, l). See text for abbreviations.
range (0.6 to 1 cm). Short-term changes (Figure 11) peaked during snow-free periods, reaching 0.4–0.5 cm on the NE slope and ridge and were amplified on SW-exposed loca-tions (0.7 cm).
DISCUSSION
Snow Cover Distribution
In structured rock slopes like those investigated at the Steintaelli, the onset of the seasonal snow cover, its dura-tion, depth and disappearance varied in time and space, as observed from the time-lapse photography (Figure 5) and
NSRT data (Figure 6). A thick, uniform snow cover persisted for around 9 months yearly (Figure 6c, e) on the moderately steep and homogenous lower rock slopes, compared to the steeper (up to 75°) and heterogeneous slopes above, which accumulated less snow. The snow-covered period was up to 4 (NE) or 7 months (SW) shorter in the upper, steep rock slope sectors than on the lower, gentler slopes, with a delay in snow cover onset of around 3 months and an advance in snow disappearance of 1 month on the former. The wide, flat ridge favoured the development of a perennially deep snow cornice, which covered the crackmeters for most of the year (Figure 10e). Aspect-induced differences in snow cover resulted in a 3 month earlier onset of the zero-curtain in the entire SW-facing rock slope than at shaded locations due to stronger insolation. Snow disappearance was de-layed by 2 weeks to 2 months on the shaded rock slope. These aspect-induced differences agree with observations from steep bedrock sites (Haberkorn et al., 2015a; Wirz et al., 2011). Although the snowpack was heterogeneous in time and space, recurring snow distribution patterns were observed on both the NE and SW slopes (Figures 4 and 5), as well as on the ridge. This supports thefindings of Gisnås et al. (2014) and Mott et al. (2010), who observed annual variations in snow depth, but similar recurring snow distribution patterns due to micro-topography.
Thermal Impact of Snow on Rock Temperatures At snow-rich sites like the Steintaelli, the variable snow cover is the key factor that influences the rock thermal re-gime. This is shown by the small difference in AMNSRT< 3.9 °C (Table 2) across the individual shaded and the sun-exposed rock slopes, presumably typical for snow-rich N- and S-facing rock walls as observed by Haberkorn et al. (2015a). In contrast, differences of up to 5 °C have been reported for partly snow-covered rock walls (Hasler et al., 2011a; Magnin et al., 2015) or up to 7 °C for snow-free, steep, compact rock (Gruber et al., 2004b; Hasler et al., 2011a).
Three dominant snow cover scenarios were observed at Steintaelli, influencing the rock thermal regime and thus controlling the absence or presence of permafrost. They are controlled by the micro-topography, that is, the distance to terrain ledges or to moderately inclined slopes. However, the initial timing and depth of the snow cover are the dom-inant factors driving the ground temperature regime, as was also observed by Hoelzle et al. (2003) and Luetschg et al. (2008).
First, thick snow efficiently decouples the rock surface from the winter atmosphere at the lower, homogenous and moderately inclined slopes. The insulating snow and the strong radiation input after snow disappearance result in the absence of permafrost in the SW slope (Figures 7e and 8b). In contrast, on the NE slope, modelled rock temperature (Figure 7c), as well as SRT (Figure 8b), confirmed the Figure 11 (a, c, e) Short-term CT and (b, d, f) fracture expansion for
crackmeters C8 on the NE slope, C7 on the ridge and C11 on the SW slope between 24 and 31 October 2012. Snow cover presence is indicated by grey
rectangles. See text for abbreviation.
occurrence of permafrost suggested by NSRT measurements (Figure 6c). Here, the autumn cooling effect and the conser-vation of low ground temperatures below the snowpack, in combination with a long-lasting snow cover for the months with most intense radiation resulted in a modelled refreezing of the ground to depths> 10 m after summer 2012. In sum-mer 2013 and 2014, modelled ALT reached 4 m, whereas SRT indicated frozen conditions without the development of an AL in both summers 2013 and 2014 at the NSRT logger (Figure 12). However, both modelled (Figure 7c) and measured (Figure 9b) annual and 2 year ground temperatures displayed interannual cooling. Thus, the cooling effect of a long-lasting snow cover on the thermal regime modelled by Luetschg et al. (2008) is confirmed.
Second, a patchy to moderately thick snowpack leads to pronounced rock temperature variations in the upper, steep rock slope sectors. The late snow cover onset led to strong ground cooling (up to 0.9 °C lower AMNSRT) at sites N3 and S3 compared to the flatter areas below (N5, S5 in Table 2). This effective ground freezing to depths> 10 m is also visible in the simulations for both the steep NE-and SW-facing rock slopes (Figure 7b, d). However, in the steep SW-facing parts, permafrost was absent (Figures 7d and 8b) due to snow-free conditions in the months with most intense radiation. In summer, the significantly shorter snow-covered period resulted in an earlier and up to 3 m deeper modelled thawing of the AL in the steep NE-facing slope sectors (Figure 7b) compared to the lower ones (Figure 7c). Whilst ground thaw was modelled to 5 m depth on SRT survey dates in both summers 2013 and 2014, ALT obtained by SRT was zero in summer 2013 or only 2 m thick in summer 2014 here (Figure 12). However, both model and SRT results confirm the ground cooling in 2013
(Figure 9b) and a refreezing of the upper NE slope (Figures 7b and 9b).
Third, the ground temperature distribution in the wide ridge was controlled by a perennial snow cornice, which melted only at its margins in summers 2013 and 2014. NSRT loggers were located at the margins of the ridge. Here, freeze-thaw cycles were modelled to depths> 10 m (Figure 7a) due to the delayed onset and early disappearance of snow cover. In contrast, at locations with thick perennial snow, the cooling effect of summer snow on ground temper-atures becomes obvious: after snow-free conditions in sum-mer 2012, the ALT shown by SRT was> 10 m. Although there are no ground temperature simulations to compare the depth of freeze-thaw cycles on ridge parts lacking NSRT measurements, we assume that the ground cooled efficiently in autumn 2012. After a thick snow cornice formed, the thaw depths measured with SRT only reached 4 to 5 m depth under the perennial snow. Although this snow re-duced ground cooling in autumn and early winter 2013, the snow cornice had an overall cooling effect on the ground (Figure 9b) due to its insulating effects during the months with the most intense solar radiation.
Combination of Thermal Investigation Techniques A combination of SRT, snow cover and NSRT measure-ments, as well as rock temperature modelling elucidates the ground thermal regime without the need for borehole rock temperature and detailed meteorological data. How-ever, certain limitations of these methods must be consid-ered in their interpretation. Modelled rock temperature (SNOWPACK) and the thermal state of the ground (un-frozen, possibly (un-frozen, frozen) indicated by SRT agreed well for the SW-facing rock slope (Figure 12) on the dates of the SRT measurements. SRT measurements indicated colder conditions and shallower thawing depths than the modelled rock temperature, especially in the NE-facing slope. This is due to the fact that the assumed ice content of 3 per cent in the model likely underestimates the actual ice content at Steintaelli, with its multiple sets of open dis-continuities and wide ice-filled fractures. In turn, this under-estimates the latent heat consumption by melting ice and overestimates the AL thawing. In addition, ice persisting in fractures during summer can cool the surrounding walls (Draebing et al., 2014). Overall, therefore, conditions observed by SRT are colder than those modelled by SNOWPACK. Additional differences occur due to lateral heat fluxes through the whole ridge because the three-dimensional character of the sub-surface heatflow (Noetzli et al., 2007; Noetzli and Gruber, 2009) is not taken into account in the 1D simulations.
Mechanical Response and Implications for Rock Stability
The duration of the snow-free period influences rock stability. This can have significant impacts on rock fatigue Figure 12 Comparison of modelled depth of unfrozen/frozen ground based
on SRT data and SNOWPACK rock temperature (RT) modelling atfive locations in NE- and SW-facing rock slopes and on the ridge. The com-parison was made for 1 August 2013 (SRT measurement date), whilst in 2014 SRT depths were measured on 6 September and RT modelled on 31
August. See text for abbreviations.
(Jia et al., 2015) and affects the thermal controls of effective rock wall retreat rates (Siewert et al., 2012; Krautblatter and Moore, 2014; de Haas et al., 2015). Warming rock expands uniformly and fractures narrow (Cooper and Simmons, 1977), whereas cooling rock contracts and fractures open. CT fluctuations were frequent and amplified on the SW slope (Figure 10i). High frequencies of thermal expansion and contraction can result in thermal stress (Hall and Thorn, 2014).
Volumetric expansion of 9% during phase transition from water to ice can cause intense cryostatic pressure (Matsuoka and Murton, 2008). To differentiate volumetric expansion from pure thermal contraction, a calibration of thermal ex-pansion of bedrock is required using dummy crackmeter measurements of intact rock without fractures (Matsuoka, 2001). Although a calibration of thermal expansion was not undertaken during ourfield measurements, the require-ments for volumetric expansion (e.g. saturated conditions and fast freezing) are unlikely to be met in 0.3 m wide fractures (Matsuoka and Murton, 2008). Therefore, we attribute observed crack opening (Figure 11b, d, f) during high rates of cooling (Figure 11a, c, e) to thermal contraction of the rock slope, possibly amplified by vol-umetric expansion of ice.
Snow insulation allows the development of CT within the range of the frost-cracking window (Anderson, 1998) on the ridge and NE-facing slope (Figure 10a, e). As a result of the rock strength-dependent property of frost cracking, ice seg-regation can start at temperatures higher than -3 °C (Murton et al., 2001). Decreasing amounts of unfrozen water can ex-ist at rock temperatures reaching approximately -10 °C (Mellor, 1970) and can migrate, due to cryosuction, towards the developing ice bodies in the fractures. If water supply is sufficient, the ice body grows slowly and progressively by ice segregation (Murton et al., 2006). Our data reveal slow ice segregation during negative crack water pressure periods on the ridge (Figure 10g), whereas ice segregation was re-duced or absent in the NE slope (Figure 10c). In laboratory rock weathering studies, negative porewater pressures are associated with cryosuction (Murton et al., 2001). There-fore, we attribute the decreasing crack water pressure trends during crack opening to cryosuction. However, the reason for strong fluctuations or positive values in December 2013 remains unknown. Frozen rock would have reduced permeability and water availability, and lower temperature gradients probably decreased or prevented ice segregation here. In contrast, water from the warmer and permafrost-free SW slope may migrate laterally to the ice-filled frac-tures on the ridge, and promote fracture opening by up to 1.0 cm during ice growth (Figure 10g). Warming or melting of ice in combination with reduced water availability re-sulted in ice stress relaxation due to reduced ice strength or ice extrusion (Tharp, 1987), and, thus in fracture closing up to 1.0 cm.
The thermal dynamics of permafrost influence rock sta-bility. Hydrostatic pressure and ice segregation enhance shear stresses in steep permafrost rock slopes, while per-mafrost and rock cooling increase critical fracture toughness
of intact rock bridges, uniaxial compressive strength of as-perities influencing rock-rock contacts, stability of rock-ice contacts and stability of ice itself (Krautblatter et al., 2013). The crackmeter data demonstrate that ice segregation caused maximum fracture opening due to cryostatic pressure during winter (Figure 10g), while shear strength is presumably greatest due to a frozen AL (Draebing et al., 2014). With decreasing cryostatic pressure, fracture width decreased and compensated former fracture opening (Figure 10g). Thermo-mechanical stress influences weathering of the rock slope and affects rock stability by de-creasing long-term shear resistance. Daily thermal changes are effective up to 0.5 m depth in intact rock (Gunzburger and Merrien-Soukatchoff, 2011) and generate thermal stress due to non-uniform heating of rock minerals and fractured rock sections (Gomez-Heras et al., 2006). Repetitive and cumulative thermal stress produces thermal fatigue (Hall and Thorn, 2014), which can lead to failure along pre-existing zones of weakness (Richter and Simmons, 1974; Mahmutoglu, 1998). The schistous paragneiss on the SW slope at Steintaelli is susceptible to thermal fatigue and is af-fected by the highest and most frequent thermal changes (Figure 10i). Disintegration along schistosity can be ampli-fied by rock fatigue due to repetitive volumetric expansion (Jia et al., 2015). In addition, thermal changes can influence the thermal regime by air convection along fractures to depths of more than 10 m (Moore et al., 2011) and cause thermal stresses of 10 to 100 kPa (Gischig et al., 2011). Over long timescales, these stresses can decrease the uniax-ial compressive strength of rock bridges and asperities and thus cause cracking of rock bridges and decrease friction of rock-rock contacts.
The crackmeter data demonstrated that fracture opening is compensated by fracture closing of the same magnitude (Figure 10c, g, k), indicating seasonal fatigue effects on rock stability. The repetitive occurrence of ice segregation, volumetric expansion and thermo-mechanical stress can decrease shear strength on a long-term scale and lead to a marginally stable situation, with the rock mass being more susceptible to failure (Draebing et al., 2014).
CONCLUSIONS
We investigated the effects of the heterogeneously distrib-uted snow cover on the rock thermal regime and rock me-chanical properties in structured rock faces at the Steintaelli. Our mainfindings are:
1 Snow depth and its distribution depend on topographic factors such as aspect, slope angle, surface roughness and distance to ledges, as well as on meteorological fac-tors (wind, radiation).
2 At the Steintaelli, a continuous, thick (up to 3.8 m) snow cover accumulates on gently inclined rock slopes and ledges, gradually covering the steeper (50° to 75°) slopes lying above, where only a patchy, thin snow cover can accumulate.
3 The snow cover, its initial onset, depth and duration strongly control the rock thermal regime and thus the presence or absence of permafrost.
4 Long-lasting snow cover (November to June) prevents deep AL thaw, especially on the flatter NE-facing slope.
5 Although a delayed onset of a patchy snow cover in steep rock sectors led to more pronounced ground cooling (compared to flatter rock slope areas where snow can accumulate earlier), the earlier snow disappearance here results in deeper AL thaw in summer.
6 On theflat, wide ridge, a thick perennial snow cornice exerts a cooling effect on the ground during summer, as the rock is insulated during the months when solar radiation is most intense.
7 The mechanical regime strongly reflects the snow cover and the thermal regime. During snow-free periods, high-frequency thermal expansion and contraction occurred, with highest magnitudes (up to 1 cm) on the SW slope. 8 Drops in rock temperature to -10 °C or below amplify
thermal contraction.
9 Insulating snow appears to favour ice segregation, with highest crack-opening magnitudes of 0.6 to 1.0 cm on the ridge.
10 The width of open rock fractures oscillates seasonally, although no persistent opening was observed. However, high-frequency, high-magnitude thermal expansion and contraction on the SW slope can lead to increasing stress and thermal fatigue, resulting in progressive crack
propagation along stress concentrations. In addition, ice-induced opening and closing on the ridge can have the same effect. Both contribute to the preparation of future rock slope failure.
We highlight the importance of combined thermal model-ling, geophysics and kinematic monitoring to gain insight into actively deforming permafrost rock slopes in the absence of borehole ground temperature measurements.
ACKNOWLEDGEMENTS
The project ‘Influences of snow cover on thermal and mechanic processes in steep permafrost rockwalls’ was co-funded by the German Research Foundation (KR3 912/1-1) and the Swiss National Science Foundation (DACH project no. 200021E-135531). D. Draebing acknowledges additional funding of a Dr Hohmann grant from the Society for Geography of Cologne. MeteoSwiss is thanked for providing meteorological data. We thank the Editor, J. Murton, one anonymous reviewer and N. Matsuoka as well as our colleague M. Hoelzle for their valuable comments on the manuscript, H. Rhyner who was responsible for safety in thefield and the SLF electronics and mechanics team. We acknowledgefieldwork support by H. Berger, C. Bierbaum, C. Halla, J. Eichel, L. Ettlin, N. Gorus, K. Messenzehl, C. Querner, C. Reinartz, M. O. Schmid, C. Schmitz and J. Seiwald.
REFERENCES
Anderson RS. 1998. Near-surface thermal pro-files in alpine bedrock: Implications for the frost weathering of rock. Arctic and Alpine Research 30: 362–372. DOI:10.2307/ 1552008
Bartelt P, Lehning M. 2002. A physical SNOWPACK model for the Swiss ava-lanche warning Part I: numerical model. Cold Regions Science and Technology 35: 123–145. DOI:10.1016/S0165-232X(02) 00074-5
Barton N, Choubey V. 1977. The shear strength of rock joints in theory and prac-tice. Rock Mechanics 10: 1–54. DOI:10. 1007/bf01261801
Bernhard L, Sutter F, Haeberli W, Keller F. 1998. Processes of snow/permafrost-interactions at a high-mountain site, Murtèl/Corvatsch, Eastern Swiss Alps. In Proceedings of the 7th International Confer-ence on Permafrost, Lewkowicz AG, Allard M (eds). : Yellowknife, Canada; 35–41.
Blikra LH, Christiansen HH. 2014. A field-based model of permafrost-controlled rockslide deformation in northern Norway.
Geomorphology 208: 34–49. DOI:10.1016/ j.geomorph.2013.11.014
Cermák V, Rybach L. 1982. Thermal conduc-tivity and specific heat of minerals and rocks. In Landolt–Börnstein Zahlenwerte and Funktionen aus Naturwissenschaften und Technik,Neue Serie, Physikalische Eigenschaften der Gesteine (V/1a), Angeneister G (ed). Springer: Berlin; 305–343.
Cooper HW, Simmons G. 1977. The effect of cracks on the thermal expansion of rocks. Earth and Planetary Science Letters 36: 404–412. DOI:10.1016/0012-821X(77) 90065-6
Davies MCR, Hamza O, Harris C. 2001. The effect of rise in mean annual temperature on the stability of rock slopes containing ice-filled discontinuities. Permafrost and Periglacial Processes 12: 137–144. DOI: 10.1002/ppp378
de Haas T, Conway SJ, Krautblatter M. 2015. Recent (Late Amazonian) enhanced backweathering rates on Mars: Paracratering evidence from gully alcoves. Journal of Geophysical Research - Planets 120: 2169–2189. DOI:10.1002/ 2015je004915
Draebing D, Krautblatter M. 2012. P-wave ve-locity changes in freezing hard low-porosity rocks: a laboratory-based time-average model. The Cryosphere 6: 1163–1174. DOI:10.5194/tcd-6-793-2012
Draebing D, Krautblatter M, Dikau R. 2014. Interaction of thermal and mechanical pro-cesses in steep permafrost rock walls: A conceptual approach. Geomorphology 226: 226–235. DOI:10.1016/j.geomorph.2014. 08.009
Fischer L, Kääb A, Huggel C, Noetzli J. 2006. Geology, glacier retreat and permafrost deg-radation as controlling factors of slope in-stabilities in a high-mountain rock wall: the Monte Rosa east face. Natural Hazards and Earth System Sciences 6: 761–772. DOI:10.5194/nhess-6-761-2006
Gischig VS, Moore JR, Evans KF, Amann F, Loew S. 2011. Thermomechanical forcing of deep rock slope deformation: 1. Con-ceptual study of a simplified slope. Jour-nal of Geophysical Research - Earth Surface 116: F04010. DOI:10.1029/ 2011jf002006
Gisnås K, Westermann S, Schuler TV, Litherland T, Isaksen K, Boike J, Etzelmüller B. 2014. A statistical approach
to represent small-scale variability of per-mafrost temperatures due to snow cover. The Cryosphere 8: 2063–2074. DOI:10. 5194/tc-8-2063-2014
Gomez-Heras M, Smith BJ, Fort R. 2006. Sur-face temperature differences between min-erals in crystalline rocks: Implications for granular disaggregation of granites through thermal fatigue. Geomorphology 78: 236–249. DOI:10.1016/j.geomorph.2005. 12.013
Gruber S, Haeberli W. 2007. Permafrost in steep bedrock slopes and its temperaure-related destabilization following climate change. Journal of Geophysical Research -Earth Surface 112: F02S18. DOI:10.1029/ 2006JF000547
Gruber S, Hoelzle M, Haeberli W. 2004a. Per-mafrost thaw and destabilization of Alpine rock walls in the hot summer of 2003. Geo-physical Research Letters 31: 1–4. DOI:10. 1029/2004GL020051
Gruber S, Hoelzle M, Haeberli W. 2004b. Rock-wall temperatures in the Alps: model-ling their topographic distribution and re-gional differences. Permafrost and Periglacial Processes 15: 299–307. DOI: 10.1002/ppp.501
Grünewald T, Lehning M. 2011. Altitudinal dependency of snow amounts in two small alpine catchments: can catchment-wide snow amounts be estimated via single snow or precipitation stations? Annals of Glaciol-ogy 52: 153–158. DOI:10.3189/ 172756411797252248
Gubler S, Fiddes J, Keller M, Gruber S. 2011. Scale-dependent measurement and analysis of ground surface temperature variability in alpine terrain. The Cryosphere 5: 431–443. DOI:10.5194/tc-5-431-2011 Gunzburger Y, Merrien-Soukatchoff V. 2011.
Near-surface temperatures and heat balance of bare outcrops exposed to solar radiation. Earth Surface Processes and Landforms 36: 1577–1589. DOI:10.1002/esp.2167 Haberkorn A, Hoelzle M, Phillips M, Kenner
R. 2015a. Snow as a driving factor of rock surface temperatures in steep rough rock walls. Cold Regions Science and Technol-ogy 118: 64–75. DOI:10.1016/j. coldregions.2015.06.013
Haberkorn A, Phillips M, Kenner R, Rhyner H, Bavay M, Galos SP, Hoelzle M. 2015b. Thermal regime of rock and its relation to snow cover in steep alpine rock walls: Gemsstock, Central Swiss Alps. Geografiska Annaler 97: 579–597. DOI: 10.1111/geoa.12101
Hall K, Thorn CE. 2014. Thermal fatigue and thermal shock in bedrock: An attempt to un-ravel the geomorphic processes and prod-ucts. Geomorphology 206: 1–13. DOI:10. 1016/j.geomorph.2013.09.022
Halla C. 2013. Bewegungsprozesse im Festgestein des Periglazials im Steintälli, Mattertal, Schweiz. Diploma thesis (unpub-lished), University of Bonn.
Hanson S, Hoelzle M. 2004. The thermal re-gime of the active layer at the Murtel rock glacier based on data from 2002. Perma-frost and Periglacial Processes 15: 273–282. DOI:10.1002/ppp.499
Harris C, Davies MCR, Coutard J-P. 1995. Laboratory simulation of periglacial soli-fluction: Significance of porewater pres-sures, moisture contents and undrained shear strengths during soil thawing. Perma-frost and Periglacial Processes 6: 293–311. DOI:10.1002/ppp.3430060403
Hasler A, Gruber S, Haeberli W. 2011a. Tem-perature variability and offset in steep al-pine rock and ice faces. The Cryosphere 5: 977–988. DOI:10.5194/tc-5-977-2011 Hasler A, Gruber S, Font M, Dubois A. 2011b.
Advective heat transport in frozen rock clefts: conceptual model, laboratory experi-ments and numerical simulation. Perma-frost and Periglacial Processes 22: 378–389. DOI:10.1002/ppp.737
Hilbich C. 2010. Time-lapse refraction seismic tomography for the detection of ground ice degradation. The Cryosphere 4: 243–259. DOI:10.5194/tc-4-243-2010
Hoek E, Brown ET. 1997. Practical estimates of rock mass strength. International Journal of Rock Mechanics and Mining Sciences & Geomechanics Abstracts 34: 1165–1186. DOI:10.1016/S1365-1609(97)80069-X Hoelzle M, Haeberli W, Stocker-Mittaz C.
2003. Miniature ground temperature data logger measurements 2000-2002 in the Murtèl-Corvatsch area. In Proceedings of the 8th International Conference on Perma-frost, Phillips M, Springman S, Arenson L (eds). Swets & Zeitlinger, Lisse: Zürich; 419–424.
Jia H, Xiang W, Krautblatter M. 2015. Quanti-fying rock fatigue and decreasing compres-sive and tensile strength after repeated freeze-thaw cycles. Permafrost and Periglacial Processes 26: 368–377. DOI: 10.1002/ppp.1857
Keller F, Gubler H. 1993. Interaction between snow cover and high mountain permafrost, Murtèl/Corvatsch, Swiss Alps. In Proceed-ings of the 6th International Conference on Permafrost, Guodong C (ed). South China University, Technology Press: Beijing; 332–337.
Krautblatter M. 2009. Detection and quanti fi-cation of permafrost change in alpine rock walls and implications for rock instability, Universität Bonn, Bonn, 164 pp.
Krautblatter M, Draebing D. 2014. Pseudo 3D - P-wave refraction seismic monitoring of permafrost in steep unstable bedrock.
Journal of Geophysycal Research - Earth Surface 119: 287–299. DOI:10.1002/ 2012JF002638
Krautblatter M, Hauck C. 2007. Electrical re-sistivity tomography monitoring of perma-frost in solid rock walls. Journal of Geophysycal Research - Earth Surface 112: F02S20. DOI:10.1029/2006JF000546 Krautblatter M, Moore DP. 2014. Rock slope
instability and erosion: toward improved process understanding. Earth Surface Pro-cesses and Landforms 39: 1273–1278. DOI:10.1002/esp.3578
Krautblatter M, Funk D, Günzel FK. 2013. Why permafrost rocks become unstable: a rock–ice-mechanical model in time and space. Earth Surface Processes and Landforms 38: 876–887. DOI:10.1002/esp. 3374
Lehning M, Bartelt P, Brown B, Fierz C. 2002a. A physical SNOWPACK model for the Swiss avalanche warning Part III: Mete-orological forcing, thin layer formation and evaluation. Cold Regions Science and Tech-nology 35: 169–184. DOI:10.1016/S0165-232X(02)00072-1
Lehning M, Bartelt P, Brown B, Fierz C, Satyawali P. 2002b. A physical SNOW-PACK model for the Swiss avalanche warn-ing: Part II. Snow microstructure. Cold Regions Science and Technology 35: 147–167. DOI:10.1016/S0165-232X(02) 00073-3
Luetschg M, Bartelt P, Lehning M, Stoeckli V, Haeberli W. 2003. Numerical simula-tion of the interacsimula-tion processes between snow cover and alpine permafrost. In Proceedings of the 8th International Conference on Permafrost, Phillips M, Springman S, Arenson L (eds). Swets & Zeitlinger: Lisse, Zurich, Switzerland; 697–702.
Luetschg M, Stoeckli V, Lehning M, Haeberli W, Ammann W. 2004. Temperatures in two boreholes at Flüela Pass, Eastern Swiss Alps: the effect of snow redistribution on permafrost distribution patterns in high mountain areas. Permafrost and Periglacial Processes 15: 283–297. DOI:10.1002/ppp. 500
Luetschg M, Lehning M, Haeberli W. 2008. A sensitivity study of factors influencing warm/thin permafrost in the Swiss Alps. Journal of Glaciology 54: 696–704. DOI: 10.3189/002214308786570881
Magnin F, Deline P, Ravanel L, Noetzli J, Pogliotti P. 2015. Thermal characteristics of permafrost in the steep alpine rock walls of the Aiguille du Midi (Mont Blanc Massif, 3842 m a.s.l). The Cryosphere 9: 109–121. DOI:10.5194/tc-9-109-2015 Mahmutoglu Y. 1998. Mechanical behaviour
of cyclically heatedfine grained rock. Rock
Mechanics and Rock Engineering 31: 169–179. DOI:10.1007/s006030050017 Matsuoka N. 2001. Direct observation of frost
wedging in alpine bedrock. Earth Surface Processes and Landforms 26: 601–614. DOI:10.1002/esp.208
Matsuoka N, Murton J. 2008. Frost weathering: Recent advances and future di-rections. Permafrost and Periglacial Pro-cesses 19: 195–210. DOI:10.1002/ppp.620 Mellor M. 1970. Phase composition of pore
water in cold rocks, CRREL Res. Rep. 292. Moore JR, Gischig V, Katterbach M, Loew S. 2011. Air circulation in deep fractures and the temperature field of an alpine rock slope. Earth Surface Processes and Land-forms 36: 1985–1996. DOI:10.1002/esp. 2217
Mott R, Schirmer M, Bavay M, Grunewald T, Lehning M. 2010. Understanding snow-transport processes shaping the mountain snow-cover. The Cryosphere 4: 545–559. DOI:10.5194/tc-4-545-2010
Murton JB, Coutard J-P, Lautridou J-P, Ozouf J-C, Robinson DA, Williams RBG. 2001. Physical modelling of bedrock brec-ciation by ice segregation in permafrost. Permafrost and Periglacial Processes 12: 255–266. DOI:10.1002/ppp.390
Murton JB, Peterson R, Ozouf JC. 2006. Bedrock fracture by ice segregation in cold regions. Science 314: 1127–1129. DOI:10. 1126/science.1132127
Noetzli J, Gruber S. 2009. Transient thermal effects in Alpine permafrost. The Cryosphere 3: 85–99. DOI:10.5194/tc-3-85-2009
Noetzli J, Gruber S, Kohl T, Salzmann N, Haeberli W. 2007. Three-dimensional distribution and evolution of permafrost temperatures in idealized high-mountain topography. Journal of Geophysical Research - Earth Surface 112: F02S13. DOI:10.1029/2006JF000545
Phillips M, Haberkorn A, Draebing D, Krautblatter M, Rhyner H, Kenner R. 2016. Seasonally intermittent water flow through deep fractures in an Alpine rock ridge: Gemsstock, central Swiss Alps. Cold Regions Science and Technology 125: 117–127. DOI:10.1016/j.coldregions.2016. 02.010
Ravanel L, Deline P, Lambiel C, Vincent C. 2013. Instability of a High Alpine Rock Ridge: the Lower Arete Des Cosmiques, Mont Blanc Massif, France. Geografiska Annaler: Series A 95: 51–66. DOI:10. 1111/geoa.12000
Richter D, Simmons G. 1974. Thermal expan-sion behavior of igneous rocks. Interna-tional Journal of Rock Mechanics and Mining Sciences & Geomechanics Ab-stracts 11: 403–411. DOI:10.1016/0148-9062(74)91111-5
Sandmeier KJ. 2012. REFLEXW Version 7.0 Manual. Karlsruhe.
Scherler M, Hauck C, Hoelzle M, Stähli M, Völksch I. 2010. Meltwater infiltration into the frozen active layer at an alpine perma-frost site. Permaperma-frost and Periglacial Pro-cesses 21: 325–334. DOI:10.1002/ppp.694 Schmid MO, Gubler S, Fiddes J, Gruber S.
2012. Inferring snowpack ripening and melt-out from distributed measurements of
near-surface ground temperatures. The Cryosphere 6: 1127–1139. DOI:10.5194/ tc-6-1127-2012
Siewert MB, Krautblatter M, Christiansen HH, Eckerstorfer M. 2012. Arctic rockwall retreat rates estimated using laboratory-calibrated ERT measurements of talus cones in Longyeardalen, Svalbard. Earth Surface Processes and Landforms 37: 1542–1555. DOI:10.1002/esp.3297 Stocker-Mittaz C, Hoezle M, Haeberli W.
2002. Modelling alpine permafrost distri-bution based on energy-balance data: a first step. Permafrost and Periglacial Processes 13: 271–282. DOI:10.1002/ ppp.426
Tharp TM. 1987. Conditions for crack propagation by frost wedging. Geologi-cal Society of America Bulletin 99: 94–102. DOI:10.1130/0016-7606(1987) 99< 94:CFCPBF > 2.0.CO;2
Wirz V, Schirmer M, Gruber S, Lehning M. 2011. Spatio-temporal measurements and analysis of snow depth in a rock face. The Cryosphere 5: 893–905. DOI:10.5194/tc-5-893-2011
Zhang T, Barry RG, Haeberli W. 2001. Numerical simulations of the influence of the seasonal snow cover on the occurrence of permafrost at high latitudes. Norsk Geografisk Tidsskrift - Norwegian Journal of Geography 55: 261–266. DOI:10.1080/ 00291950152746621
Zhang T. 2005. Influence of the seasonal snow cover on the ground thermal regime: An overview. Reviews of Geophysics 43: RG4002. DOI:10.1029/2004RG000157