HAL Id: halshs-00204699
https://halshs.archives-ouvertes.fr/halshs-00204699
Submitted on 15 Jan 2008
HAL is a multi-disciplinary open access
archive for the deposit and dissemination of sci-entific research documents, whether they are pub-lished or not. The documents may come from teaching and research institutions in France or abroad, or from public or private research centers.
L’archive ouverte pluridisciplinaire HAL, est destinée au dépôt et à la diffusion de documents scientifiques de niveau recherche, publiés ou non, émanant des établissements d’enseignement et de recherche français ou étrangers, des laboratoires publics ou privés.
Gated Communities and Homogeneity in Las Vegas and
Phoenix
Elena Vesselinov, Renaud Le Goix
To cite this version:
Elena Vesselinov, Renaud Le Goix. Gated Communities and Homogeneity in Las Vegas and Phoenix. 2007 4th International Conference on Private Urban Governance and Gated Communities. 5-8 june 2007, Jul 2007, Paris, France. pp.N/A. �halshs-00204699�
Title Gated Communities, Homogeneity and Social Distance in Las Vegas and Phoenix.
Keywords Gating, homogeneity, segregation, spatial inequality
Author (s) Elena Vesselinov (1) and Renaud Le Goix (2)
Address (1) Department of Sociology, University of South Carolina Columbia, SC 29208, USA
(2) UMR Géographie-cités, Université Paris 1, Département de Géographie, 13 rue du Four 75006 Paris - France Telephone (1) 803-777-6838 (2) +33/140464001 Fax (1) 803-777-5251 (2) +33/140464009 Mobile E-mail (1) elenav@sc.edu (2) rlegoix@univ-paris1.fr Paper no. 011
GATED COMMUNITIES, HOMOGENEITY AND SOCIAL DISTANCE
IN LAS VEGAS AND PHOENIX.
(Draft, Do Not Cite Without Permission) Abstract:
In this paper we use geographically referenced data for two metropolitan areas in the U.S. to test hypotheses about the homogeneity of gated communities and their link to segregation. Based on methodology developed by Renaud Le Goix in his study of Los Angeles area, we investigate homogeneity in three aspects: race/ethnicity, economic class and age. The results indicate that gated communities are mostly homogeneous enclaves. Their relevance to segregation patterns is structured through buffer zones: stronger social discontinuities cannot be found matching gated communities boundaries, but at a certain distance from the walls. Overall, gated communities lead to increased segregation by reinforcing the already existing levels of racial residential segregation in each metropolitan area.
GATED COMMUNITIES AND HOMOGENEITY
IN LAS VEGAS AND PHOENIX.
(Draft, Do Not Cite Without Permission)
From the early academic and public debates about gated communities until now scholars and observers have discussed the link between gating and segregation. Not surprisingly there is a wide continuum of academic arguments from scholars supporting the idea that gating is in fact a process which contributes to residential integration, to scholars believing that it is a form of exclusion and segregation. The level of disagreement partly stems from the lack of comprehensive empirical evidence related to any of the claims. In this paper we use geographically referenced data for three metropolitan areas in the U.S. to test a hypothesis that the majority of gated communities are homogeneous enclaves. This is the first step in establishing a link between gating and segregation. If indeed gating as a residential process produces mostly homogeneous communities this will lead to increased levels of segregation in urban areas, known for their diverse populations, particularly in terms of race and ethnicity. We then test a second hypothesis that gated communities increase segregation at local level.
Elaborating on a methodology developed by Le Goix in his study of segregation patterns produced by gated communities Los Angeles area (2003, 2005b), we investigate homogeneity in three aspects: race/ethnicity, economic class and age. The authors apply an index of local social distance, based on multivariate factor analysis and further utilize the concept of geographic discontinuity. Discontinuity is measured as the statistically significant level of dissimilarity between two contiguous census areas. Based on the analysis of discontinuity the authors are able to determine whether or not gated communities create significantly more homogeneous spaces compared to the surrounding neighborhoods. The research contributes to a well established line of scholarly inquiries and helps to understand better the link between gating, segregation and urban inequality. The study can also be of interest to a wider audience of policy makers, community organizations and the general public.
In the following pages we first discuss the process of gating and establish the relevance of the theory of the club economy to our research goal. The hypothesis of predominant homogeneity among gated communities is supported by this theoretical model. We then bring two other theoretical models to bear on our hypothesis: the sociological perspectives of spatial assimilation and place stratification. The two perspectives have generated a series of important empirical findings related to residential patterns in metropolitan U.S. and we find support within there context, as well. After that, in the paper, we discuss the methodology used to study our hypothesis and finally report the results from the study.
1 The Process of Gating
Gated communities have been defined spatially in two major ways, either as sub-units within more general territories or as independent spatial units. One group of scholars considers GCs as a facet of large planned communities or Common Interest Developments (McKenzie 1994, 2003; Luymes 1997; Kennedy 1995; Gordon 2004). Alternatively, others argue that the existence of fences and walls, and security features
(guards, surveillance cameras) distinguish GCs as a residential setting that is significantly different from non-gated enclaves (Blakely and Snyder 1997; Le Goix 2003; Low 2003; Vesselinov, et al., 2007).
The latter approach is more important if we want to understand the specific ways in which GCs change the residential patterns in urban America. On the one hand, a very important institutional aspect of GCs is that, like all private neighborhoods, they are characterized by homeowner associations, where elected boards oversee the common property and establish covenants, conditions, and restrictions (CC&Rs) as part of the deed. However, on the other hand, unlike CIDs, planned communities, or even individual gated residences, GCs are surrounded by a secured barrier which denies all public access not only to personal residences, but also to the area’s streets, sidewalks, and neighborhood amenities. Therefore, for the purposes of our analyses we adopt Low’s definition of a GC: “[a] residential development surrounded by walls, fences, or earth banks covered with bushes and shrubs, with a secured entrance” (Low, 2003:12).
1.1 Modern trends
Two main trends in GCs have been observed since 1970s: the privatization of entire cities and the diversification of GCs by race, class and tenure. While GCs began as individual residential neighborhoods, the concept has been expanded to encompass private urban governance of entire cities (e.g. Rolling Hills, Hidden Hills, Canyon Lake, and Leisure World, CA). In some recently incorporated cities, an important share of the residents live in GCs (Calabasas, Rancho Santa Margarita, Dana Point, all in California). This happens for two primary reasons. On the one hand, gated households aim to prevent a potential annexation by a less affluent community looking for an expanded tax base. On the other, they aim to protect local lifestyles, values, and planning control (Le Goix, 2005a). After incorporation, local affairs are shared with private homeowners associations (HOAs), which take charge of road maintenance, security and compliance with land use regulations and restrictive covenants. These “minimal cities” also reduce operation costs by contracting with the county and other public agencies to supply public services, such as police, water, sewers and fire (Miller, 1981). Instead of acting as a separate entity, minimal cities are extensions of their HOAs.
The second important trend is that gated living is no longer the exclusive option only for the very top tier of American society. Gated enclaves are spreading across middle classes, as well as across minority groups (Lang and Danielson, 1997; Grant and Mittelsteadt, 2004; Sanchez et al., 2005; Vesselinov, 2006a). In addition, Sanchez et al. (2005) find that a higher percentage of foreign-born individuals live in GCs than outside. In her study of gated communities in Southern California, Wilson-Doenges (2000) finds that GCs exist for both high-income and low-income households, a large change from the earliest GCs.
There are also recorded differences between owners and renters (Sanchez et. al, 2005; Vesselinov, 2006b). Overall, renters are more likely to select GCs compared to homeowners. Comparing whites and Latinos, Vesselinov (2006b) has found some additional differences. College educated Latino and white owners are more likely to live in GCs compared to those with lesser educational attainment, regardless of social class. Upper class Latino and white renters are more likely to select gated residences, regardless of educational attainment. On the one hand, since homeownership requires a much more serious investment of resources, the householders who have achieved this tenure status can more easily be differentiated by education than by social class. On the other hand, renters constitute a more diverse group in terms of available resources and therefore social class seems to carry more differentiating weight than education. These
differences notwithstanding, the overall conclusion from the analysis is that for Latinos and whites alike, and owners and renters alike, higher educational attainment and higher social class position increase the odds of selecting a gated residence; GCs still constitute more affluent enclaves.
1.2 Theoretical Models
1.2.1 Gated Communities as “Club Goods”
The “club economy” theory suggests that GCs are produced as territorial “club goods” in a similar fashion to private social clubs. It is argued that GCs are not public spaces, nor can they be considered as completely private spaces, because the HOAs manage public areas, streets and facilities for the collective use of many member-residents. Under the neo-classical interpretations of the private realm, the rapid growth of GCs provides support for the view that the public provision of collective goods and services is often inefficient; the residents are voting with their feet in a Tieboutean world (Foldvary, 1994). Newman’s studies for the U.S. Department of Housing and Urban Development (Newman, 1974, 1996) are often cited as evidence that gated enclaves are politically and financially sustainable institutions (Foldvary, 1994). The sustainability is ensured by the existence of the HOAs, which have three basic characteristics: (i) elected boards act as neighborhood decision makers, (ii) contracts govern resident’s behavior (CC&Rs), and (iii) monthly fees finance local amenities and services (McKenzie, 1994). Interpreting GCs as neither completely private (according to the provision of collective goods) nor public, the club economy model provides a framework to analyze the territorial management of gated enclaves.
The argument about the better efficiency of the club provision yields three underlying propositions. Firstly, compared to municipal-scale governance micro-scale collective decision making leads to a closer fit between the demand for and supply of local collective goods and services. This consensual decision making creates a certain level of social homogeneity: buyers and developers are both pushing for GCs with a level of services and amenities that fits a homogeneous set of tenants. Secondly, most local public goods are consumed by sub-sets of the wider public and are therefore better supplied as “club goods,” where members of sport or leisure clubs use facilities, such as swimming pools, golf courses, beaches, volley ball fields, airfields (Webster, 2003; Webster and Lai, 2003). Thirdly, reorganizing a public city into a city of clubs may increase funds for public bodies of government. Municipalities capitalize on this extra source of revenue by off-loading responsibilities to HOAs (McKenzie, 1994). As a consequence, the search for security is only a partial explanation of the sprawl of GCs. Gated neighborhoods have enabled public authorities to manage growth with greater fiscal sustainability. It is documented that in California (McKenzie, 1994; Le Goix, 2005a), gating is highly correlated with fiscal gaps progressively experienced by local government bodies.
The “club economy” perspective leads to the conclusion that GCs are mostly homogeneous enclaves. On one hand, security features incur substantial cost for gated homeowners: for infrastructure and maintenance. This economic selection of residents tends to produce social homogeneity. On the other hand, the private access guarantees the exclusive use of a site, based on similar needs and preferences, which is also leads to homogeneity. If GCs are homogeneous then they will lead to higher segregation, which is considered by many scholars to be one of the territorial outcomes of gating.
1.2.2 Spatial Assimilation Model
The spatial assimilation perspective poses that as minorities accumulate more cultural, social and economic capital the chances that they will enter more affluent, middle-class, white neighborhoods increase. Since suburban neighborhoods exhibit these characteristics (Logan and Schneider, 1982) the process of spatial assimilation is most pronounced in these areas. As Alba and Logan argue (1991:432) “suburbanization is an important indicator to the extent to which minorities are becoming integrated more fully into society.” In many ways choosing a GC residence resembles entering a more affluent white neighborhood because GCs have historically functioned as wealthy white enclaves (Blakely and Snyder, 1997; Low, 2003). Some of the earlier evidence about the process of spatial assimilation comes from the work of Massey and Mullan (1984), who show that, when blacks and Latinos move into an area that is predominantly white, succession sometimes occurs. In the case of Latinos however, the residential choice of whites often depends on the specific characteristics of the Latinos moving into the area: assimilation more readily occurs for Latinos and Asians of higher socioeconomic status (Massey and Mullan, 1984; Logan, Alba, and Leung, 1996; Alba et al., 1999). At the same time Alba, Logan, and Stults (2000) find that in three metropolitan areas, Los Angeles, Miami, and San Francisco, the majority status of whites within the suburbs is diminishing. This trend may indicate future patterns; as the number of Latinos continues to increase rapidly, they may be living in suburban neighborhoods comprised mostly of other Latinos, or possibly other minorities.
Therefore, based on the spatial assimilation model it seems likely that some of the most affluent Latinos and Asians would join whites in suburban gated residences (homogeneity based on income). At the same time, moving into a predominantly white gated or non-gated suburban neighborhood is not the only option for upwardly mobile minorities: affluent minority members may be establishing their own suburban ethnic communities, including GCs (which then will also be homogeneous based on race/ethnicity).
1.2.3 Place Stratification Model
According to Alba and Logan (1991:432) the stratification model is warranted by the racial segmentation of housing markets, which has been widely confirmed in the experiences of blacks (Massey and Denton, 1993; Oliver and Shapiro, 1995; Briggs, 2005), as well as Latinos (Betancur, 1996; Logan, Alba, and Leung, 1996; Alba, Logan, and Stults, 2000; Kandel and Cromartie, 2003).
The persistent level of black-white residential segregation has been given a central place in the scholarly literature. The explanations about such trends focus on consistent housing discrimination on the part of the white majority and array of federal government policies (Galster, 1988; Massey and Denton, 1993; Oliver and Shapiro, 1995). Black-white segregation in metropolitan U.S. has been continuously high (Massey and Denton, 1989) and across social classes. Middle-class blacks are somewhat less segregated from whites than poor blacks, but the whites they share neighborhoods with are less affluent (Alba, Logan and Stults, 2000). While Massey and Denton (1989, 1993) argue that, overall, blacks are much more segregated from whites than Latinos, other research shows that both blacks and Latinos are more segregated from whites than Asians (Social Structures for Social Sciences, 2001). A study of the most recent trends in
segregation illustrates that black-white segregation has declined at the national level between 1980 and 2000, but the average of 65 percent in 2000 is the highest among all minorities. At the same time, in metropolitan areas, Latino-white and Asian-white segregation has increased to 52 and to 42 percent respectively (Logan, Stults and Farley, 2004).
Between 1970 and 1980 and again in the 1990s, Hispanic-white segregation was much below the level of black segregation, but it has substantially increased in many urban areas where the population of Hispanic immigrants has been growing (Massey and Denton, 1987; Logan, Alba, and Leung, 1996). Therefore, while Latinos continue to migrate to the U.S. and often select areas where there is a pre-existing large Latino population, they face greater residential segregation in these areas.
Latinos and blacks also face increasingly acute economic segregation in the 1980s (Massey and Eggers, 1993; Abramson, Tobin and VanderGoot, 1995; Jargowsky, 1996). Although the levels of economic segregation (regardless of the measure used) for whites, blacks and Latinos are generally much lower compared to levels of racial residential segregation, they are increasing for all groups since 1970 (Jargowsky, 1996:990). According to the author, this finding is robust across many metropolitan areas which differ substantially in their economic base, housing, and poverty trends. The levels of racial and economic residential segregation for blacks mean that it will be rather unusual to find even affluent blacks among whites in the same GCs. Moreover, the historical legacy of discrimination and segregation further makes blacks unlikely candidates to participate in such residential enclosures with whites. Among the minorities blacks are least likely to gate (Sanchez, et al., 2005; Vesselinov, et al., 2007) and our expectation is that they will be least likely to share GCs with whites. Among Asians and Latinos the most affluent members may select to join whites in GCs. However, the residential preferences and ethnic enclave experiences among Asians and Latinos may lead to consolidation of their own (homogeneous) GCs rather then sharing such communities with whites.
2 Gating and Segregation
As research shows, gating and segregation are both tightly connected to the issues of land use regulations and exclusionary zoning, especially in the areas where residential subdivisions are being developed. Literature has extensively demonstrated how neighborhood movements, close-knit local residential governance and exclusionary zoning produce increased segregation (Purcell, 1997; Ihlanfeldt, 2004).
There is a rather consistent tendency in GCs research to link gating as a residential process with segregation (Blakely and Snyder, 1997; Caldeira, 2000; Low, 2003; Blandy et al., 2003; Le Goix, 2003, 2005b; Gordon, 2004; Atkinson and Flint, 2004; Manzi and Smith-Bowers, 2005; Vesselinov, 2006a). A continuum of arguments exists about the similarities of the two processes, which stretches from scholars contending that gating is a process of private residential choices, which leads to integration (Manzi and Smith-Bowers, 2005), to scholars arguing that gating is an extension of segregation (Caldeira, 2000). The empirical evidence that support any of the arguments however is quite limited; therefore the proposed research will make an important contribution by empirically examining the structural link between gating and segregation.
At the one end of the spectrum, Manzi and Smith-Bowers (2005:348) regard GCs as examples of “the growth of privately owned collective goods such as shopping malls, business parks, golf clubs, etc.” The authors present two case studies where upper scale GCs are constructed in lower income areas, arguing in favor of those areas’
integration. At the other end of the continuum, Low’s (2003) study, conducted in two GCs, in San Antonio, TX, and in Queens, NY, shows that many GC residents fear non-specified “others” from “outside the gates” and this fear justified the move into a GC. Low discovered that GC residents were especially concerned about “ethnic change” in the neighborhoods they moved from and had covert concerns about social order, social control, xenophobia, and ethnocentrism.
In a California area study, Gordon (2004) investigates the link between planned developments and residential segregation. Using data from the 1990 STF3A and public reports filed with the California Department of Real Estate, the author concludes that the planned developments are, on average, less diverse with respect to race, but more diverse in respect to income. The author finds that the contribution of planned developments to overall metropolitan segregation is minor. Since GCs are included in the larger category of planned developments, the results relate to GCs only by association.
2.1 Research Design and Methods
Overall, the empirical evidence collected so far is inconclusive about the impact of GCs on urban areas. Le Goix’s (2003; 2005b) research methodology constitutes a comprehensive approach to the study of GCs, but is limited to Los Angeles metropolitan area. Le Goix studies 219 GCs in the Los Angeles region, based on Thomas Guides Maps and Census 2000 (SF1 and SF3). This research shows that (1) the combined effects of property values and socio-economic structure create more segregation between gated block groups and abutting areas than in non-gated neighborhoods. (2) GCs are twice as likely to be separated by age characteristics than other neighborhoods. (3) Findings show that GCs are less likely to be segregated by race or ethnicity than other neighborhoods at a local scale. This papers aims at presenting new evidences, based on the same research design, in two other metropolitan areas, so that we might ultimately, compare Phoenix and Las Vegas with Los Angeles ; the interest being to compare three of the most dynamic metropolitan areas in South Western regions.
2.1.1 A GIS of gated communities:
Using Geographical Information System (GIS) we have identified the exact location of GCs in Phoenix and Las Vegas, available through Thomas Guides®1, the same way it has been done in Le Goix’s research (2003). We then match the newly constructed data for GCs with Census data at block group level. Using data from Census 20002 will then
allow to identify the characteristics of the population living within and outside of the gated areas.
1 The Thomas Guides®. The company publishes interactive maps that identify gated streets and gated
neighborhoods. These files also provide information on military bases, airfields, airports, prisons, amusement parks and colleges, some of which may also contain private streets with restricted access. The data set used in this paper has been obtained by Elena Vesselinov and is licensed to University of South Carolina.
2 2000 Census data, SF1 anda SF3. The 100 percent file (SF1) is used for estimating the percent of
2.1.2 A local social distance index : a spatial analysis of social distance between census block groups.
The analysis at the neighborhood level primarily measures the social distance between residents of one gated census block groups and adjacent (gated or non-gated) census block groups. Segregation, concentration and dissimilarity indices are known to be sensitive to spatial autocorrelation (Apparicio, 2000; Grasland, et al., 2000; Dawkins, 2004). It is well know that these indices usually ignore spatial patterns, depending on the level of spatial autocorrelation (White, 1983; Massey and Denton, 1989; Dawkins, 2004). To study segregation patterns at a local level, we therefore need to implement a function of distance in the measure to account for the gradient and the proximity effects, either a metric distance (Euclidian) or topological distance (adjacency). The proposed local social distance index (SDI) accounts for spatial autocorrelation issues, as it measures the level of social discontinuity between two adjacent block groups. When can then compare the SDI between gated areas and abutting block groups, to SDIs computed between block groups located in non-gated areas.
Hypotheses: As earlier mentioned, private governance leads to an implicit selection of the owners. Homogeneity of the neighborhood is ensured through design guidelines, age restrictions or a selective club membership. The first hypothesis to test in this study is that GCs are mostly homogeneous enclaves. The second hypothesis is related to the link between gating and segregation. The process of gating and the exclusiveness create a border. The border separates two territorial systems: the territorial system of the GC, and the urban space where it is located. We expect to estimate the effect of gating over social segregation, relying on the following assumption: if the overall differentiations occurring between gated enclaves and their vicinities are higher than the differentiations usually observed in the urban area between two adjacent neighborhoods, then there is a high probability that GCs indeed produce increased segregation.
Methods: Factorial axis will be provided by a multivariate analysis (principal component analysis) at the level of census block groups. Contributing independent variables will help defining the main factorial axis of the PCA results. The most contributing factorial axis will be used to measure the local social distance between adjacent block groups. The spatial analysis in this part aims at measuring the impact of topological distance (like a border) on social distance. This method was successfully implemented to study the differentiation processes produced by national borders on demographic patterns (Decroly and Grasland, 1992; Grasland, Mathian, & Favaro, 2000) and differentiation processes produced by school social patterns (François, 1998). It is now widely used for European Union planning policies (ESPON) to produce a multilevel analysis of inequalities and social patterns (Grasland and Lizzi, 2003).
It is nevertheless challenging to evaluate the effects of gating on segregation patterns for three reasons:
- Firstly, it is assumed that social patterns in GCs are almost consistent with their neighborhood, in order to insure the attractiveness of the development for potential buyers. As a consequence the method seeks to sort out the effects of walls and gates on each social characteristic (age, race, economic status). It relies on a multivariate analysis (principal component analysis or factor analysis) to test whether a GC boundary fits any sensitive shift in the statistical definition of social areas. Indeed, although GCs locate within a social environment that is close to their own social characteristics, the gating of the area delineates a “snob value” (Blakely and Snyder, 1997), and a slight
change in status, in age, etc. For instance, within a Hispanic middle-class neighborhood with a certain level of diversity in age, property values, etc., a GC will be home of middle-class Hispanics, with homogeneous property values and probably older and/or wealthier residents than in the immediate surroundings.
- Secondly, the implementation of this test relies on a function of distance based on the adjacency between census areas. Classical segregation indices fit well the needs of an analysis at metropolitan geographical level, but do not work as well when studying segregation at local geographical level (Apparicio, 2000) because spatial patterns, gradients and spatial autocorrelation interfere with the results.
To address this problem we use a local social distance index (Decroly and Grasland, 1992; François, 1998; 2002). The index equals the difference between the two contiguous areas i and j on a continuous factor X. The factor X is extracted from the factor analysis, and describes the relative coordinates of each area on a factorial axis produced by the joint effect of all independent variables. A discontinuity means that there is a statistically significant level of dissimilarity between two contiguous block groups. It is mapped as a segment materializing the level of discontinuity, and compared with GCs’ boundary layout.
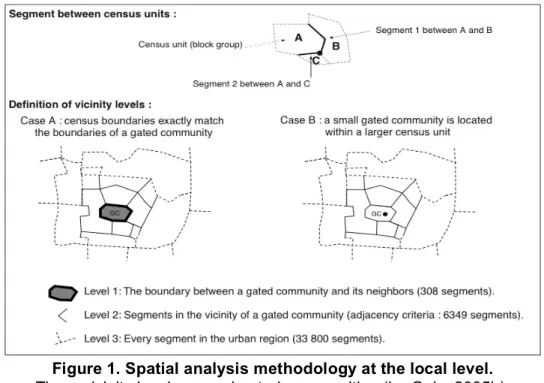
Figure 1. Spatial analysis methodology at the local level.
Three vicinity levels around gated communities (Le Goix, 2005b).
Number of segments provided in the case study of Los Angeles.
Thirdly, a lot of GCs are only a small part of a block group. Two different subsets of data were built : gated block groups (Figure 3, case A) and non-gated block groups. We will also consider a third subset of data, taking into considerations block groups where small GCs are located (Figure 3, case B).
The method does not consider the block group spatial entity, but the unique boundary separating two adjacent block groups, called segments. As shown on Figure 1, this allows a multilevel analysis of segregation given three spatial contexts:
(1) A first vicinity level applies to the segments between a GC and its immediate
surrounding, where block groups’ and GCs’ definitions perfectly fit each other (case A). In this case, this vicinity level will account for the discontinuities associated with every large GC, and how they differ from abutting communities.
(2) A second vicinity level characterizes the dissimilarities observed in the
environment where a GC is located. We test whether the stronger discontinuity is produced by a GC or by its surrounding neighborhoods. The latter means that a GC might be surrounded by a very homogeneous social or ethnic buffer zone. This level is defined both by the segments in contact with block groups adjacent to the precedent level (case A), and by the segments of any block group where a small GC is located (case B).
(3) A third vicinity level encompasses every segment observed between adjacent
block groups for the entire metropolitan region. A local social distance index is statistically significant if above the mean for the metropolitan areas.
3 Different gated communities, different metropolitan areas,
different differentiation patterns.
3.1 Block groups, social patterns and local homogeneity.
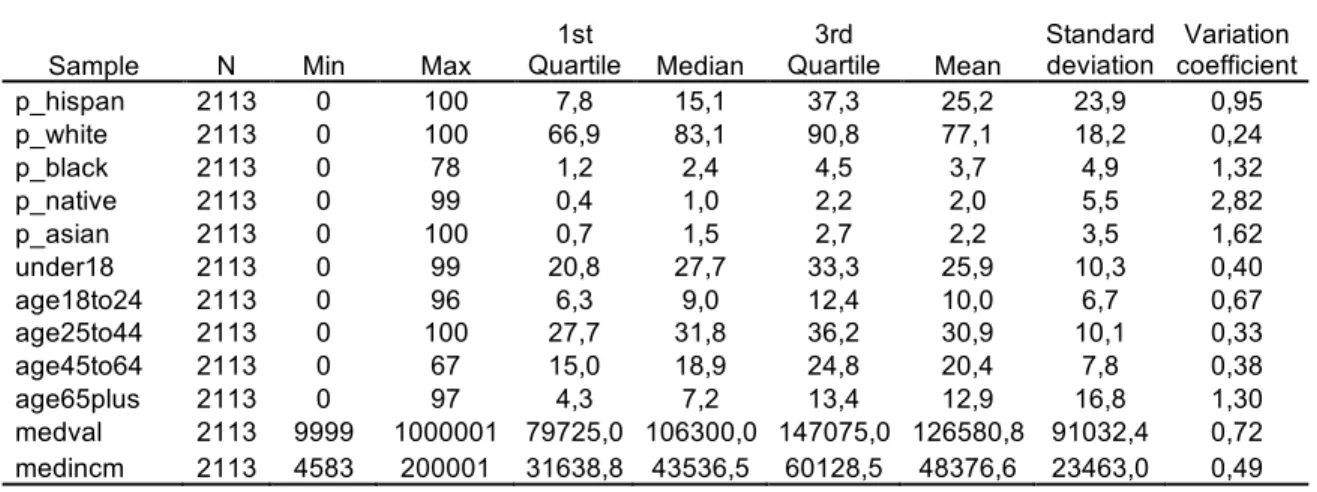
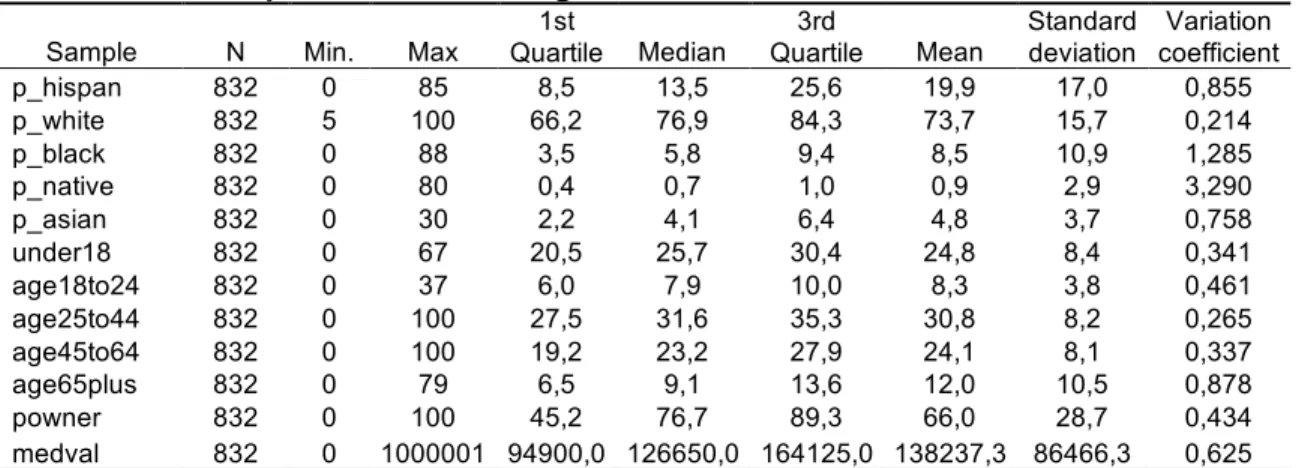
Three main characteristics of the socio-economic differentiation are analyzed, using the following variables for each block group in each metropolitan region studied in 2000: (1) Socio-economic status: median property value; percent of owner-occupied housing units; (2) Race: percent Whites; percent Hispanics, percent Blacks; percent Asians; percent Native Americans; (3) Age: percent of people less than 18 years old; percent 18-24; percent 25-44; percent 45-64; percent more than 65 (Table 1a and 1b).
Table 1a. Descriptive statistics, Phoenix
Sample N Min Max
1st Quartile Median 3rd Quartile Mean Standard deviation Variation coefficient p_hispan 2113 0 100 7,8 15,1 37,3 25,2 23,9 0,95 p_white 2113 0 100 66,9 83,1 90,8 77,1 18,2 0,24 p_black 2113 0 78 1,2 2,4 4,5 3,7 4,9 1,32 p_native 2113 0 99 0,4 1,0 2,2 2,0 5,5 2,82 p_asian 2113 0 100 0,7 1,5 2,7 2,2 3,5 1,62 under18 2113 0 99 20,8 27,7 33,3 25,9 10,3 0,40 age18to24 2113 0 96 6,3 9,0 12,4 10,0 6,7 0,67 age25to44 2113 0 100 27,7 31,8 36,2 30,9 10,1 0,33 age45to64 2113 0 67 15,0 18,9 24,8 20,4 7,8 0,38 age65plus 2113 0 97 4,3 7,2 13,4 12,9 16,8 1,30 medval 2113 9999 1000001 79725,0 106300,0 147075,0 126580,8 91032,4 0,72 medincm 2113 4583 200001 31638,8 43536,5 60128,5 48376,6 23463,0 0,49
Table 1b. Descriptive statistics, Vegas
Sample N Min. Max Quartile Median 1st
3rd
Quartile Mean Standard deviation
Variation coefficient p_hispan 832 0 85 8,5 13,5 25,6 19,9 17,0 0,855 p_white 832 5 100 66,2 76,9 84,3 73,7 15,7 0,214 p_black 832 0 88 3,5 5,8 9,4 8,5 10,9 1,285 p_native 832 0 80 0,4 0,7 1,0 0,9 2,9 3,290 p_asian 832 0 30 2,2 4,1 6,4 4,8 3,7 0,758 under18 832 0 67 20,5 25,7 30,4 24,8 8,4 0,341 age18to24 832 0 37 6,0 7,9 10,0 8,3 3,8 0,461 age25to44 832 0 100 27,5 31,6 35,3 30,8 8,2 0,265 age45to64 832 0 100 19,2 23,2 27,9 24,1 8,1 0,337 age65plus 832 0 79 6,5 9,1 13,6 12,0 10,5 0,878 powner 832 0 100 45,2 76,7 89,3 66,0 28,7 0,434 medval 832 0 1000001 94900,0 126650,0 164125,0 138237,3 86466,3 0,625
The Principal Component Analysis (PCA) demonstrates the very high structuring of socio-spatial segregation in both cities: 4 factors describe 70% of total variance between block groups.
In Phoenix (Table 2a and 2b) and Las Vegas (Table 3a and 3b), the first factor explains more than one third of total variance (respectively 36,5 % and 36,9 %). It describes the socio-economic contrasts associated with race and age: White, aged and wealthy neighborhoods of owners, in opposition to the young, Hispanic or Black districts. In previous studies, this was also how factor 1 described patterns in the Los Angeles area (Le Goix, 2003), such findings being consistent with almost all studies on social areas in US cities since Bell and Sevky (1955).
A second factor stands for another 14,4% of total variance in Phoenix, and 13,4% in Las Vegas. Interpretation is also consistent with other comparable studies, as factor 2 describes the mixed components of age and life-cycle (owners, renters, family with children or single adult population). It isolates on one hand the effect of persons between 25 and 44 years old with children (under 18), living in areas with percentage of owners ; and on the other end the socio-spatial isolation of retired population (more than 65 years old).
Factors 3 and 4 both yield different interpretation, depending on the city. Phoenix’ profiles is very close to Los Angeles’ in previous research: it isolates the effect of racial segregation in the middle class. In Phoenix, it discriminates Hispanics and Asian, along with age criteria, everything being equal regarding the social status. In Las Vegas, however, the social structuring of Sin City is driven by the labor market, highly specialized in the game, gambling and shows industries, and indeed favors employment of a younger population than in any other city. The consequence is that factor 3 in Las Vegas isolates on one hand family with children and on the other hand young adults (18-25 years old) neighborhoods, South and West of the Strip.
Factor 4, in Las Vegas, takes into account the same ethnic segregation effect regardless of social status. Once again, Las Vegas shows a rather specific pattern, with a spatial association of Hispanic and White, opposed to Black persons, with no significant effect of wealth and ownership. In Phoenix, factor 4 isolates the very significant presence of Native Americans in the area, opposed to all other categories in this city.
Table 2a. PCA Eigenvalues and variance in Phoenix
Factor Eigenvalue variance % cumulative 1 4,381 36,51 36,51 2 1,733 14,44 50,95 3 1,335 11,13 62,08 4 0,966 8,05 70,14
Table 2b. Definition of factors 1 to 4 in Phoenix
Eigenvectors
Squared cosines of the
variables Contribution F1 F2 F3 F4 F1 F2 F3 F4 F1 F2 F3 F4 p_white -0,858 0,176 -0,216 -0,091 0,735 0,031 0,047 0,008 0,168 0,018 0,035 0,009 p_hispan 0,763 -0,226 0,379 -0,151 0,582 0,051 0,144 0,023 0,133 0,030 0,107 0,023 p_black 0,513 -0,153 0,093 -0,205 0,263 0,023 0,009 0,042 0,060 0,014 0,007 0,043 p_native 0,321 -0,180 0,078 0,904 0,103 0,032 0,006 0,817 0,023 0,019 0,005 0,845 p_asian 0,073 0,393 -0,496 -0,030 0,005 0,154 0,246 0,001 0,001 0,089 0,184 0,001 under18 0,617 0,427 0,555 -0,029 0,381 0,182 0,308 0,001 0,087 0,105 0,231 0,001 age18to24 0,672 -0,058 -0,487 0,020 0,452 0,003 0,237 0,000 0,103 0,002 0,178 0,000 age25to44 0,556 0,600 -0,251 -0,023 0,309 0,360 0,063 0,001 0,071 0,208 0,047 0,001 age45to64 -0,730 0,229 0,163 0,147 0,533 0,053 0,026 0,022 0,122 0,030 0,020 0,022 age65plus -0,644 -0,705 -0,071 -0,044 0,415 0,497 0,005 0,002 0,095 0,287 0,004 0,002 medval -0,443 0,508 -0,003 0,213 0,197 0,258 0,000 0,045 0,045 0,149 0,000 0,047 powner -0,636 0,296 0,495 -0,071 0,404 0,087 0,245 0,005 0,092 0,050 0,183 0,005
Table 3a. PCA Eigenvalues and variance in Las Vegas
Factor Eigenvalue Variance % Cumulative 1 4,427 36,9 36,9 2 1,607 13,4 50,29 3 1,326 11,06 61,35 4 1,0497 8,75 70,1
Table 3b. Definition of factors 1 to 4 in Las Vegas
Eigenvectors
Squared cosines of the
variables Contribution F1 F2 F3 F4 F1 F2 F3 F4 F1 F2 F3 F4 p_white -0,816 0,322 -0,132 -0,336 0,665 0,103 0,017 0,113 0,150 0,064 0,013 0,108 p_hispan 0,716 -0,246 0,065 -0,251 0,512 0,060 0,004 0,063 0,116 0,038 0,003 0,060 p_black 0,513 -0,361 0,324 0,630 0,263 0,130 0,105 0,397 0,059 0,081 0,079 0,378 p_native 0,093 -0,163 0,115 -0,459 0,009 0,027 0,013 0,211 0,002 0,017 0,010 0,201 p_asian 0,059 0,337 -0,616 0,400 0,003 0,113 0,379 0,160 0,001 0,070 0,286 0,153 under18 0,629 0,381 0,577 -0,032 0,396 0,145 0,333 0,001 0,089 0,090 0,251 0,001 age18to24 0,780 -0,075 -0,316 -0,157 0,609 0,006 0,100 0,025 0,138 0,003 0,075 0,023 age25to44 0,631 0,545 -0,285 -0,041 0,398 0,297 0,081 0,002 0,090 0,184 0,061 0,002 age45to64 -0,791 -0,142 -0,038 0,118 0,626 0,020 0,001 0,014 0,141 0,012 0,001 0,013 age65plus -0,669 -0,594 -0,098 0,024 0,448 0,352 0,010 0,001 0,101 0,219 0,007 0,001 powner -0,552 0,405 0,525 0,018 0,305 0,164 0,275 0,000 0,069 0,102 0,207 0,000 medval -0,439 0,437 0,086 0,253 0,193 0,191 0,007 0,064 0,044 0,119 0,006 0,061
3.2 Social walls
3.2.1 Gated communities profiles
Assuming the social patterns within census block groups is reasonably homogeneous; Maps 1 and 2 give a first insight of social patterns in gated communities and in their local environment. In Phoenix, more than half of block groups with GCs are located within average profile, middle class White and Asian neighborhoods, yet another evidence of the social diffusion of residential enclosure which cannot be conceived anymore as a real estate product for the most privileged ones. About one fifth of GCs are defined as very wealthy and upper-class White and older population. A small minority of gated communities also seem to develop in Hispanic and Black neighborhoods. Map shows that larger enclaves are located in White and wealthier areas, whereas smaller tracts are in-fill developments closer to central areas populated with Black and Hispanic communities.
Las Vegas GCs profile indicates a stronger homogeneity between the different kinds of gated developments. There are almost no small infill development like seen in Phoenix, and almost all gated areas are developed on the Western side of the metropolitan area, and some of them are located on the South-East corner. With almost no central location for GCs, social patterns are consistent with spatial patterns, being close to white, aged population (45-65 years old, with higher property values), as described on map 2. Gates and walls seem to correspond to the very powerful effect of racial patterns, with very high racial contrasts within a very short range of distance from gated enclaves. Nevertheless, age profiles in GCs seem to be quite diverse, which yields the hypothesis that developers propose different kind of services and amenities according to the targeted age of prospective residents.
3.2.2 Local increase of segregation
The factorial axis, being a continuous scale, allows a comparison of the relative position of block groups. For each segment between two adjacent block groups, we construct a Social Distance Index (SDI), calculating the difference between block groups’ eigenvalues for each factor. Considering the absolute value of the SDI, the higher the absolute value is, the stronger the discontinuity.
SDIs were calculated for each of the four factors previously described, for each of the three vicinity groups of segments (Figure 1). Table 4 summarizes the number of segments between block groups for each metropolitan area studied, and for each geographical level analyzed.
Table 4. Number of boundaries between census block groups for each geographical level.
Los Angeles* Phoenix Las Vegas
Number of block groups 12549 2113 832
Number of line segments between BGs:
Level 1. Gated communities, boundaries 308 95 162 Level 2. In the vicinity of GC 6349 1600 1203 Level 3. All block groups in metro area 33800 5301 2173
*Data for the Los Angeles area provided for comparison purpose. See Le Goix, 2005b for detailed results.
Map 1. Gated communities in their socio-economic environment and level of discontinuities produced in their vicinity in Phoenix.
Map 2. Gated communities in their socio-economic environment and level of discontinuities produced in their vicinity in Las Vegas.
SDIs are mapped so that we can visualize the level of social discontinuity produced in gated areas. The “noodles” drawing provides qualitative information regarding the shape of the discontinuities, under the assumption that a continuously shaped discontinuity outlines an independent territorial system with a strong social homogeneity highly differentiated from the outside, whereas a poorly shaped discontinuity would only outline a subsystem included within a larger territorial system (i.e. a municipality). Where the shapes of discontinuities are simple and circumscribe the walls, it clearly demonstrates that gated communities actually build a specific territorial system within their urban environment. Within a wide range around gated communities, the shapes of the discontinuities are rather complex and depend on the shape of census block boundaries. They nevertheless act as evidences of major discontinuities within a certain range from the walls, thus including some gated communities within a buffer zone of homogeneous social patterns (Decroly and Grasland, 1992; François, 1998; Le Goix, 2003, 2005b). We are thus able to determine whether a block group containing one or more GCs is more likely to be more homogeneous than other abutting BGs in the vicinity; and by doing so builds a social wall that appears as a significant level of discontinuity. In such a case, if the SDI is above the average of SDIs in the whole metropolitan area, maps can be interpreted according to the width of the line segment, which directly translates the strength of the social wall separating one BG and another (SDIs mapped according to Standard Deviation above average).
Socio-economic gradients and buffer zones
At first glance, GCs do not appear to systematically produce significant discontinuities (Level 1), and this is for two reasons. First, the classical core-periphery socio-economic gradient is very powerful in producing strong inequalities between block groups. It is a well acknowledged fact that classical segregation patterns are already so strong that GCs might only have marginal and very local effects on these spatial patterns.
Second, GCs in Las Vegas and Phoenix reproduce a pattern in their location choice that can be described as a “buffer zone” effect: GCs’ developers obviously locate their proposed schemes according to socio-spatial patterns, which prospective buyers are fully aware of. Indeed, most GCs are just located within very homogeneous neighborhoods, and this location within a buffer zone is not incidental, but rationally promoted by the developers choosing locations within an environment protected from the deterrent effects of social and ethnic diversity for the prospective buyers (Le Goix 2005b). This profound trend was found in GCs in Southern California, and evidences in Phoenix and Las Vegas concur with previous findings.
According to factor 1 (socio-economic status associated with race and age), this buffer zone effect is obvious in the North-East sector of Phoenix, where dozens of small and large GCs are located in a close-knit pattern; they produce almost no discontinuity with neighbors which have very comparable socio-economic profiles. We observe the same local system of homogeneity in the South-West part of Las Vegas, as well as in the south part, where most GCs are located within rose-colored areas of the map. This homogeneity effect is reinforced when observing factor 2 maps (life cycle and effect of age): the North East part of Phoenix and the Western part of Las Vegas seem very homogeneous.
Strong discontinuities around gated communities
The buffer-zone effect is reinforced when observing the numerous significant discontinuities mapped in lighter blue shades (Level 2). Significant SDIs may be observed in the close vicinity of GCs, especially where no significant SDI appear around
one specific GC (Level 1). This is, for instance, the case in the central-eastern and South-East sides of Phoenix metro (factors 1, 2 and 3), where numerous very significant Level 2 discontinuities appear, demonstrating that GCs are indeed located within an homogeneous environment, but a “social wall” is located at a topological distance of one or two block group from the GC. In Las Vegas, this effect is obvious in central-North and eastern district of the city (factors 2, 3 and 4): these neighborhoods are more ethnically diverse than on Westside-Las Vegas, and GCs were indeed produced as small infill developments and urban renewal strategies (McKenzie, 2005): the “social wall” does not lie between one specific GC and its neighbors, but indeed between the homogenous area were the GC is located and abutting block groups.
Some discontinuities actually fit GCs’ boundaries
At last, in some cases, strong discontinuities actually fit the walls of GCs (mapped in dark blue shades). These cases are rare for at least three reasons:
- First, according to data used, only few GCs can be matched to BGs as “Level 1” case studies : there are only 14 block groups with boundaries actually matching GCs’ boundaries in Phoenix, and 19 cases in Las Vegas ;
- Second, many very large GCs are part of a larger block group, along with other kind of gated or non-gated residential developments of various kind, that can only be described as Level 2 GCs. There is no easy way to recover this loss of information by allocating population and socio-economic profile to these GCs, without knowledge from a field survey regarding homogeneity or diversity within each of these block groups. This might be a sensitive bias of our analysis on the urban edge areas, were BGs tends to be larger and may encompass several residential schemes of various kinds as well as rural and/or desert areas.
- Finally, many GCs do not produce strong discontinuities around the totality of their boundaries, but in most of the case on one or two sides only. Nevertheless, the few cases of discontinuities found between a gated block group and abutting neighborhoods are very significant, and quite often more than one or two standard deviation(s) above the average (see for instance the case of one large GC located North of Phoenix; another one on the South-east-side; and some other cases in Western Las Vegas). It is to be mentioned that these rare discontinuities often occur for different factorial dimensions at the same place, thus demonstrating the strong social structuring of these enclaves.
3.3 Do gated communities increase segregation?
The influence of gates and walls on segregation is summarized Table 5. It compares the statistical distribution of SDIs for each of the three geographical levels: segments that match gated communities boundaries (Level 1); segments around block groups where one or more GCs are located (Level 2); and all segments, at the metro level for comparison purpose.
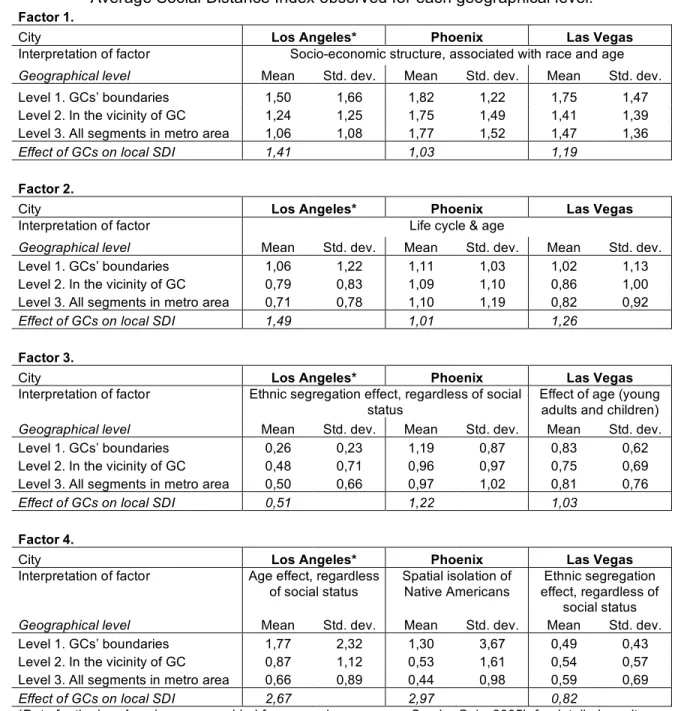
Table 5. Level of discontinuities.
Average Social Distance Index observed for each geographical level.
Factor 1.
City Los Angeles* Phoenix Las Vegas
Interpretation of factor Socio-economic structure, associated with race and age
Geographical level Mean Std. dev. Mean Std. dev. Mean Std. dev.
Level 1. GCs’ boundaries 1,50 1,66 1,82 1,22 1,75 1,47 Level 2. In the vicinity of GC 1,24 1,25 1,75 1,49 1,41 1,39 Level 3. All segments in metro area 1,06 1,08 1,77 1,52 1,47 1,36
Effect of GCs on local SDI 1,41 1,03 1,19
Factor 2.
City Los Angeles* Phoenix Las Vegas
Interpretation of factor Life cycle & age
Geographical level Mean Std. dev. Mean Std. dev. Mean Std. dev.
Level 1. GCs’ boundaries 1,06 1,22 1,11 1,03 1,02 1,13 Level 2. In the vicinity of GC 0,79 0,83 1,09 1,10 0,86 1,00 Level 3. All segments in metro area 0,71 0,78 1,10 1,19 0,82 0,92
Effect of GCs on local SDI 1,49 1,01 1,26
Factor 3.
City Los Angeles* Phoenix Las Vegas
Interpretation of factor Ethnic segregation effect, regardless of social status
Effect of age (young adults and children)
Geographical level Mean Std. dev. Mean Std. dev. Mean Std. dev.
Level 1. GCs’ boundaries 0,26 0,23 1,19 0,87 0,83 0,62 Level 2. In the vicinity of GC 0,48 0,71 0,96 0,97 0,75 0,69 Level 3. All segments in metro area 0,50 0,66 0,97 1,02 0,81 0,76
Effect of GCs on local SDI 0,51 1,22 1,03
Factor 4.
City Los Angeles* Phoenix Las Vegas
Interpretation of factor Age effect, regardless of social status Spatial isolation of Native Americans Ethnic segregation effect, regardless of social status
Geographical level Mean Std. dev. Mean Std. dev. Mean Std. dev.
Level 1. GCs’ boundaries 1,77 2,32 1,30 3,67 0,49 0,43 Level 2. In the vicinity of GC 0,87 1,12 0,53 1,61 0,54 0,57 Level 3. All segments in metro area 0,66 0,89 0,44 0,98 0,59 0,69
Effect of GCs on local SDI 2,67 2,97 0,82
In Phoenix, the impact of gated communities on segregation seems relatively low compared to previous results in Los Angeles. Indeed, according to factor 1 and 2, socio-economic and life-cycle discontinuities between a GC (Level 1) and abutting block group is only 1,03 times more important than the average discontinuity at the metro level. Nevertheless, on factor 3, Phoenix’s GCs are more likely to build stronger discontinuities than any other BG’s vicinity in the rest of the metro area. According the ethnic segregation, regardless of social status, Phoenix’s GCs build “social walls” an average 1,22 times stronger than the average SDI at the metro level. Furthermore, in a regional context where persons of Native American origin are likely to reside in urban areas, Phoenix’s GCs produce a segregation level on Factor 4 (Spatial isolation of Native Americans) 2,91 times more important than the average at the metro level.
The reason why Phoenix’ GCs do not produce stronger SDI than metropolitan average patterns on factor 1 and 2 remains a speculative question, but a reasonable hypothesis would be that the segregation structuring of Phoenix being already so strong, GCs do not produce a significant shift in local socio-economic patterns at the block group level. The SDI being a standardized index, it might be useful to compare SDI in Phoenix and Los Angeles on factor 1: socio-economic segregation patterns, at all of the 3 levels, appear stronger in Phoenix than in Los Angeles (for level 3: 1,06 in L.A; 1,77 in Phoenix).
In Las Vegas, segregation patterns produced by gates and walls (Level 1) and around GCs (Level 2) are much more comparable with patterns previously found in Los Angeles. On factor 1, the socio-economic SDI is 1,19 time higher near GCs than in the rest of the metro area ; on factor 2 (life cycle and age), GCs contribute to produce social differentiation patterns 1,26 times stronger than at the metro level. Whereas no substantial effect can be demonstrated on factor 3, we must mention than results on Factor 4 are consistent with previous findings in L.A. GCs in Vegas (factor 4) as well as in Los Angeles (factor 3) are not associated with race segregation. In Las Vegas, the average SDI for ethnic segregation regardless of social status is 0,82 lower than at the metro level. This concur in demonstrating that considering ethnic/racial status alone, GCs indeed locate within very homogeneous neighborhoods, and discriminate from their adjacent communities on the basis of age and socio-economic status.
Conclusion
According to our spatial analysis of social distance the study of Phoenix and Las Vegas leads to several conclusions. First, the majority of GCs are built within areas of certain level of racial/ethnic and socio-economic homogeneity. Therefore, the study finds support for our first hypothesis. Secondly, it seems that GCs contribute to increased segregation. Our conclusion is that GCs reinforce the levels of residential segregation in Phoenix and Las Vegas. As shown in the analysis, GCs reinforce the segregation patterns through buffer zones: stronger social discontinuities cannot be found matching GCs boundaries, but at a certain distance of the walls. In terms of our second hypothesis, it seems that the evidence from this study support the place stratification model. GCs influence both the levels of racial and economic residential segregation. Thirdly, the residential patterns produced through the process of gating considerably differ in each metropolitan are studied. In Phoenix, where core-periphery segregation patterns are very strong, GCs have a marginal effect on producing local segregation patterns, the more sensitive being the exclusion of Native Americans from gated and locked-in “small worlds”. In Las Vegas, GCs contribute to create more homogeneous
worlds according to socio-economic and age dimension, the same way Los Angeles’ gated communities do.
In conclusion, it must be said that at a local level GCs follow the overall racial/ethnic patterns, specific to the level of racial residential segregation at each specific metropolitan area. Such a conclusion reiterates the importance of local buffer zone strategies, raised by developers, prospective buyers, municipalities and other actors of real estate markets: at a local level, GCs are homogeneous enclaves, within homogeneous neighborhoods in terms of ethnic and racial status. This statement clearly demonstrates the heritage of racial strategies and spatial patterns in urban development, real estate markets, and urban governance.
References
Abramson, A. J., M. S. Tobin, and M. R. VanderGoot, 1995, “The Changing Geography of Metropolitan Opportunity: The segregation of the Poor in U.S. Metropolitan Areas, 1970-1990,” Housing Policy Debate, 6:45-72.
Alba, Richard D. and John R. Logan, 1991, “Variations on Two Themes: Racial and Ethnic Patterns in the Attainment of Suburban Residence,” Demography, 28:431-53. Alba, Richard D, John R. Logan, and Brian J. Stults, 2000, “The Changing Neighborhood Contexts of the Immigrant Metropolis,” Social Forces, 79:587-621.
Alba, Richard D., John R. Logan, Brian Stults, Gilbert Marzan, and Wenquan Zhang, 1999, “Immigrant Groups in the Suburbs: A Reexamination of Suburbanization and Spatial Assimilation,” American Sociological Review, 64:446-60.
Apparicio, P., 2000, “Indices of residential segregation: a tool integrated in geographical information system,” Cybergeo 134. Retrieved August 1, 2006 (http://www.cybergeo.presse.fr).
Atkinson, Rowland and John Flint, 2004, “Fortress UK? Gated Communities, The Spatial Revolt of the Elites and Time-Space Trajectories of Segregation,” Housing Studies, 19:875-892.
Betancur, John J., 1996, “The Settlement Experience of Latinos in Chicago: Segregation, Speculation, and the Ecology Model,” Social Forces, 74:1299-1324. Blakely, Edward J. and Mary G. Snyder, 1997, Fortress America: Gated communities in the United States, Washington, D.C.; Brookings Institution Press.
Blandy, Sarah, Diane Lister, Rowland Atkinson, and John Flint, 2003, “Gated
Communities: A Systematic Review of the Research Evidence,” CNR Paper 12: ESRC Center for Neighborhood Research. Retrieved July 31, 2006
(http://www.bristol.ac.uk/sps/cnrpaperspdf/cnr12sum.pdf).
Briggs, Xavier de Souza, 2005, The Geography Of Opportunity: Race and Housing Choice in Metropolitan America, Washington, D.C.: Brookings Institution Press.
Caldeira, Teresa P. R., 2000, City of Walls: Crime, Segregation and Citizenship in Sao Paolo, Berkeley, CA: University of California Press.
Decroly J. M. and Claude Grasland, 1992, “Frontières, systèmes politiques et fécondité en Europe, ” Espace, Populations et Sociétés, 2:135-152.
Foldvary, Fred, 1994, Public Goods and Private Communities: the Market Provision of Social Services, Aldershot: Edward Elgar.
Francois Jean-Christophe, 1998, “Discontinuités territoriales et mise en évidence des systèmes spatiaux dans l'espace des collèges de l'agglomération parisienne”, L'Espace Géographique, vol. 27, n° 1, 63 - 75.
________, 2002, “Ressemblances et proximités : un point de vue sur le contexte théorique de la notion de discontinuité géographique, ” Cybergeo
http://www.cybergeo.presse.fr, n° 214, 13 p.
Galster, George, 1988, “Residential Segregation in American Cities: A Contrary Review,” Population Research and Policy Review, 7:93-112.
Gordon, Tracy M., 2004, “Moving up by Moving Out? Planned Developments and Residential Segregation in California,” Urban Studies, 41:441-461.
Grant, Jill and Lindsey Mittelsteadt, 2004, “Types of gated communities,” Environment and Planning B: Planning and Design, 31:913-930.
Grasland Claude, Mathian Hélène, and Vincent Jean Marc, 2000, “Multiscalar analysis and map generalisation of discrete social phenomena : statistical problems and political consequences”, Statistical Journal of the United Nations ECE, 17, IOS Press, 1-32. Grasland, Claude and Liliane Lizzi, 2003, “ESPON Project 3.1 Integrated Tools for European Spatial Development - Annex A: Multiscalar territorial Analysis (3rd version).” ESPON: 61. Retrieved August 4, 2006
(http://www.espon.eu/mmp/online/website/content/projects/260/714/index_EN.html). Helsley, Robert W. and William C. Strange, 1999, “Gated Communities and Economic Geography of Crime,” Journal of Urban Economics 46:80-105.
Jargowsky, Paul A., 1996, “Take the Money and Run: Economic Segregation in U.S. Metropolitan Areas,” American Sociological Review 61:984-998.
Kandel, William and John Cromartie, 2001, “New Patterns of Hispanic Settlement in Rural America”, United States Department of Agriculture - Rural Development Research Report #99. Washington, D.C.: U.S. Government Printing Office.
Kennedy, David J., 1995, “Residential Associations as State Actors: Regulating the Impact of Gated Communities on Nonmembers,” The Yale Law Journal, 105:761-793. Lacour-Little, Michael and Stephen Malpezzi, 2001, Gated Communities and Property Values, Madison, WI: Wells Fargo Home Mortgage and Department of Real Estate and Urban Land Economics - University of Wisconsin.
Lang, Robert and K. Danielsen, 1997, “Gated Communities in America: Walling Out the World,” Housing Policy Debate, 8:867-899.
Le Goix, Renaud, 2002, “Les gated communities en Californie du Sud, un produit immobilier pas tout à fait comme les autres”, L'Espace Géographique, vol. 31, n° 4, 328-344.
________, 2003, Les gated communities aux Etats-Unis. Morceaux de villes ou territoires à part entière [Gated communities within the city in the US: Urban
neighborhoods, or territories apart?]. Department de Géographie. Paris: Université Paris 1 Panthéon - Sorbonne. 491 p. Available on the internet at:
http://tel.ccsd.cnrs.fr/documents/archives0/00/00/41/41/index_fr.html.
________, 2005a, “Gated communities as predators of public resources: the outcomes of fading boundaries between private management and public authorities in southern California”, in Private Neighbourhoods: Global and local perspectives, GLASZE G., WEBSTER C. J. et FRANTZ K., Eds.: Routledge, Taylor and Francis.
________, 2005b, “Gated Communities: Sprawl and Social Segregation in Southern California,” Housing Studies, 20( 2) :323-344.
Logan, John R., Richard D. Alba, and Shu-Yin Leung, 1996, “Minority Access to White Suburbs: A Multiregional Comparison,” Social Forces, 74:851-881.
Logan, John R. and Mark Schneider, 1982, "Governmental Organization and Changing City-Suburban Income Inequality," Urban Affairs Quarterly, 17:303-318.
Logan, John. R., Brian J. Stults, and Reynolds Farley, 2004, “Segregation of Minorities in the Metropolis: Two Decades of Change,” Demography, 41:1-22.
Low, Setha, 2003, Behind the Gates: Life, Security, and the Pursuit of Happiness in Fortress America, New York: Routledge.
________, 2003a, “Imprisoned by the Walls Built to Keep ‘the Others’ Out,” Los Angeles Times, December 19, 2003, p. B11.
Luymes, Donald, 1997, “The Fortification of Suburbia: Investigating the Rise of Enclave Communities,” Landscape and Urban Planning, 39:187-203.
Manzi, Tony and Bill Smith-Bowers, 2005, “Gated Communities as Club Goods: Segregation or
Social Cohesion?” Housing Studies, 20:345-359.
Massey, Douglas S. and Nancy A. Denton, 1987, “Trends in the Residential Segregation of Blacks, Hispanics, and Asians: 1970-1980,” American Sociological Review, 52:802-825.
________, 1989, “Hypersegregation in U.S. Metropolitan Areas: Black and Hispanic Segregation Along Five Dimensions,” Demography, 26:373-91.
________, 1993, American Apartheid: Segregation and the Making of the Underclass, Cambridge: Harvard University Press.
Massey, Douglas S. and Mitchell L. Eggers, 1993, “The Spatial Concentration of Affluence and Poverty during the 1970s,” Urban Affairs Quarterly, 29:299-315. Massey, Douglas S. and Brendan P. Mullan, 1984, “Processes of Hispanic and Black Spatial Assimilation,” American Journal of Sociology, 89:836-73.
McKenzie, Evan, 1994, Privatopia: Homeowner Associations and the Rise of Residential Private Government, New Haven, CT: Yale University Press.
________, 2003, “Common-Interest Housing in the Communities of Tomorrow,” Housing Policy Debate, 14(1&2):203-134.
________, 2005, “Constructing the Pomerium in Las Vegas: A Case Study of Emerging Trends in American Gated Communities,” Housing Studies, 20:187-203.
Miller, Gary J., 1981, Cities by Contract, Cambridge, MA: The MIT Press.
Newman, Oscar, 1972, Defensible Space: Crime prevention through Urban Design, New York: MacMillan.
________, 1996, Creating Defensible Space. Washington, D.C. : U.S. Department of Housing and Urban Development, Office of Policy Development and Research, Institute for Community Design Analysis, Center for Urban Policy Research, Rutgers University., 126 p.
Oliver, Melvin L. and Thomas M. Shapiro, 1995, Black Wealth/White Wealth: A New Perspective on Racial Inequality, New York: Routledge.
Sanchez, Thomas W., R. Lang, and Dawn M. Dhavale, 2005, “Security versus Status? A First Look at the Census’s Gated Community Data,” Journal of Housing Education and Research 24: 281-91.
Spatial Structures for Social Sciences. 2001. “The New Latinos: Who They Are, Where They Are.” Retrieved July 31, 2006
(http://browns4.dyndns.org/cen2000_s4/HispanicPop/HspReport/HspReportPage1.html). Vesselinov, Elena, Matthew A. Cazessus and William W. Falk, 2007, “Gated
Communities and
Spatial Inequality,” Journal of Urban Affairs, 29(2) (Lead Article)
Vesselinov, Elena, 2006a, “Members Only: Gated Communities and Residential Segregation in Metropolitan U.S.” Accepted for publication in Sociological Forum. ________, 2006b, “Gated Communities and Latino Groups: Segregation, Integration or Fashion Choice?” Manuscript Under Review.
Webster, Chris, 2003, “The Nature of the Neighbourhood,” Urban Studies, 40 (13): 2591-2612.
Webster, Chris J., and Lawrence Wai-Chung Lai, 2002, Property Rights, Planning and Markets: Managing Spontaneous Cities: Cheltenham UK and Northampton MA, USA: Edward Elgar.
Wilson-Doenges, Georjeanna, 2000, “An Exploration of Sense of Community and Fear of Crime in Gated Communities,” Environment and Behaviour, 32:597-611.