Realising the potential of herbarium records for conservation biology
M. Greve
a,b,⁎
,1, A.M. Lykke
c, C.W. Fagg
d, R.E. Gereau
e, G.P. Lewis
f, R. Marchant
g, A.R. Marshall
g,h,
J. Ndayishimiye
i,j,2, J. Bogaert
k, J.-C. Svenning
aa
Section for Ecoinformatics & Biodiversity, Department of Bioscience, Aarhus University, Ny Munkegade 114, DK-8000 Aarhus C, Denmark
b
Department of Plant and Soil Sciences, University of Pretoria, Private Bag X20, Pretoria 0002, South Africa
c
Terrestrial Ecology, Department of Bioscience, Aarhus University, Vejlsøvej 25, DK-8600 Silkeborg, Denmark
d
Herbário UB e Faculdade de Ceilândia, Instituto de Ciências Biológicas bloco 9, 1o piso, Universidade de Brasília, Campus Darcy Ribeiro Asa Norte, Brasilia DF, 70910-900, Brazil
e
Missouri Botanical Garden, P.O. Box 299, St. Louis, MO 63166-0299, USA
fComparative Plant & Fungal Biology Department, Royal Botanic Gardens, Kew, Richmond, Surrey, TW9 3AB, UK g
York Institute of Tropical Ecosystems and Centre for Integration of Research, Conservation and Learning, Environment Department, University of York, York YO10 5DD, UK
h
Flamingo Land Ltd., Malton, N Yorkshire, UK
i
Service d'Ecologie du Paysage et Systèmes de Production Végétale, Université Libre de Bruxelles, 50 Avenue F.D. Roosevelt, CP 169, B-1050, Bruxelles, Belgium
j
Département de Biologie, Université du Burundi, Burundi
k
Université de Liège, Gembloux Agro-Bio Tech, Unité Biodiversité et Paysage, Passage des Déportés, 2 B-5030, Gembloux, Belgium
a b s t r a c t
a r t i c l e i n f o
Article history: Received 20 August 2015
Received in revised form 4 January 2016 Accepted 11 March 2016
Available online 18 May 2016 Edited by J Van Staden
One of the major challenges in ecosystem conservation is obtaining baseline data, particularly for regions that have been poorly inventoried, such as regions of the African continent. Here we use a database of African herbar-ium records and examples from the literature to show that, although herbarherbar-ium records have traditionally been collected to build botanical reference“libraries” for taxonomic and inventory purposes, they provide valuable and useful information regarding species, their distribution in time and space, their traits, phenological characteris-tics, associated species and their physical environment. These data have the potential to provide invaluable infor-mation to feed into evidence-based conservation decisions.
© 2016 SAAB. Published by Elsevier B.V. All rights reserved.
Keywords: Biological collections Database Historical records Label information Long-term data collections Trait
1. Introduction
Globally, biodiversity is increasingly under threat due to changes in land use, climate and socio-economic factors. There is thus an increasing need for the long-term monitoring of biodiversity to ensure its effective conservation (Magurran et al., 2010). Few such monitoring projects have been in place for extended periods of time, particularly across the tropics and in the southern hemisphere (Magurran et al., 2010). Many countries have suffered from longfinancial and political instability
and may lack up-to-date knowledge of their biodiversity (e.g.Figueiredo et al., 2009). Particularly in these areas it may be difficult to obtain base-line knowledge of species, communities and ecosystems with which to monitor how climate, land use and livelihood changes are affecting bio-diversity, and thus to make informed conservation decisions (Lister, 2011). While the possibility exists to obtain data from oldfield-based studies, re-visit the sites of these studies, and repeat the sampling proce-dures to compare current and historical biodiversity (e.g.Thiollay, 2006), such inventory data are often scarce and difficult to obtain, and “thinking-outside-the-box” methods are called for (Sparks, 2007). More specifically, biological collections, though often not systematically collected (see Appendix A), have the potential to provide a variety of in-formation not only about individual species, but also about their commu-nities and habitats (Sparks, 2007).
One of the main, and original, purposes of herbarium collections is to serve as taxonomic‘repositories’: storing specimens allows users to re-turn to them over decades and centuries to check the identification of plants and study the characteristics of the given species. Reference col-lections used to identify species, to describe new species, or to produce
⁎ Corresponding author at: Department of Plant Science, University of Pretoria, Private Bag X20, Pretoria 0002, South Africa. Tel.: +27 12 4202487.
E-mail addresses:michelle_greve@yahoo.com(M. Greve),aml@bios.au.dk
(A.M. Lykke),acaciafagg@gmail.com(C.W. Fagg),roy.gereau@mobot.org(R.E. Gereau),
g.lewis@kew.org(G.P. Lewis),robert.marchant@york.ac.uk(R. Marchant),
any.marshall@york.ac.uk(A.R. Marshall),ndayishimiye_joel@yahoo.fr(J. Ndayishimiye),
j.bogaert@ulg.ac.be(J. Bogaert),svenning@bios.au.dk(J.-C. Svenning).
1
Present address: Department of Plant and Soil Sciences, University of Pretoria, South Africa.
2
Present address: Département de Biologie, Université du Burundi, Burundi.
http://dx.doi.org/10.1016/j.sajb.2016.03.017
0254-6299/© 2016 SAAB. Published by Elsevier B.V. All rights reserved.
Contents lists available atScienceDirect
South African Journal of Botany
j o u r n a l h o m e p a g e :w w w . e l s e v i e r . c o m / l o c a t e / s a j bclassifications of related species based on their morphological (e.g.Ross, 1973)– and, more recently, also genetic (e.g.Beck and Semple, 2015)– characteristics are of crucial importance for taxonomic purposes. Existing herbarium collections also house species awaiting description (Bebber et al., 2010). The taxonomic role of herbaria remains essential for measuring and setting conservation challenges and priorities (e.g.Rivers et al., 2010), as most conservation targets are based on taxon diversity (e.g.Küper et al., 2006) and, to a lesser extent, taxonom-ic relatedness (Winter et al., 2013); without the knowledge of what en-tails a species, such target-setting becomes impossible.
Over time, plant collections have been deposited in herbaria for various other functions besides understanding taxonomic relationships: to illustrate variation in morphology, to preparefloras and monographs, to provide voucher specimens for medicinal research and, by assembling data on phenology, to maximise the collection of fertile material of spe-cial significance to seed collections. Nevertheless, new purposes for her-barium specimens frequently arise, so that they are utilized for purposes for which they were initially not intended (Pyke and Ehrlich, 2010).
Here, we illustrate, using a case study, the contributions that herbar-ium specimens can make to providing a range of baseline data in space, thereby adding to the understanding and monitoring of biodiversity which can directly be used for conservation purposes. This work sum-marizes and builds on several previous studies that have emphasized the uses of herbarium data (e.g.Elith and Leathwick, 2007; Kalema, 2008; Loiselle et al., 2008; Cherry, 2009; Aikio et al., 2010; Pyke and
Ehrlich, 2010; Vorontsova et al., 2010; Greve and Svenning, 2011). We
employ an extensive dataset of African Acacia (sensu lato, including Senegalia, Vachellia and Faidherbia) for this purpose (Greve et al., 2012). In addition, we highlight the role that herbarium collections can make to monitoring biodiversity in time in the discussion. 2. Materials and methods
A large database of herbarium records of African Acacia was set up
(Greve et al., 2012) using the BRAHMS databasing system (Filer,
2011). The database contains the majority of the collections housed in the following herbaria: National Botanical Garden of Belgium (BR), University of Coimbra (COI), East African Herbarium (EA), Royal Botanic Gardens Kew (K), Instituto de Investigação Científica Tropical (LISC), Missouri Botanical Garden (MO), and PRECIS data, which contains the digitized information of South African herbaria, mostly those of the National Herbarium of South Africa (PRE), Compton Herbarium (NBG) and KwaZulu-Natal Herbarium (NH), as well as extensive collections from several other African and European herbaria. In all, the database consists of approximately 31,000 unique entries, of which approximately 23,000 are georeferenced. The database not only contains the specimen identity data, but, for most specimens, the label information of the collec-tions. This label information includesfields such as dates of collections, identity of collectors, geographical descriptors, characteristics of the plant, habitat information and common or local names, depending on what the collector recorded, and, for specimens not digitized by us, on what was copied from the labels into the database.
The collection locality of most herbarium specimens is indicated on the herbarium labels. Where GPS coordinates are not provided with the collection locality, the description locality can often be used to georeference the collection location using gazetteers and other map-ping tools. This was done for the Acacia database: specimens that had no GPS coordinates associated with them were georeferenced if their locations could be determined with some accuracy (locations had to me more accurate than to district level).
To show the mapping application of herbarium specimens, the dis-tribution of Acacia sieberiana DC was mapped in several different ways. All georeferenced A. sieberiana specimens were extracted from the Acacia database. Initially, the collection localities of A. sieberiana were mapped. As such raw collection localities only provide information on the specific areas where individual specimens have been collected,
they provide limited information on where species could potentially occur. Thus, a second map of A. sieberiana was produced using boosted regression tree modelling (BRTs), a species distribution modelling tech-nique, to better present the distribution of A. sieberiana across Africa. Models were constructed following the methods presented inElith et al. (2008). All georeferenced localities of A. sieberiana were extracted from the Acacia database. Nine descriptors of environmental conditions were used to model the distribution of the species: altitude (Earth
Resources Observation and Science, 1996), annual mean temperature,
maximum temperature of the warmest month, mean temperature of the warmest quarter, annual precipitation, precipitation seasonal-ity, precipitation of the driest quarter, precipitation of the coldest quarter (Hijmans et al., 2005) andfire incidence, a measure of the number of years an area burnt between 2000 and 2007, derived
fromTansey et al. (2008). More details on model settings are
provid-ed in Appendix A.
Knowledge of the relationship between organisms and their envi-ronment allows predictions to be made of how distributions might shift under a climate change scenario. Therefore, we used the BRT model to project the distribution of A. sieberiana into the future (2080) using the UKMO-HadCM3 model under an A1B scenario (IPCC, 2007). For the future projections, the current climate variables on which the model had been trained were replaced with the equivalent climate variables for the future. To understand which areas will become more and less favourable for A. sieberiana in the future, the current prob-abilities of occurrence of the species were subtracted from the future probabilities.
To map a plant characteristic, the labels of all A. sieberiana specimens were searched for information on tree height. All specimens that had information on estimated tree height were extracted and mapped, with the locality records labelled to represent tree height.
Herbarium specimens can also provide information about plant phenology. Some of the herbarium specimens of A. sieberiana were examined to record presence offlowers, and for specimens that could not be accessed in herbaria, label information was examined for an indi-cation that the trees from which these specimens had been collected were inflower at time of collection. Because each herbarium specimen was associated with a collection date, the spatial distribution offlowering phenology (i.e. month offlowering) for the species that were in flower at the time of collection could be mapped in space.
Best practices in specimen label writing include recording informa-tion about the specimen's environment. Therefore, herbarium collec-tions can also provide information about the environment. As an example, we mapped a soil type, namely vertisols, across Africa. This was done by searching the Acacia database for the word‘vertisol’ or one of the synonyms of vertisols (‘cracking clays’, ‘black cotton soils’, ‘basalt clay’ and ‘black clay’:Spaargaren, 2008). In addition, the distribu-tion of an African vegetadistribu-tion type– Combretum woodlands – was plot-ted. Again, a search for the word‘Combretum’ was made in the label information column of the Acacia database, and all records of Acacia specimens that were described as growing in a locality where one or several Combretum species were dominant were extracted from the Acacia database. Using the geographic coordinates of the Acacia specimens associated with the extracted soil type and the extracted vegetation type, they could both be mapped.
Finally, we illustrated how information about species other than the collected specimens may be obtained from herbarium labels, using the widespread mopane tree, Colophospermum mopane (Benth.) Léonard, as an example. First, we extracted locality records for C. mopane from the Global Biodiversity Information Facility (GBIF;www.gbif.org), as this is a data portal that is widely used for plotting species distributions at large spatial scales, and plotted these locality records. We then addi-tionally extracted all localities where Acacia specimens were recorded to be growing in association with C. mopane from the Acacia database by searching the label information of the database for‘Colophospermum’ and‘mopane’.
3. Results and discussion
Probably the best-known‘secondary’ purpose of herbaria is to better understand the geographic distributions of species (Pyke and Ehrlich, 2010). Because localities and dates of collection are usually provided on herbarium labels, it is possible to map the distribution of species in space and time. This is especially valuable across large geographic areas, which may otherwise be difficult to survey (e.g.Hassan and Styles, 1990; Holmgren and Poorter, 2007; Platts et al., 2010; Greve et al., 2012; Marshall et al., 2012). Indeed, herbarium records are of growing importance as foundation evidence in global assessments such as IUCN RED listing (e.g.IUCN Standards and Petitions Subcommittee, 2014) and the emerging Intergovernmental Platform on Biodiversity and Ecosystem Services (IPBES) Initiative. Originally, mapping was limit-ed to the individual localities where specimens had been collectlimit-ed (i.e.
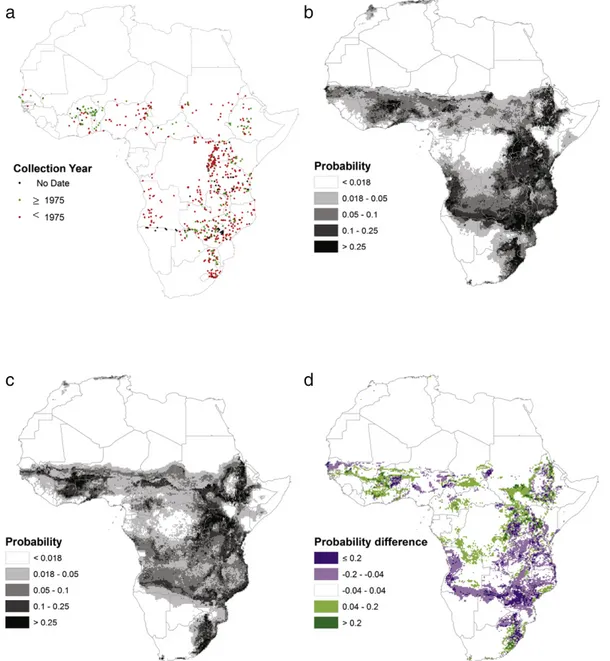
producing“dot-maps”, e.g.Fig. 1a). This has been used to, for example, identify regions of high diversity and thus conservation concern (e.g.
Kreft and Jetz, 2007) or evaluate the contribution of protected areas to conserving biodiversity (e.g.Wieringa and Sosef, 2011).
With the development of large-scale environmental datasets such as climate and remote sensing datasets, species distribution models have increasingly been used to map contiguous species distributions (e.g.Blach-Overgaard et al., 2010; Marshall et al., 2012) based on the re-lationship between species occurrences and environmental factors such as climate, land use and soil (Guisan and Zimmermann, 2000). Species distribution models built on locality records also provide the basis for predicting how species will respond to expected changes in their environment, such as climate change or habitat loss and degradation (e.g.Cuni Sanchez et al., 2011). As an illustration we modelled the cur-rent and, under a given climate scenario, predicted future distribution of
a
c
b
d
≥ <Fig. 1. Acacia sieberiana is mapped at an African scale from georeferenced locality data on herbarium labels (a). Collections from prior to 1975, from 1975 onwards and with an unknown date are indicated. Using boosted regression tree modelling, the distribution of A. sieberiana under current climate (b) and as predicted for 2080 (c) by the UKMO-HadCM3 model under an A1B scenario (IPCC, 2007) is also shown. The legend stipulates the probabilities with which the species has been predicted by a boosted regression tree model (b and c). The AUC value of the cross-validated models was 0.888, which is considered to be good (Elith, 2000). The difference between the probability of occurrence for future and current distributions is shown in (d): green areas represent regions where A. sieberiana is more likely to occur in the future than currently, and purple areas regions where the ranges of the species may be threatened as the climate becomes less favourable for the species.
A. sieberiana across Africa (Fig. 1b–c). In addition to showing the current and predicted future distribution of the species, we could highlight areas where conditions are expected to become more or less suitable for the species in the future (Fig. 1d). Thus, mapping species from herbarium re-cords allows us not only to understand the biogeography of species, but also to assess the threats they face under a variety of scenarios.
Because collectors often provide additional information about the plant and its environment on herbarium labels (e.g. for A. sieberiana in our database approximately 60% of label records contained such infor-mation), such collections inform not only about geographic variation of the collected species, but potentially also of species characteristics and the environment in which specimens were collected (Pyke and Ehrlich, 2010). For example, we used the Acacia database to illustrate
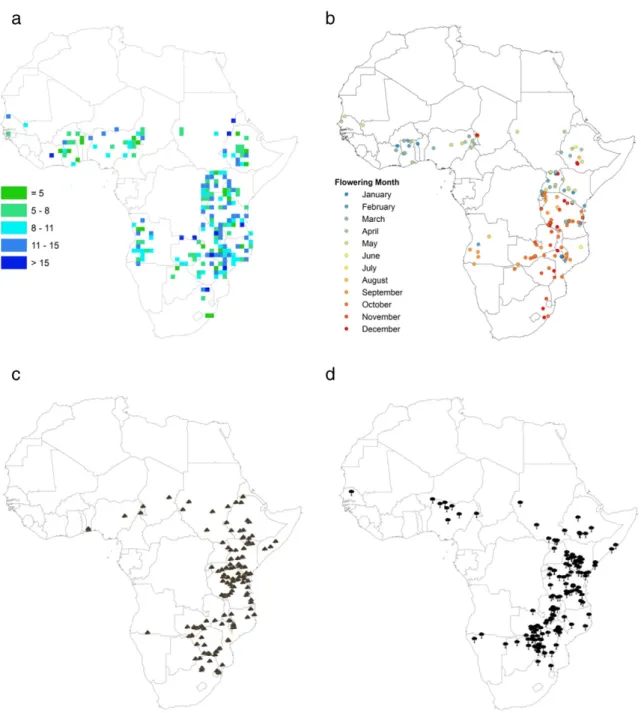
how information about the distribution of a plant trait, namely tree height, can be derived from herbarium labels. Tree height, which is an elemental aspect of tree architecture and of great ecological conse-quence for the plant (Westoby, 1998; Archibald and Bond, 2003), is one trait that is often reported on herbarium labels. Here, we mapped the mean recorded height of A. sieberiana across its distribution range in Africa (Fig. 2a). Tree height represents a trait which might respond to climate change or human disturbances such as frequentfires or wood collection (Foden, 2002). Historical herbarium data of this trait might thus, for example, serve as a baseline for changes in functional traits over time.
Geographic variation in phenology related to, for example,flowering and fruiting can be gleaned from specimen labels or specimens
Fig. 2. Herbarium specimens can be used to map species traits and information about the environment. The mean height of Acacia sieberiana in each degree unit according to herbarium labels (a), and variation in the timing offlowering of Acacia sieberiana across the African continent (b) is shown. In addition, locality records of vertisol soils (c) and Combretum woodlands (d) from information on the herbarium labels of Acacia specimens are mapped. Combretum woodlands were classified as such if defined as Combretum woodlands/bushlands, or if Combretum species were mentioned as one of at the most three dominant tree species at a locality.
themselves (Proença et al., 2012). Here we show how theflowering phenology of A. sieberiana varies across its range (Fig. 2b), with southern treesflowering in the early austral summer, while east and west African treesflower earlier in the year. (This is partially consistent with subspe-cies designation; Appendix A, Fig. S1.)
Herbarium labels also have the potential to provide information about the distribution of various environmental factors associated with the collections, also at large spatial scales. As an example, we mapped both a soil type, namely vertisols, and the distribution of a major vegetation type– Combretum woodlands (Fig. 2c–d) from the Acacia database. The maps of vertisol and Combretum woodland distri-butions are by no means complete– they depend on where collections were made, and on whether collectors had the habit of recording these characteristics; they do, however, have the potential to augment existing data sources, and be interpolated to produce contiguous maps. Knowl-edge of the distribution of such environmental factors is not only valu-able for e.g. assessing conservation status of soils and vegetation types, but can also be valuable for mapping taxa associated with them– in the present and the future (e.g.Preston et al., 2008). In addition, site details such as soils and altitudes can also help in matching sites where seed could be successfully planted in restoration or plantation programmes.
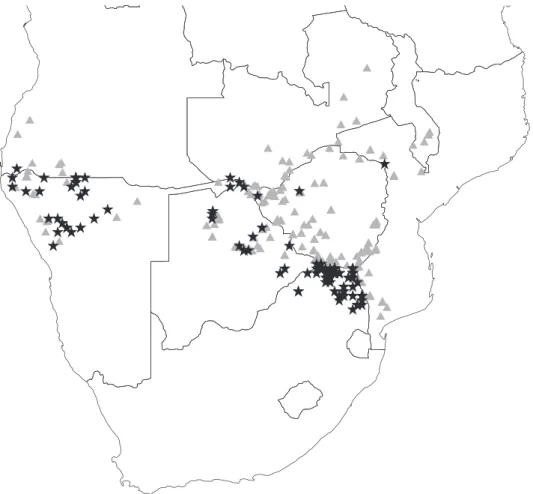
Additionally, information about species other than the collected specimens may be obtained from herbarium labels. Colophospermum mopane is widely distributed across the northern regions of southern Africa. However, a search for the species on GBIF produces a map of lo-calities restricted mainly to South Africa, Botswana and Namibia, which arefloristically better sampled and databased, while collections of the species from the important north-eastern regions of its distribution are either not databased, or the species is undersampled in the region
(Fig. 3). On the other hand, the C. mopane-associated records from the Acacia herbarium records provide several additional known localities for C. mopane in Zimbabwe, Zambia and Mozambique particularly, where GBIF records of the species are scarce (Fig. 3). Such methods of gaining distributions for associated species from herbarium labels are mainly useful for species that dominate vegetation or are conspicuous, and are easily identifiable (to ensure observer reliability in the absence of voucher specimens).
Finally, it should be mentioned that some regions of the world have been poorly inventoried in terms of biodiversity and ecology and, in some cases, are rarely revisited by botanists due to logistical or political reasons. The collections of A. sieberiana illustrate this for Angola, which was engaged in a civil war for many years. Most Angolan Acacia herbar-ium specimens of this species were collected prior to 1975, with most areas unsurveyed since this date (Fig. 1a). Herbarium specimens can be an invaluable (and sometimes only) source of biodiversity infor-mation for such regions. However, even in areas that have been more recently studied, basic biodiversity information is often missing, and herbarium data canfill some of these gaps, as shown above.
3.1. Temporal information
While we have focussed on the spatial applicability of herbarium specimens, they also have extensive uses for monitoring temporal changes in the environment. Mapping herbarium records in time has been explored less, particularly in Africa (Cherry, 2009). Yet, because herbarium specimens are dated, there is great potential to better explore temporal trends in biodiversity. Mapping changes over time is especially pressing in the face of extensive global change affecting biodi-versity and society (IPCC, 2014). One expected consequence of climate
Fig. 3. Map of the northern regions of southern Africa showing localities of Colophospermum mopane obtained from the Global Biodiversity Information Facility (black stars), and from label information of Acacia herbarium specimens (grey triangles).
change is that species ranges will shift to track changing climate (Staudinger et al., 2012). In an African example,Wittig et al. (2007)
use herbarium specimens to illustrate how the distributions of Sahelian species have changed over time: their ranges have shifted southwards since the 1970s as the region has become drier, indicating tracking of climate. Herbarium specimens, along with other data sources, have also been used to reveal changes in species composition due to agricul-tural activities around Mount Kenya (Kindt et al., 2007).
Herbarium specimens have also been used to track temporal chang-es in the phenological traits of specichang-es. Changchang-es in the phenology of some species are of particular concern, as it might result in mismatches between the phenology of these species and other species with which they interact, e.g. between theflowering period of plants and their pol-linators (Staudinger et al., 2012). Indeed, several studies have shown earlier onset offlowering in recent years that correspond to changes in climate (Sparks, 2007; Rawal et al., 2015).
Pauw and Hawkins (2011)cleverly employed herbarium specimens
from an orchid group to highlight the population decline of their associ-ated pollinator: a bee species. The pollinarium of these orchids breaks off during pollination. The authors recorded the proportion of the flowers of herbarium specimens that had lost their pollinarium, and could thereby show a decrease in pollination incidence, and thus bee populations, over time.
4. Synthesis
The examples above summarise possible uses of herbarium records for gathering a variety of information about collected species, their asso-ciated species and their general environment. Accessing this informa-tion is becoming increasingly feasible as herbaria are digitized and their data become available through shared portals such as the GBIF. Possible shortcomings (e.g. collection biases, data inaccuracies and unverifiability) of using herbarium specimens for purposes for which they were not originally collected should be considered to ensure data reliability (see Appendix A). Nevertheless, the value of herbarium spec-imens for conservation should not be underestimated. In order to con-serve populations, species and ecosystems, we need to understand their distributions, characteristics and environments– all information that can be gleaned from herbarium labels. Thanks to good practices in specimen cataloguing, herbarium data can be used for obtaining a va-riety of information about species, their environments and changes over time. Indeed, one of the challenges facing conservation today is a lack of knowledge of the trends, status and functional roles of many taxa (Rands et al., 2010). Herbarium specimens (and other biological collec-tions) have the potential tofill some of these knowledge gaps – both about the recent past and the present. They are particularly valuable in regions that have received less scientific interest (which are often also regions with high diversity), including many parts of Africa. Thus, as herbarium specimens provide knowledge about species and their ecosystems, they provide essential baseline knowledge for conservation biology. It is thus essential to ensure 1) the continued support of herbaria and their staff so that biological specimens continue to be avail-able into the future, as new uses for them are found; 2) that specimens continue being added to herbaria so that trends in space and time can be elucidated; 3) that herbarium data are databased accurately along with all the specimen-associatedfield notes, and 4) that herbarium speci-mens are correctly named and that names in databases are updated where necessary to reflect any changes in specimen identification. That way, conservationists will continue to gain from the rich resources available in herbaria.
Acknowledgments
Special thanks to Denis Filer who provided ample assistance with databasing the herbarium records in the BRAHMS database management system for botanical data (http://dps.plants.ox.ac.uk/bol/). The following
individuals and organisations are thanked for providing data: Jonathan Timberlake; Ib Friis; the South African National Biodiversity Institute; the herbaria of Senckenberg, Uppsala, Université Libre de Bruxelles, Wageningen, and the University of Dar es Salaam Herbaria; GBIF (http://data.gbif.org/datasets/resource/621; http://data.gbif.org/datasets/
resource/47); the National Museums of Kenya; National Herbarium of
Tanzania; National Herbarium of Namibia (specimen database: SPMNDB; National Botanical Research Institute); and National Botanical Garden of Belgium. The Royal Botanic Gardens, Kew; London Natural History Museum; Coimbra; and Instituto de Investigação Científica Tropical, Lisbon, are also thanked for providing MG access to their collections. The following sources provided funding: the Faculty of Science at Aarhus University (MG); Research and Development Funding– University of Pretoria (MG), Danish Council for Independent Research - Natural Sciences, grant 272-07-0242 (JCS and MG); the Undesert Project, EU-FP7 243906 (AML); the Liz Claiborne Art Ortenburg Foundation (ARM, RG and RM, in collaboration with the African Conservation Centre, Nairo-bi); and BRIC of the Université Libre de Bruxelles and the Belgian Techni-cal Cooperation (JN).
Appendix A. Supplementary data
Supplementary data to this article can be found online athttp://dx. doi.org/10.1016/j.sajb.2016.03.017.
References
Aikio, S., Duncan, R.P., Hulme, P.E., 2010.Herbarium records identify the role of long-distance spread in the spatial distribution of alien plants in New Zealand. Journal of Biogeography 37, 1740–1751.
Archibald, S., Bond, W.J., 2003.Growing tall vs growing wide: tree architecture and allom-etry of Acacia karroo in forest, savanna, and arid environments. Oikos 102, 3–14.
Bebber, D.P., Carine, M.A., Wood, J.R.I., Wortley, A.H., Harris, D.J., Prance, G.T., Davidse, G., Paige, J., Pennington, T.D., Robson, N.K.B., Scotland, R.W., 2010.Herbaria are a major frontier for species discovery. Proceedings of the National Academy of Sciences of the United States of America 107, 22169–22171.
Beck, J.B., Semple, J.C., 2015.Next-generation sampling: pairing genomics with herbarium specimens provides species-level signal in Solidago (Asteraceae). Applications in Plant Sciences 3, 1500014.
Blach-Overgaard, A., Svenning, J.-C., Dransfield, J., Greve, M., Balslev, H., 2010. Determi-nants of palm species distributions across Africa: the relative roles of climate, non-climatic environmental factors, and spatial constraints. Ecography 33, 380–391.
Cherry, M.I., 2009.What can museum and herbarium collections tell us about climate change? South African Journal of Science 105, 87–88.
Cuni Sanchez, A., Osborne, P.E., Haq, N., 2011.Climate change and the African baobab (Adansonia digitata L.): the need for better conservation strategies. African Journal of Ecology 49, 234–245.
Earth Resources Observation and Science, 1996.HYDRO1k Elevation Derivative Database. U.S. Geological Survey, Sioux Falls.
Elith, J., 2000.Quantitative methods for modeling species habitat: comparative perfor-mance and an application to Australian plants. In: Ferson, S., Burgman, M.A. (Eds.), Quantitative Methods in Conservation Biology. Springer-Verlag, New York, pp. 39–58.
Elith, J., Leathwick, J., 2007.Predicting species distributions from museum and herbarium
records using multiresponse modelsfitted with multivariate adaptive regression
splines. Diversity and Distributions 13, 265–275.
Elith, J., Leathwick, J.R., Hastie, T., 2008.A working guide to boosted regression trees. Journal of Animal Ecology 77, 802–813.
Figueiredo, E., Smith, G.F., César, J., 2009.Theflora of Angola: first record of diversity and endemism. Taxon 58, 233–236.
Filer, D.L., 2011. BRAHMS Botanical Research and Herbarium Management System. Uni-versity of Oxford, Department of Plant Sciences (http://herbaria.plants.ox.ac.uk/bol/). Foden, W., 2002.A demographic study of Aloe dichotoma in the Succulent Karoo: are the effects of climate change already apparent? University of Cape Town, Cape Town
Greve, M., Svenning, J.-C., 2011.Dealing with data: preserve old collections. Science 331, 1515.
Greve, M., Lykke, A.M., Fagg, C.W., Bogaert, J., Friis, I., Marchant, R., Marshall, A.R., Ndayishimiye, J., Sandel, B.S., Sandom, C., Schmidt, M., Timberlake, J.R., Wieringa, J.J., Zizka, G., Svenning, J.-C., 2012.Continental-scale variability in browser diversity is a major driver of diversity patterns in acacias across Africa. Journal of Ecology 100, 1093–1104.
Guisan, A., Zimmermann, N.E., 2000.Predictive habitat distribution models in ecology. Ecological Modelling 135, 147–186.
Hassan, A.S., Styles, B.T., 1990.A Conspectus of Somali Acacias. Natural Resource Institute, for Oxford Forestry Institute and Overseas Development Administration, United Kingdom, Chatham.
Hijmans, R.J., Cameron, S.E., Parra, J.L., Jones, P.G., Jarvis, A., 2005.Very high resolution in-terpolated climate surfaces for global land areas. International Journal of Climatology 25, 1965–1978.
Holmgren, M., Poorter, L., 2007.Does a ruderal strategy dominate the endemicflora of the West African forests? Journal of Biogeography 34, 1100–1111.
IPCC, 2007.Climate Change 2007: Synthesis Report. Contribution of Working Groups I, II and III to the Fourth Assessment Report of the Intergovernmental Panel on Climate Change. Geneva.
IPCC, 2014.Climate Change 2014: Synthesis Report. Contribution of Working Groups I, II and III to the Fifth Assessment Report of the Intergovernmental Panel on Climate Change. IPCC, Geneva.
IUCN Standards and Petitions Subcommittee, 2014. Guidelines for using the IUCN Red List categories and criteria. Version 11. (Prepared by the Standards and Petitions Subcom-mittee. Downloadable fromhttp://www.iucnredlist.org/documents/RedListGuidelines. pdf).
Kalema, J., 2008.The use of herbarium plant databases in identifying areas of biodiversity concentration: the case of family Acanthaceae in Uganda. African Journal of Ecology 46, 125–126.
Kindt, R., Lillesø, J.-P.B., van Breugel, P., 2007.Comparisons between original and current composition of indigenous tree species around Mount Kenya. African Journal of Ecology 45, 633–644.
Kreft, H., Jetz, W., 2007.Global patterns and determinants of vascular plant diversity. Pro-ceedings of the National Academy of Sciences of the United States of America 104, 5925–5930.
Küper, W., Sommer, J.H., Lovett, J.C., Barthlott, W., 2006.Deficiency in African plant distri-bution data—missing pieces of the puzzle. Botanical Journal of the Linnean Society 150, 355–368.
Lister, A.M., 2011.Natural history collections as sources of long-term datasets. Trends in Ecology & Evolution 26, 153–154.
Loiselle, B.A., Jørgensen, P.M., Consiglio, T., Jiménez, I., Blake, J.G., Lohmann, L.G., Montiel, O.M., 2008.Predicting species distributions from herbarium collections: does climate bias in collection sampling influence model outcomes? Journal of Biogeography 35, 105–116.
Magurran, A.E., Baillie, S.R., Buckland, S.T., Dick, J.M., Elston, D.A., Scott, E.M., Smith, R.I., Somerfield, P.J., Watt, A.D., 2010.Long-term datasets in biodiversity research and monitoring: assessing change in ecological communities through time. Trends in Ecology & Evolution 25, 574–582.
Marshall, A.R., Platts, P.J., Gereau, R.E., Kindeketa, W., Kang'ethe, S., Marchant, R., 2012.
The genus Acacia (Fabaceae) in East Africa: distribution, biodiversity and the protected area network. Plant Ecology and Evolution 145, 289–301.
Pauw, A., Hawkins, J.A., 2011.Reconstruction of historical pollination rates reveals linked declines of pollinators and plants. Oikos 120, 344–349.
Platts, P.J., Ahrends, A., Gereau, R.E., McClean, C.J., Lovett, J.C., Marshall, A.R., Pellikka, P.K.E., Mulligan, M., Fanning, E., Marchant, R., 2010.Can distribution models help refine inventory-based estimates of conservation priority? A case study in the Eastern Arc forests of Tanzania and Kenya. Diversity and Distributions 16, 628–642.
Preston, K., Rotenberry, J.T., Redak, R.A., Allen, M.F., 2008.Habitat shifts of endangered species under altered climate conditions: importance of biotic interactions. Global Change Biology 14, 2501–2515.
Proença, C.E.B., Filer, D.L., Lenza, E., Silva, J.S., Harris, S.A., 2012.Phenological Predictability Index in BRAHMS: a tool for herbarium-based phenological studies. Ecography 35, 289–293.
Pyke, G.H., Ehrlich, P.R., 2010.Biological collections and ecological/environmental re-search: a review, some observations and a look to the future. Biological Reviews 85, 247–266.
Rands, M.R.W., Adams, W.M., Bennun, L., Butchart, S.H.M., Clements, A., Coomes, D., Entwistle, A., Hodge, I., Kapos, V., Scharlemann, J.P.W., Sutherland, W.J., Vira, B., 2010.Biodiversity conservation: challenges beyond 2010. Science 329, 1298–1303.
Rawal, D.S., Kasel, S., Keatley, M.R., Nitschke, C.R., 2015.Herbarium records identify
sensi-tivity offlowering phenology of eucalypts to climate: implications for species
response to climate change. Austral Ecology 40, 117–125.
Rivers, M.C., Bachman, S.P., Meagher, T.R., Lughadha, E.N., Brummitt, N.A., 2010. Subpop-ulations, locations and fragmentation: applying IUCN red list criteria to herbarium specimen data. Biodiversity and Conservation 19, 2071–2085.
Ross, J.H., 1973.Towards a classification of the African Acacias. Bothalia 11, 107–113.
Spaargaren, O., 2008.Vertisols. In: Chesworth, W. (Ed.), Encyclopedia of Soil Science. Springer, Dordrecht, pp. 807–809.
Sparks, T.H., 2007.Lateral thinking on data to identify climate impacts. Trends in Ecology & Evolution 22, 169–171.
Staudinger, M.D., Grimm, N.B., Staudt, A., Carter, S.L., Chapin, F.S., Kareiva, P., Ruckelshaus, M., Stein, B.A., 2012.Impacts of climate change on biodiversity, ecosystems, and eco-system services: technical input to the 2013 National Climate Assessment.
Tansey, K., Gregoire, J.M., Defourny, P., Leigh, R., Pekel, J.F.O., van Bogaert, E., Bartholome, E., 2008.A new, global, multi-annual (2000–2007) burnt area product at 1 km resolution. Geophysical Research Letters 35, L01401.
Thiollay, J.M., 2006.The decline of raptors in West Africa: long-term assessment and the role of protected areas. Ibis 148, 240–254.
Vorontsova, M.S., Christenhusz, M.J.M., Kirika, P., Muthoka, P., 2010.Three new species of Solanum from Kenya: using herbarium specimens to document environmental change. Systematic Botany 35, 894–906.
Westoby, M., 1998.A leaf-height-seed (LHS) plant ecology strategy scheme. Plant and Soil 199, 213–227.
Wieringa, J.J., Sosef, M.S.M., 2011.The applicability of Relative Floristic Resemblance to evaluate the conservation value of protected areas. Plant Ecology and Evolution 144, 242–248.
Winter, M., Devictor, V., Schweiger, O., 2013.Phylogenetic diversity and nature conserva-tion: where are we? Trends in Ecology & Evolution 28, 199–204.
Wittig, R., König, K., Schmidt, M., Szarzynski, J., 2007.A study of climate change and an-thropogenic impacts in West Africa. Environmental Science and Pollution Research 14, 182–189.