HAL Id: hal-00766298
https://hal.archives-ouvertes.fr/hal-00766298
Submitted on 18 Dec 2012HAL is a multi-disciplinary open access
archive for the deposit and dissemination of sci-entific research documents, whether they are pub-lished or not. The documents may come from teaching and research institutions in France or abroad, or from public or private research centers.
L’archive ouverte pluridisciplinaire HAL, est destinée au dépôt et à la diffusion de documents scientifiques de niveau recherche, publiés ou non, émanant des établissements d’enseignement et de recherche français ou étrangers, des laboratoires publics ou privés.
clilmate of Tadla (Morocco)
B. Bouazzama, D. Xanthoulis, A. Bouaziz, P. Ruelle, J.C. Mailhol
To cite this version:
B. Bouazzama, D. Xanthoulis, A. Bouaziz, P. Ruelle, J.C. Mailhol. Effect of water stress on growth, water consumption and yield of silage maize under flood irrigation in semi-arid clilmate of Tadla (Morocco). Biotechnologie, Agronomie, Société et Environnement / Biotechnology, Agronomy, Society and Environment, Presses Agronomiques de Gembloux, 2012, 16 (4), 10 p. �hal-00766298�
Effect of water stress on growth, water consumption and yield of silage
maize under flood irrigation in a semiarid climate of Tadla (Morocco)
Bouazzama B. (1), Xanthoulis D. (1), Bouaziz A. (2), Ruelle P. (3), Mailhol J.C. (3)(1): Hydraulic and Hydrology Unit, University of Liège Agro-Bio Tech Gembloux – Belgium (2): Institute of Agronomy and veterinary Hassan II - Rabat – Morocco
(3): Cemagref, French Institute of Agricultural and Environmental Research (Irrigation Division, Montpellier, France
Corresponding author: Tel.: +212 6 10 03 32 80; fax: +212 5 23 44 00 83 E-mail address: bassoubouazzama@gmail.com (Bouazzama Bassou) Centre Régional de la Recherche Agronomique de Tadla
B.P: 567 – Beni Mellal – Morocco
Abstract
The field study of crops response to water stress is important to reduce agricultural water use in areas where the water resources are limited. This study was carried out during two growing periods of 2009 and 2010 in order to study the effect of water stress on crops growth, water consumption and dry matter yield of silage maize supplied with flood irrigation under the semiarid climate of Tadla in Morocco. Four to five irrigation treatments were applied at the rates of 100, 80, 60, 40 and 20% of ETc of maize. Soil water status, crop growth, leaf area index and above-ground biomass were measured. Results showed that growth dynamic of maize passes by three distinct phases: exponential phase, linear phase and a final phase. The irrigation deficit accelerates the senescence of the sheets and reduces the leaf area index. The maximum values of this parameter reached at flowering under the full irrigation treatment (100%ETc) are 5.1 and 4.8 in 2009 and 2010 respectively. Dry matter yields varied from 5.3 t/ha under T4 (40%ETc) to 16.4 t/ha under T1 (100% ETc) in 2009 whereas in 2010, it oscillated between 3.9 t/ha under T5 (20%ETc) to 12.5 t/ha under T1 (100%ETc). The actual evapotranspiration under T1 (100%ETc) was 478 mm and 463 mm in 2009 and 2010 respectively. According to the averaged values of two years, linear relationships have been evaluated between dry matter yield and water consumption ETa. Yield response factor (ky) for the silage maize for all growth season was 1.12.
Keywords: flood irrigation, silage maize, water use efficiency, evapotranspiration, water
deficit
1. Introduction
Water is the main factor limiting yield production in the arid and semiarid regions. When water resources are a factor limiting the production, irrigation programming is essential in order to maximize production per m3 irrigation water (Doorenbos and Kassam, 1979). Deficit irrigation is one way of maximizing water use efficiency (Bekele and Tilahun 2007).
The water requirements of maize for all growing cycle vary from 500 to 800 mm (Brouwer and Heibloem, 1986). Under semiarid climate of North India, Narandra and al, (2002) determined the ETc of corn at 354 mm.Water stress has an important effect on water consumption and corn yield. A positive linear relationship between yield and water use has been recognized by several authors (Fatih and al, 2008, Gencoglan and Yazar, 1999;
water applied and yield that can be used to predict yield per applied water unit. The determination of water use efficiency is essential to evaluate the crops in arid regions where water is a limiting factor (Johnson and Henderson2002).
Irrigated perimeter of Tadla has semiarid climate and is one of the most bovine breeding regions of Morocco. The silage maize constitutes the most fodder crop practiced after alfalfa. The silage maize growing area is about 1500 ha (ORMVAT, 2009) and is increasing in the last years. However, the effect of water stress this crop growth in the region have not been studied yet.
Irrigation timing and water quantity applied are important to maximize the silage maize yield. Hsiao (1990) indicated that corn yield depends on the period, the level and the duration of the water stress. The prediction of yield response to water use by silage maize is essential when promoting strategies and decision-making for farmers and their advisors for a better water management (Fatih et al, 2008).
The objectives of this work are: 1) to determine the effect of water deficit on growth factors, yield biomass and water use efficiency of silage maize in the semiarid conditions of Tadla, 2) to determine yield response factor (ky) to establish irrigation scheduling programs in the study area.
2. Materials and methods
This study was carried out during the growing periods of 2009 and 2010 at the experimental station of Tadla (X = 32.3°; Y = 6.31'; Z = 450 m) of the National Institute of Agronomic Research (INRA) (Morocco). The soil was classified as laomy-silt. The climate of this area is arid with a great irregularity of rains. Average annual pluviometry is about 268 mm, average temperature is 18°C with a maximum in August which often exceeds 45°C and a minimum in January of approximately 0°C.
The climatic variables for growing periods during experimental years are given in Table 1. The climatic data were collected from a local meteorological station. According to Table 1, the growing period of silage maize (April-July) is hot with maximum temperatures that exceed 40°C. This period is characterized by hot and dry winds locally called Chergui. The precipitations are few or absent.
Table 1: Climatic data of the experimental station in the growing periods of 2009 and 2010
Years/Months MeanTmax (°C) Mean Tmin (°C) Total precipitation (mm) ET0 (mm) 2009 - April - May - June - July 27.8 34.7 37.7 45.4 9.6 13.9 17.4 25.9 0.0 2.6 16.7 0.0 127.8 180.3 208.0 233.6 2010 - April - May - June - July 31.9 30.7 33.5 43.2 12.8 14.6 16.5 24.9 19 3.5 0.0 2.0 113.9 168.7 186.1 213.3
Before the experiment starting, soil samples were collected with an auger from soil layers 0-30, 30-60 and 60-90 cm for analyses. Some physical and chemical propertis of the soil were determined. They are presented in Table 2.
Table 2: Some physical and chemical properties of the experimental field soil
Properties Soil layer (cm)
0 – 30 30 – 60 60 - 90 Clay (%) Fine silt (%) Coarse silt (%) Fine sand (%) Coarse sand (%) Organic matter (%) pH Electrical conductivity (mS/cm) Field capacity (%) Wilting point (%) Bulk density 27.7 3.9 49.2 12.3 5.7 1.91 7.97 1.03 27.3 16.2 1.38 43.3 15.9 2.8 11.2 27.6 1.08 8.22 0.45 27.8 16.7 1.46 47.4 16.6 19.3 11.3 6.1 1.08 8.43 0.53 26.7 16.1 1.57
The experiment was laid out in a total randomized design with three replications. The studied factor is irrigation treatment. Four irrigation regimes were established on the basis of coefficients affecting ETc. The resulting irrigation treatments are 100%, 80%, 60% and 40% ETc for T1, T2, T3 and T4 respectively. In 2010, a T5 treatment corresponding to 20% ETc was added. The experiment plot area was of 2500 m2. Water was applied using flood irrigation. Spaces of 10 m were considered between plot’s treatments in order to minimize the risk of water communication between treatments. According to the local irrigation practices, the devices of irrigation are traditional basins of 60 m2.
As crop material, a late variety Zea mays L. Cecilia was used. The seeds were sown by seed drill on 24 April 2009 and on 15 May 2010. The plants were grown 70 cm apart between rows with 20 cm spacing in each row (soit en moyenne 7 Plts/m2 ?). Before sowing, 70 kg/ha N and 82 kg/ha P2O5 were applied to all plots. At stage of 6 sheets, 65 kg/ha N was added. Treatments of insecticides were applied to limit the effect of the ravagers.
Theoretic water deficit (WDT, mm) for each treatment is calculated by:
WDT = Kc.ajst * ET0 * kr
Where Kc.ajst is adjusted crop coefficient using methods giving in FAO paper n°56, ET0 is
the reference evapotranspiration (mm day-1); Kr is the reduction coefficient which defines irrigation treatments. It was setto 1, 0.8, 0.6, 0.4 and 0.2 for T1, T2, T3, T4 and T5 respectively. ET0 was calculated using the FAO Penman Monteith equation given by Allen et
al. (1998):
(
)
(
)
(
μ
)
γ
μ
γ
34 . 0 1 273 900 4 . 0 0 + + Δ − + + − Δ = s a e e T G Rn ETwhere ETo is the reference evapotranspiration (mm day-1), Rn is net radiation at the crop surface (MJ m-2 day-1), G is soil heat flux density (MJ m-2 day-1), T is mean daily air temperature at 2 m height (°C), μ is wind speed at 2 m height (m s-1), es is saturation vapor pressure (kPa), ea is actual vapor pressure (kPa), (es – ea) is saturation vapour pressure deficit (kPa), Δ is slope of the saturation vapour pressure curve (kPa °C-1), and γ is psychrometric constant (kPa °C-1).
Irrigation was applied for each treatment when cumulative WDT reached 35 mm at the beginning of experimentation (of the vegetative period?) and 75 mm thereafter. This value corresponds to the easily usable soil water reserve on 1 m depth. In this situation, number and intervals between irrigation events varies between treatments. Water, supplied by a dam located at 20 km, was of high quality with an electrical conductivity of 0.4 dS/m and a pH of 7.2.
Comment sont mesurées les doses ? très important car tu parles plus loin d’efficience de l’irrigation !!
Observations on plants at each treatment were carried out weekly (4 to 5 days at the beginning) from emergence until harvest. The phenologic monitoring of stages is based on the number of visible sheets. A sheet is noted visible when the apical end of the limb points out of horn (Girardin and Al, 1986). On the central row of each elementary plot, 10 consecutive plants were selected and marked for monitoring of emission rhythm of sheets and evolution of apparent height of the plants.
The dry matter evolution was carried out weekly by sampling of 10 consecutive plants on the level of the central rows for each treatment. Crops samples are weighing after oven-drying at 80°C during 48 h. The leaf area index (LAI) was measured weekly by a LAI-2200 plant canopy analyser. This instrument contains the necessary electronics to measure, record and compute the final results of LAI in the field.
Harvest was carried out when the cob under treatment T1 (100% ETc) reached pasty milky grain stage. Fresh yield was measured at plots of 8 m2 for each treatment. Each sample makes the object of measurement of total weight of the fresh matter, final plant height, number of green sheets per plant and the dry matter rate. The dry matter is also given after drying of samples at 80°C during 48 h.
Crop water consumption is based on of the soil water balance equation according to (Garrity and Al, 1982; James, 1988):
R Rc D S I P ETa= + ±Δ − + ±
Where ETa is the actual evapotranspiration (mm), P is precipitation (mm), I is irrigation (mm), Rc is capillary rise (mm), D is drainage beyond the rooting depth,
Δ
S is the soil water content variation (mm) and R is runoff (mm). Change in soil water content was measured 2 to 3 times each month, and at harvest. Conventional oven dry (gravimetric) method was used to evaluate soil water content at soil layers 0-20, 20-40, 40-60, 60-80, 80-100 and 100-120 cm. Runoff R is neglected since blocked basins are used to irrigate. Capillary rise was considered as negligeable because water table is deep.Drainage water is determined using the zero flux plans monitoring under each irrigation treatment. For this, tensiometers were installed at soil depths 20, 40, 60, 80,100 and 120 cm. Water use efficiency (kg m-3) was calculated by dividing total dry matter (kg ha-1) byETa (mm) (Howell and al 1990; Scott 2000).
The relationship between relative evapotranspiration reduction (1 – ETa/ETc) and relative yield reduction (1 – Yr/Ym) was determined using the method given by Doorenbos and Kassam (1979). The equations are as follows:
¸ ¹ · ¨ © § − = − ETc ETa Ky Ym Yr 1 * 1 Or Yd =Ky*ETd
Where Ya is actual harvested yield, Ym is maximum harvested yield, Ky is yield response factor, ETa is actual evapotranspiration, ETc is maximal evapotranspiration, Yd is relative yield reduction, and ETd is relative evapotranspiration reduction.
Doorenbos and Kassam (1980) stated that, when Ky < 1, yield loss is less important than evapotranspiration deficit; when Ky > 1, yield loss is more important than evapotranspiration deficit (for maize, Ky = 1.25 for the whole growing period); and when Ky = 1, yield loss is equal to evapotranspiration deficit (line 1:1).
Data obtained from experimentation was treated by the analysis of variance (ANOVA) and the test of the least significant difference (LSD) (Cochran and Cox, 1957) by using software SAS.
3. Results and discussions
3.1. Effect of irrigation regime on plant height growth and dry matter accumulation
Results show that the evolution curves of height vs.thermal time (C°-j) from emergence to harvest have sigmoid form (Fig. 1 and Fig. 2). Using graphic method (Fournieu and Andrieu 2000; Birch et al, 2002), we identified three phases of growth: an exponential phase with slow growth (Bennouna et al, 2005) from emergence until stage 9 sheets in 2009 and 8 sheets in 2010. During this first period of growth, the effect of the irrigation mode is not significant. The plant height average at the end of this phase was 25.1 and 24.3 cm in 2009 and 2010 respectively.
The 2nd stage of growth starts at thermal time 380 to 400 °C-j and takes end at plant flowering which occur at time thermics 1253 C°-j in 2009 and 1283°C-j in 2010(peut –on être si précis que ça ? Tf n’est-ce pas une caractéristique de la plante ? il serait peut être juduicieux de dire que Tf = 0.5*(1283+1253) pour la variété considérée) The 2nd phase is characterized by a linear growth with more or less high slope according to the irrigation treatment. The statistical analysis of plant heights measured at the end of this phase showed highly significant (P < 0.01) effect of irrigation mode. Heights average obtained are 242, 203,191 and 163 cm in 2009 and 239,187,161 and 122 cm in 2010 for T1, T2, T3 and T4 respectively. The 3rd phase of growth is marked by a quasi-stagnation of height evolution until harvest which coincides with the stage pasty milky grain. Under conditions of Marrakech region (arid climate), Bennouna et al. (2005) found that for the grain corn variety named Raissa, which is a late variety, the linear phase begins at thermal time 400°C-j.
0 50 100 150 200 250 300 0 200 400 600 800 1000 1200 1400 1600 1800 2000 Therm al tim e (°C-j) pl a n t he ig h t (c m ) Rep.1 Rep.2 Rep.3
Fig.1: Evolution plant height of silage maize under treatment T1 (100%ETc) - 2009
0 50 100 150 200 250 300 0 200 400 600 800 1000 1200 1400 1600 1800 2000 Therm al tim e (C° -j) P la n t he ig ht (c m ) Rep.1 Rep.2 Rep.3
Fig.2: Evolution plant height of silage maize under treatment T1 (100%ETc) - 2010
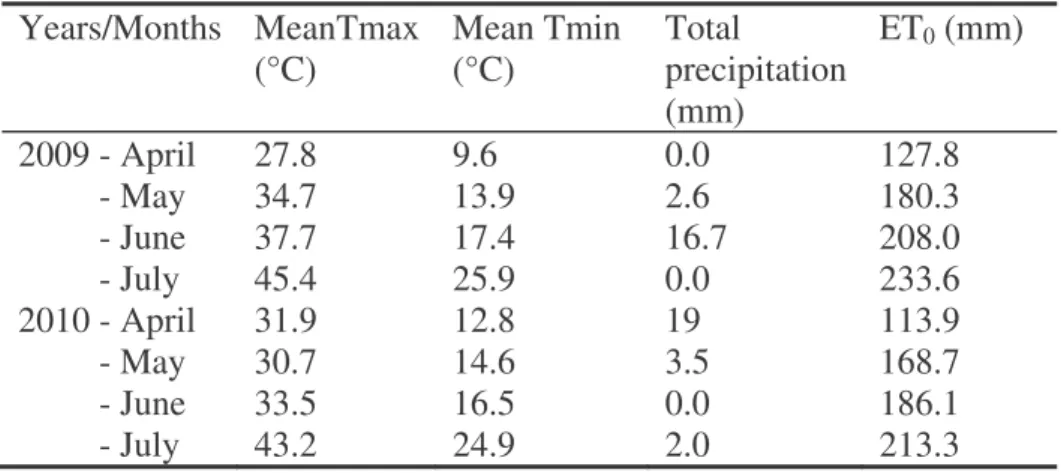
Average daily accumulation of dry matter (DM) was calculated using samples of plant removed in 2010 for each growth phases described previously. During the first phase, average daily growth was weak (Fig. 3) without having significant differences (5%) between irrigation modes. The average daily growth of this stage is 49 kg ha-1day-1. As for the 2nd phase, daily accumulation of the dry matter decreases with water stress with highly significant differences (P<0.01) between treatments. The calculated average values are 343, 283, 221, 86 and 80 kg ha-1day-1 under T1, T2, T3, T4 and T5 respectively. Concerning 3rd phase, the growth is also influenced by irrigation mode with low average values compared to the 2nd phase. Average values obtained are 145, 87, 84, 81 and 34 kg ha-1day-1 under T1, T2, T3, T4 and T5 respectively.
0 50 100 150 200 250 300 350 400 T1 T2 T3 T4 T5 Treatm ent P roduc ti v ity ( k g ha -1 da y -1 ) Phase 1 Phase 2 Phase 3
Fig. 3: Daily productivity of silage maize for each irrigation mode and growth phase - 2010
3.2. Evolution of leaf aera index and number of green sheets
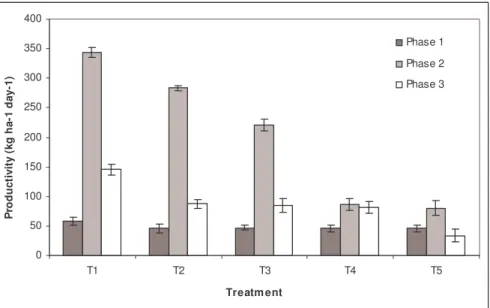
Fig. 4 shows the trend of leaf area index (LAI) during growth periods of year 2010 for the compared irrigation treatments. These results show that under each irrigation mode, LAI increases from emergence and reach maximum values at flowering stage. Leaf area index remains always lower under the more water stressed treatments. The maximum average values obtained are 4.8, 4.2, 3.2, 2.3 and 1.9 for T1, T2, T3, T4 and T5 respectively. LAI values measured at flowering in 2009 are relatively higher compared to those of 2010 and are 5. (difficile de parler de valeur de LAIX sans parler de densité !! valeur élevée pour une densité de 7plts/m2. par exemple à Lvalette sur varité tardive LAIX = 5 pour 10plts/m2 en 2007), 4.4, 3.9 and 3.4 under T1, T2, T3 and T4 respectively. Narandra et al, (2002) found that the maximum value of corn grain LAI is reached at flowering and varies between 5.1 and 5.5 (pour quelle densité ?) . The statistical analysis of the values measured at flowering for the two years showed that the effect of water stress is significant (P < 0.05) with a reduction of LAI with more water stress. After flowering, values of LAI decrease whatever the irrigation treatments at a more or less high rate according to the irrigation strategy . This reduction can be explained by the stop of emission of new sheets after the exit of panicle on the one hand and on the other hand to the senescence of the old sheets which is accelerated by water stress. According to Mollier (1999), components of LAI are rhythm emission of sheets, individual surface of sheets and speed of theirs senescence. Plant density (il faudrait en donner la valeur dans Mat & Met) being the same for all treatments, it cannot explain the variations of leaf area index between the different treatments. Although the senescence of sheets is a normal physiological phenomenon for corn, its intensity is accentuated by water stress. Fig. 5 gives the evolution of average number of green sheets per plant silage maize according to irrigation modes compared in 2010. Number of green sheets per irrigation treatment at flowering is significantly (P < 0.05) affected by water stress. Plant number of sheets is on average of 13.9, 12.8, 11.8 and 10.9 for T1, T2, T3 and T4 respectively.
0,0 0,5 1,0 1,5 2,0 2,5 3,0 3,5 4,0 4,5 5,0 20 30 40 50 60 70 80
Days after sow ing
LA I T1 T2 T3 T4 T5
Fig. 4: Leaf area index vs. time for each irrigation treatment in 2010 (bars represent confidence intervals at 5% probability).
0 2 4 6 8 10 12 14 16 0 10 20 30 40 50 60 70 80 90
Days after sow ing
G reen sh eet /p la n t T1 T2 T3 T4
Fig. 5: Number of green sheets per plant for each irrigation treatment in 2010
Pandey et al. (2000) reported that the highest value of leaf area index for corn was obtained under the conditions of full irrigation (without stress). A positive correlation was found between the LAI and water consumption of corn (Kang and Al, 1998).
3.3. Water applied and actual evapotranspiration
The amont of irrigation water and actual evapotranspiration (ETa) values are presented in Table 3. Applied irrigation water and ETa in the 2009 growing period were higher than in 2010. This may be attributed to the differences in the climatic conditions and in the growing period duration. The average temperatures and climatic demand (ET0) are higher in 2009
(Table 1). Total crop growing period in 2009 (90 days) was slightly longer than in 2010 (79 days). Under the full irrigation treatment T1 (100% ETc), the amount of irrigation water applied and ETa values were 619.3 and 477.7 mm in 2009 and 535.0 and 463.0 mm in 2010
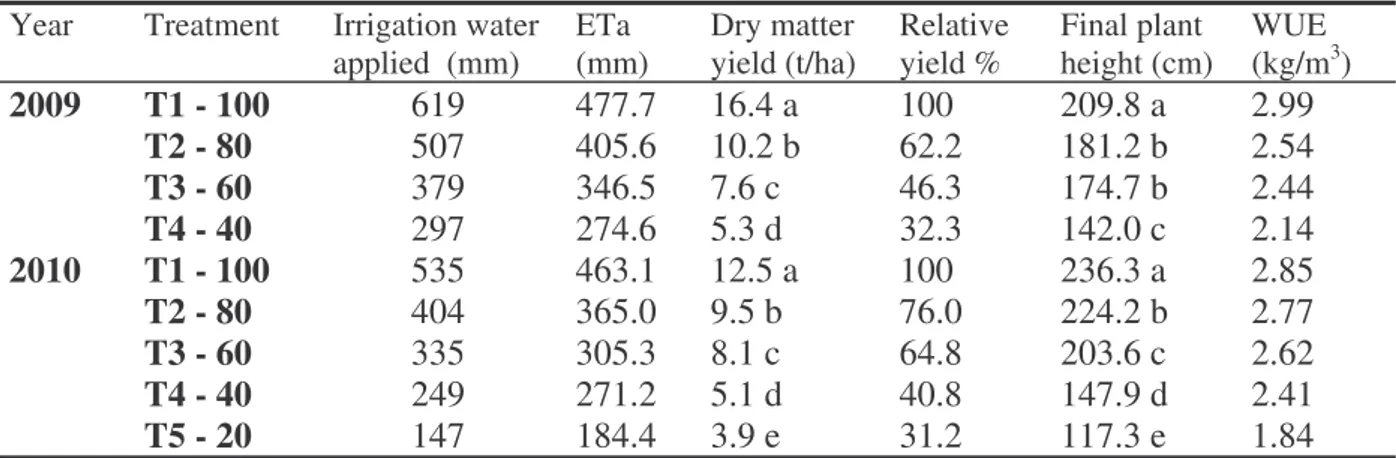
respectively. As expected, the highest ETa occurred in T1 (100%ETc) obviously owing to an adequate soil water supply during the growing period. Other irrigation strategies cause a certain water deficit and consequently a lower ETa. The lowest ETa was observed under the most stressed treatments, 274.6 mm under T4 in 2009 and 184 mm under T5 in 2010.
Table 3: Amont of water applied, ETa, yield, plant height at harvest and WUE Year Treatment Irrigation water
applied (mm) ETa (mm) Dry matter yield (t/ha) Relative yield % Final plant height (cm) WUE (kg/m3) 2009 T1 - 100 619 477.7 16.4 a 100 209.8 a 2.99 T2 - 80 507 405.6 10.2 b 62.2 181.2 b 2.54 T3 - 60 379 346.5 7.6 c 46.3 174.7 b 2.44 T4 - 40 297 274.6 5.3 d 32.3 142.0 c 2.14 2010 T1 - 100 535 463.1 12.5 a 100 236.3 a 2.85 T2 - 80 404 365.0 9.5 b 76.0 224.2 b 2.77 T3 - 60 335 305.3 8.1 c 64.8 203.6 c 2.62 T4 - 40 249 271.2 5.1 d 40.8 147.9 d 2.41 T5 - 20 147 184.4 3.9 e 31.2 117.3 e 1.84
Values of ETa calculated in this study are relatively lower than those found by Fatih et al, (2008) in Turkey for silage maize under sprinkler irrigation. The differences can be attributed to the relative lower efficiency of flood irrigation in Tadla which is about 68% (Bouazzama et al, 2007) and to the additional water losses caused by soil cracking. La mesure de l’efficience n’est pas explicitée dans M&M , c’est donc mal venu d’évoquer cela ici !. d’autant que je n’ai pas vu comment tu estimais les doses apportées ni tuévoque avec quelle uniformité ells s’infiltre sur la Robta !! Le craking n’est pas forcément la cause d’une mauvaise efficience au contraire Attention si tout ce qui rentre dans la Robta (à son échelle) s’infiltre si tu dis que l’efficnec est auvaise cela veut dire que tu as eu du drainage ..ce qui fausse ton bilan et ainsi ton estimation de l’ETR !! ..fais donc attention de ne pas ‘’donner le baton pour te faire battre !!’’
Yazar et al. (1999) found that the required water amount for corn varied between 786 and 533 mm and depend on irrigation strategies under Texas conditions. Under furrow irrigation, evapotranspiration of maize obtained by Istanbulluoglu et al. (2002) was 586 mm for full irrigation regime and 353 mm for the non-irrigation treatment in Tekirdag conditions (Turkey). Oktem et al. (2003) found that evapotranspiration of irrigated sweet corn in Sanliurfa conditions (Turkey) varies between 701 and 1040 mm according to the irrigation treatment. Cakir (2004) indicated that evapotranspiration of the grain corn varied from 762 (total irrigation) to 265 (mm) (not irrigated) in Kirklareli. Dagdelen et al (2006) reported that evapotranspiration of closed-end furrow irrigated corn ranging from 558 (full irrigated) to 174 mm (non-irrigated) in the Aydin region, whereas Gencoglan and Yazar (1999) reported values ranging from 1026 (full irrigation) to 410 mm (non irrigated) in the Cukurova region. Payero et al. (2006) found that evapotranspiration of corn varied between 625 and 366 mm depending on various irrigation treatments in Nebraska by using solid-set sprinkler system. In the northern of Victoria, Greenwood et al (2008) indicated that amount of rainfall and irrigation for silage maize irrigated by center pivot method wase 782 mm.
3.4. Effect of irrigation mode on dry matter yield and plant height at harvest
The results obtained during two years show that dry matter yield and plant height are significantly (P< 0.01) affected by water stress and that the highest values are obtained under T1 (100% ETc). Increasing water deficits induce a relative reduction in dry matter yield and plant height. In 2009, water saving is 20% (T2), 40% (T3) and 60% (T4) of T1 while rates of reduction in average dry matter yield was 38, 54 and 68% of that obtained under T1 (100% ETc) respectively. In 2010, while saved water was 20% (T2), 40% (T3), 60% (T4) and 80% (T5) of T1, the rates of decreases in average dry matter yield were found to be 24%, 35%, 59% and 69% of that obtained under T1. The ratio of reduction in yield varies from one irrigation mode to another.
Otegui et al. (1995) and Istanbulluoglu et al. (2002) reported that water deficit reduced plant height of maize. Bunika et al. (1996) indicated that yield silage maize under sprinkler irrigation varies from 34.5 t/ha without irrigation to 42.8 t/ha with irrigation (in what climatic and soil conditions?). Wagger and Cassel (1993) found that silage yield for full and no irrigation plots were significantly different Li et al. (2005) reported that in the case of full irrigation treatment, the amount of total water applied was 295 mm and increase of corn yield was 49%.
The dry matter yield of silage maize was determined by Naescu (2000) as 0.2 t/ha without irrigation and more than 10.7 t/ha with irrigation in Romania (on what soil type ) . Emile et al (2006) determined dry matter yield for irrigated maize as 20.1 t/ha in France. Cigdem and Uzum (2006) found that dry matter yield of full irrigated silage corn was 7.22-8.53 t/ha in Samsun province. Greenwood et al. (2008) indicated that the dry matter yield of silage maize without water stress was 22 t/ha
Since water stress causes a decrease in leaf area index (Jamieson et al., 1995; Stone et al., 2001), a reduction in yield is observed because of low photosynthesis. Under non-stressed conditions, grain yield is directly affected positively by solar radiation (Kiniry et al., 1989; Muchow et al., 1990). The dry matter production of non-stressed plants is usually high compared to stressed plants since water-stressed plants can not utilise solar radiation effectively.
3.5. Relation water – dry matter yield
The relationships between ETa (mm) and dry matter yield (unit ?)were evaluated for 2009, 2010 and 2009-2010. The relationship between evapotranspiration and dry matter yield was linear (P< 0.01). The equation of relationship was Ya = 31.9* ETa - 2246.7 with R2 = 0.93 for 2009; Ya = 40.1*ETa - 5370 with R2 = 0.94 for 2010 and Ya = 34.3 * Eta - 3058 with R2 = 0.93 for 2009-2010 as seen in Fig. 6.
A linear relationship has been reported between corn grain yield and evapotranspiration (Gencoglan and Yazar 1999; Istanbulluoglu et al. 2002; Kirnak et al 2003; Cakir 2004; Dagdelen et al. (2006); Payero et al. (2006). Overman and Martin (2002) confirmed the linear relation between grain and silage yield response to irrigation for corn. For silage maize, Fatih et al. (2008) found linear relationship between evapotranspiration and fresh yield.
y = 31,99x - 2246,74 ; R2 = 0,93** (2010) y = 40,12x - 5370,32 ; R2 = 0,94** (2009) 0 2000 4000 6000 8000 10000 12000 14000 16000 0 100 200 300 400 500 600 ETa (m m ) D ry m a tte r y ie ld (K g/ ha ) 2010 2009 y = 34,27x - 3058,15 ; R2 = 0,93** (2009-2010)
Fig. 6: Dry matter yield of silage maize as a function of ETa
Water use efficiency (WUE) calculated by dividing dry matter yield (kg ha-1) to evapotranspiration (mm) varies and depends on the irrigation modes (Table 3). The lowest WUE value was obtained under the more stress treatment (T5) in 2010. For both years, WUE increases with the irrigation water amount,whichexplaines that dry matter (DM) accumulation was increased by irrigation. Schmaler et al. (2003) confirmed that irrigation resulted in total dry matter of silage corn increase
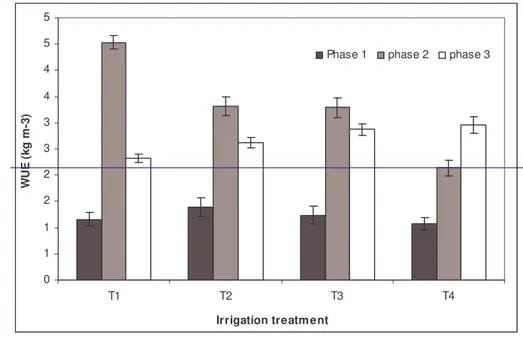
WUE was also different depending on the growth phases (Fig. 7). Growth linear phase was characterized by highest values of WUE under modes T1 followed by T2 and T3. Variance analysis shows that differences between treatments are non-significant in 1st phase, significant (5%) in 2nd phase and non-significant in 3rd phase. Water use efficiency decreases with water stress in 2nd phase.
In 2nd phase of growth, plants under T2 and T3 received two irrigations and expressed the same level of water valorization as 3.32 and 3.28 kg m-3 respectively. Although, treatment T1 also received two irrigations with higher valorization than T2 and T3 since it received furthermore an irrigation just before the end of the first phase (irrigation at 31st days after sowing). In 3rd phase, the two irrigations allocated to T1 are less valorized compared with T3 and T4 which did not receive water at this stage. A same statement applies to T2 which received an irrigation at the beginning of this 3rd phase
0 1 1 2 2 3 3 4 4 5 5 T1 T2 T3 T4
Irrigation treatm ent
WU E ( k g m -3 )
Phase 1 phase 2 phase 3
Fig. 7: Wate use efficiency for each irrigation mode and growth phase – year 2010
In Turkey, Fatih et al. (2008) found that water use efficiency of silage maize depends on irrigation mode and ranges between 0.32 kg m-3 without irrigation and 1.53 kg m-3 at full irrigation. According to the same authors, the lowest values of WUE were obtained under continuous stress conditions and that WUE increases with irrigation. In Lebanon, Fadi et al. (2003) found that water use efficiency calculated for aboveground dry matter of corn at full irrigation was 3.23 kg m-3.
Gheysari et al. (2007) did not find significant differences between values of WUE calculated for different irrigation treatmens and that WUE decreases with water deficit. Gencoglan and Yazar (1999), Zhang et al. (2004) and Dagdelen et al. (2006) found the lowest value of WUE for corn in stress conditions (non- irrigated). In Lebanon, Karam et al. (2003) found that water stress increases water use efficiency related to dry matter. Calculated values of this parameter are on average of 3.16 and 3.23 kg m-3 under 100 and 60%ETc respectively.
3.6. Yield response factor (Ky) to water
Yield response factor (Ky) to water was calculated combining results of 2009 and 2010. Relative total dry matter yield (Yd) and relative actual evapotranspiration (ETd) were used to determine relative yield reduction (1 - Yd) and relative evapotranspiration reduction (1 - ETd). A linear regression equation was adjusted to the data (Fig. 8). The Ky value of silage maize to water deficit for the entire growing season was 1.12, the coefficient of determination (r2) was 0.92 and the relationship was statistically significant at the level of P< 0.05.
The Ky value of 1.12 obtained in this study agreed with the Ky values reported by Doorenbos and Kassam (1979) of 1.25 for total growing period and of 2.3 for flowering + yield formation period. In addition, yield response factor values obtained using relative evapotranspiration reduction and relative corn grain yield reduction was reported by Gencoglan and Yazar (1999) as 1.08–1.61, Istanbulluoglu et al. (2002) as 0.76, Kirnak et al. (2003) as 0.77–0.81, Cakir (2004) as 0.81–1.36 and Dagdelen et al. (2006) as 1.03–1.04 for different regions. Oktem et al. (2003) showed that Ky value increases with water stress.
y = 1,12x R2 = 0,92 0,0 0,1 0,2 0,3 0,4 0,5 0,6 0,7 0,8 0,9 1,0 0,0 0,1 0,2 0,3 0,4 0,5 0,6 0,7 0,8 0,9 1,0 ETd=1-(ETa/ETm ) Yd = 1 -( Ya /Y m )
Fig.8: Yield response factor Ky
4. Conclusions
Results of two years showed that water stress has an effect on growth and dry matter yield of the silage maize. The monitoring of height plant evolution allowed distinguishing three phases of growth. The effect of irrigation modes is remarkable during the linear phase caracterized by higher accumulation of dry matter. According to results, water stress reduced leaf area index mainly through sheets senescence (pourtant les LAIX sont différents !!). Water deficit has a significant effect on the final dry matter yield. Water use efficiency was higher during the linear phase and decreases with water stress. A positive linear relationship was obtained between actual evapotranspiration and dry matter yield. The yield response factor to water (Ky) was 1.15. This value can be used as a base of any development strategy of irrigation in the Moroccan zones with arid and semiarid climate where the water resources are limited.
Acknowledgments
We thank Hamdi Mossadak and Sabir Mohamed for their help in the field work. We also thank Dr. Bahri A. and Bay Y. for valuable comments on the manuscript. The research was supported by the Institut National de la Recherche Agronomique (Morocco), la Coopération Technique Belge (Belgium) et le Cemagref (France).
References
Allen, R.G., L.S. Pereira, D. Raes and M. Smith 1998. Crop evapotranspiration: guidelines for computing crop water requirements. Irrigation and Drainage Paper n. 56. FAO, Rome, Italy, 300 pp.
Bekele S, Tilahun K (2007) Regulated deficit irrigation scheduling of onion in a semiarid
region of Ethiopia. Agric Water Manage 98(1–2):148–152
Bennouna B., Lahrouni A. et Khabba S., 2005. Paramètres de croissance du maïs dans le
Haouz de Marrakech (Maroc). Cahiers Agricultures, 14 (5) 437-446
Birch C.J., Andrieu B, Fournier C. 2002. Dynamics of internode and stem elongation in
Bouazzama B. Xanthoulis D. et Bouaziz A. 2007. Validation du modèle SIRMOD pour
améliorer les performances de l’irrigation de la luzerne par la Robta au niveau du périmètre irrigué de Tadla. Hommes, Terre et Eaux, 136 : 8-16
Brouwer et Heibloem, 1986. Irrigation water management : irrigation water needs. Training
manual n°3, FAO, Rome
Buniak W, Dmowski Z, Szyszkowski P. 1996. The yield and crop quality composition of
maize for silage under sprinkler irrigation. Zeszyty Problemowe Postepow Nauk Rolniczych 438:243–249
Cakir R. 2004. Effect of water stress at different development stages on vegetative and
reproductive growth of corn. Field Crops Res 89:1–16
Cigdem I, Uzun F. 2006. A study on some silage sorghum cultivars which can be cultivated
as second crop at plains in Samsun. J Fac Agric OMU 21(1):14–19
Cochran, W., Cox, G., 1957. Experimental Design. Wiley, New York.
Dagdelen N, Yilmaz E, Sezgin F, Gurbuz T. 2006. Water-yield relation and water use
efficiency of cotton (Gossypium hirsutum L.) and second crop corn (Zea mays L.) in western Turkey. Agric Water Manage 82:63–85
Doorenbos, J. and A.H. Kassam 1979. Yield response to water. Irrigation and Drainage Paper n. 33. FAO, Rome, Italy, 193 pp.
Emile JC, Al-Rifai M, Charrier X, Leroy P, Barriere Y. 2006. Grain sorghum silages as an
alternative to irrigated maize silage. In: Proceedings of the 21st general meeting of the european grassland federation, April 3–6, Badajoz, Spain
Fadi Karam , Jôelle Breidy , Chafic Stephan , Joe Rouphael. 2003.
Evapotranspiration, yield and water use efficiency of drip irrigated corn in the Bekaa Valley of Lebanon. Agricultural Water Management 63:125–137
Fatih M. K., Ustun S., Yasemin K. and Talip T., 2008. Determining water-yield
relationship, water use efficiency, crop and pan coefficients for silage maize in a semiarid region. Irrig. Sci.
Fournieu C. et Andrieu B., 2000. Dynamic of the elongation of internodes in maize (zea
Mays L.): analysis of phases of elongation and their relationships to phytomer development. Ann Bot (Lond); 86:551-563
Garrity, P.D., Watts, D.G., Sullivan, C.Y., Gilley, J.R., 1982. Moisture deficits and grain
sorghum performance: evapotranspirasion yield relationships. Agron. J. 74, 815–820.
Gencoglan et Yazar, 1999. The effects of deficit irrigations on corn yield and water use
efficiency. Tr J Agric Forest 23:233-241
Gheysari M, Mirlatifi SM, Homaee M, Hoogenboom G. 2007. Water use efficiency of
silage maize under deficit irrigation and nitrogen fertigation. In: ASA-CSSA-SSSA 2007 International Annual Meetings, November 4–8, New Orleans, Louisiana
Girardin P, Jordan MO, Picard D, Trendel R. 1986. Harmonisation des notations
concernant la description morphologique d’un pied de maïs (Zea mays L.). Agronomie, 6, 873-875
Greenwood KL, Mundy GN, Kelly KB. 2008. On-farm measurement of the water use and
productivity of maize. Aust J Exp Agric 48(3):274–284
Howell TA, Cuenca RH, Solomon KH (1990) Crop yield response. In: Hoffman GJ, Howell
TA, Solomon KH (eds) Management of farm irrigation systems. ASAE Monograph no:9, 2950 Niles Road, St. Joseph, MI, pp 93–122
Hsiao, T.C., 1990. Measurements of plant water status. Annu. Rev. Plant Physiol. 24, 519–
570.
Istanbulluoglu A., Kocaman I, Konukcu F., 2002. Water use production relationship of
maize under Tekirdage conditions in turkey. Pak J Biol Sci 5 (3): 287-291
Jamieson, P.D., Martin, R.J., Francis, G.S., Wilson, D.R., 1995. Drought effects on
biomass production and radiation use efficiency in barley. Field Crops Res. 43, 77–86.
Jebbour s.1995. Utilisation conjuguée des eaux de surface et des eaux souterraines dans le
périmètre irrigué du Tadla : aspects quantitatif et qualitatif. Mémoire de 3eme cycle, I.A.V. Hassan II, Département Génie Rural, Rabat, Maroc
Johnson BL, Henderson TL (2002). Water use efficiency. Water use patterns of grain
amaranth in the northern Great Plains. Agron J 94:1437–1443
Kang, S., Liang, Z., Hu, W., Zhang, J., 1998. Water use efficiency of controlled alternate
irrigation on rootdivided maize plants. Agric. Water Manag. 38, 69–76.
Kiniry, J.R., Jones, J.C., Toole, J.C., Blanchet, R., Cabelguenne, M., Spanel, D.A., 1989.
Radiation use efficiency in biomass accumulation prior to grain filling for five grain-crop species. Field Crop Res. 20, 51–64.
Kirnak H, Gencoglan C, Degirmenci V. 2003. Effect of deficit irrigation on yield and
growth of second crop corn in Harran plain conditions. Ataturk Univ J Fac Agric 34(2):117– 123
Li QS, Willardson LS, Deng W, Li XJ, Liu CJ. 2005. Crop water deficit estimation and
irrigation scheduling in western Jilin province, northeast China. Agri Water Manag. 71:47–60
Mollier allain, 1999. Croissance racinaire du maïs (Zea mays L.) sous déficience en
phosphore. Etude expérimentale et modélisation. Thèse pour obtention de Grade de docteur en science de l’Université Paris XI Orsay. France
Muchow, R.C., Sinclair, T.R., Bennett, J.M., 1990. Temperature and solar radiation effects
on potential maize yield accord locations. Agron. J. 82, 338–343.
Naescu V., 2000. The irrigation effect on silo maize yield in Romanian plain. Probleme de
Agrofitotechnie Teoretica si aplicata 22 (1-2) : 51-57
Narandra K., Tyagi, Dinesh K. Sharma and Surendra K Luthra. 2002. Determination of
evapotranspiration for maize and berseem clover. Irrigation Science; 21:173-181
Oktem A.,
Mehmet Simsek, A. Gulgun Oktem
. 2003. Deficit irrigation effects on sweetcorn (Zea mays saccharata Sturt) with drip irrigation system in a semi-arid region I. Water-yield relationship. Agricultural Water Management, 61: 63–74
ORMVAT, 2009. Données statistiques. Monographie
Otegui ME, Andrade FH, Suero EE.1995. Growth, water use, and kernel abortion of maize
subjected to drought at silking. Field Crop Res 40(2):87–94
Overman AR, Martin FG. 2002. Corn response to irrigation and tillage. Commun Soil Sci
Plant Anal 33(19–20):3603–3608
Pandey, R.K., Maranvilla, J.W., Chetima, M.M., 2000. Deficit irrigation and nitrogen
effects on maize in a Sahelian environment. Part II. Shoot-growth, nitrogen uptake and water extraction. Agric. Water Manag. 46, 15–27.
Payero JO, Melvin SR, Irmak S, Tarkalson D. 2006. Yield response of corn to deficit
irrigation in a semiarid climate. Agric Water Manage 84:101–112
Schmaler K, Kru¨ger U, Richert H. 2003. Ertrag und qualita¨t von silomais in abha¨ngigkeit
vom wasserangebot. Arch Agron Soil Sci 49(4):357–374
Scott HD (2000) soil–plant–water relations. Soil physics. Agricultural and environmental
applications. Iowa State University, 2121 South State Avenue, Ames, Iowa, pp 322–355
Smith, M., Allen, R.G., Monteith, J.L., Perrier, A., Pereira, L., and Segeren, A., 1991.
Report of the expert consultation on procedures for revision of FAO guidelines for prediction of crop water requirements, UN – FAO, Rome, Italy, 54 p.
Stone, P.J., Wilson, D.R., Jamieson, P.D., Gillespie, R.N., 2001. Water deficit effects on
sweet corn. Part II. Canopy development. Aust. J. Agric. Res. 52, 115–126.
Wagger MG, Cassel DK. 1993. Corn yield and water-use efficiency as affected by tillage
Yazar, A., Howell, T.A., Dusek, D.A., Copeland, K.S., 1999. Evaluation of crop water
stress index for LEPA irrigated corn. Irrig. Sci. 18, 171–180.
Zhang Y, Kendy E, Qiang Y, Changming L, Yanjun S, Hongyong S. 2004. Effect of soil
water deficit on evapotranspiration, crop yield, and water use efficiency in the north China plain. Agric Water Manage 64:107–122