During the last few years, there has been a great interest in the development of fast liquid chromatography. Among the reported approaches, the reduction of the particle size to attain sub-2µm diameter represents a good solution for achieving both increased separation power and faster analysis time. This paper demonstrates the chromatographic performance of such supports using plate-height curves and reveals the possibility for obtaining ultra-fast or highly efficient separations, according to the column geometry and system pressure limitations. The stability of these columns is initially evaluated using a system suitability experiment. The chromatographic performance remains stable in terms of retention, efficiency, and pressure for more than 1700 injections with pressure conditions ranging from 200 to 800 bar. Several fast and ultra-fast pharmaceutical applications are reported. In isocratic mode, a 5- to 10-fold reduction in analysis time is obtained with limited influence on efficiency and resolution. The run time is further reduced by 30-fold with the shorter available columns (i.e., 30 mm length). In gradient mode, the separation of a complex mixture containing an active pharmaceutical compound and related impurities is significantly improved with column length equal to 100 mm, to increase peak capacity and resolution.
Introduction
High selectivity and fast analyses are two of the driving forces of high-performance liquid chromatography (HPLC). Most of the common pharmaceutical applications such as purity assay, purity profiling, pharmacokinetic study, validation procedure, and quality control necessitate fast and efficient analytical procedures. The reduction in the average particle size of chromatographic supports is a good approach for achieving both increased separation power and faster analysis time. In the past, several authors (1–6) demonstrated the importance of small particles (around 1 to 2 µm) for improving LC performance. In 1977, Knox stated (5) that for making full
use of the high pressure available from “modern pumps”, par-ticles in the range 1–2 µm should be used to obtain t0around 10 s and pressure drop lower than 200 bar. However, the column length would be very short (from 20 to 40 mm) because of pressure limitation. The same author (3) also indi-cated the importance for working on injection and detection miniaturization to get the full potential of LC.
Column manufacturers made much progress over the years in terms of packing materials and chromatographic systems (7–11). Improvements in particle production have resulted in the commercial availability of small and highly uniform porous silica supports. In the 70’s, columns packed with 10 µm parti-cles were introduced; in the late 80’s, 5 µm became the stan-dard diameter, while 3 µm particles were launched in the 90’s. In 2004, the breakthrough finally came with the successful introduction of sub-2 µm porous particles by Waters (12) and several other providers (13,14). However, the pressure required for pumping the mobile phase through a column packed with such small particles can be prohibitive for standard HPLC hardware because it is directly proportional to the cube of par-ticle diameter at the optimal mobile phase flow rate, according to the well-known Darcy’s law (7). Some improvements to the chromatographic system have been made to address this problem in terms of pumping units, injector valves, and columns able to operate at extreme pressures. Jorgenson et al. (15) developed an ultra high-pressure liquid chromatography (UHPLC) system compatible with pressure 10-fold higher than conventional LC (approximately 4,100 bar). In their work, 1.5 µm non-porous particles were used to obtain highly efficient separations (140,000 < N < 190,000) within a reasonable analysis time (less than 10 min). In 2003 (16), additional improvements made their system compatible with pressure up to 7,000 bar and non-porous columns packed with 1 µm were used to attain efficiency up to 300,000 plates. Neverthe-less, because of several problems reported in UHPLC for sample introduction (17), safety concerns (18), solvent compressibility (19), and frictional heating (20), 7,000 bar was difficult to handle routinely (16).
In 2004, a commercial system capable of withstanding pres-Rossana Russo2, Davy Guillarme1, Dao T.-T. Nguyen1, Carlo Bicchi2, Serge Rudaz1, and Jean-Luc Veuthey1,*
1Laboratory of Analytical Pharmaceutical Chemistry, School of Pharmaceutical Sciences, University of Geneva, University of Lausanne, Boulevard d’Yvoy 20, 1211 Geneva 4, Switzerland and2Laboratory of Phytoanalysis, Dipartimento di Scienza e Tecnologia del Farmaco, Turin University, Via P. Giuria 9-10125 Turin – Italy
Pharmaceutical Applications on Columns
Packed with Sub-2 µm Particles
*Author to whom correspondence should be addressed: email [email protected]. Abstract
sure up to 1000 bar, named ultra-performance liquid chro-matography (UPLC), was successfully launched by Waters. Currently, several other providers (i.e., Agilent Technologies, Thermo Fisher Scientific, and Jasco, Inc.) propose systems able to operate at pressure higher than 400 bar. Many appli-cations can be found in the literature on the applicability of such systems (21–25). Moreover, several reviews were dedi-cated to UPLC (7,26) and a special issue of “Journal of Separation Science” was devoted to this topic (27). A recent
comparison between the different providers demonstrated that all instruments were able to provide reliable and repro-ducible data (28). Comparison in terms of qualitative and quantitative performance between UPLC and other analytical approaches including conventional LC, monoliths, or high-temperature liquid chromatography was also performed (29,30). These studies demonstrated that UPLC represents the most suitable strategy for reducing analysis time without sacrificing quantitative performance and chromatographic resolution.
This work describes the use of UPLC for the analysis of low molecular weight drugs, using UV detection. The concepts and benefits of columns packed with sub-2 µm particles at very high-pressure conditions were assessed. For this purpose, column packing stability and chromatographic performance were evaluated for pressure ranging between 200 and 800 bar. Several pharmaceutical applications in isocratic as well as gra-dient mode demonstrated the possibility to obtain ultra-fast and/or highly efficient separations in UPLC.
Experimental
ApparatusInstrument for experiments performed with 5 µm particles
Separations with conventional LC 5 µm columns were per-formed with a Merck LaChrom system (Merck, Darmstadt, Germany) consisting of 7100 programmable pumps, a L-7200 auto-sampler with a 100 µL loop (injection of 10 µL for both sets of conditions), a L-7614 on-line degasser, a L-4250 UV–vis programmable detector, and a column oven. The UV–vis detector contained a 14 µL standard flow cell, the time con-stant was set at 0.1 s, and data sampling rate was 10 Hz. Data acquisition, data handling, and instrument control were per-formed with the D-7000 HPLC System Manager Software (Merck). Extra-column band broadening of this instrument was estimated at approximatelyσ2
ext= 200 µL2at 1000 µL/min (31) and dwell volume at Vd= 1.3 mL (32).
UPLC instrument for experiments performed with sub-2 µm particles
Fast LC separations were performed with the Waters Acquity UPLC system (Waters, Milford, MA), which can withstand pres-sures up to 1000 bar. This instrument included a binary solvent manager with a maximum delivery flow rate of 2 mL/min, an auto-sampler with a 2 or 5 µL loop (depending on column geometry), a UV–vis programmable detector, and a column oven set at 30°C. The UV–vis detector contained a 500 nL flow
cell, the time constant was set at 25 ms, and data sampling at 80 Hz. Data acquisition, data handling, and instrument control were performed by Empower Software (Waters). Extra-column band broadening of this instrument was estimated at approx-imatelyσ2
ext= 5 µL2at 600 µL/min (31) and dwell volume at Vd= 0.13 mL for the 5 µL injection loop (32).
Chemicals and columns
Compounds used for qualitative comparison (uracil, methyl-paraben, ethylmethyl-paraben, propylmethyl-paraben, and butylparaben) were obtained from Sigma-Aldrich (Steinheim, Germany).
A formulation of Rapidocaïne 0.5% was provided by Sin-tetica SA (Mendrisio, Switzerland). The active ingredient is lidocaïne hydrochloride, a basic drug with a pKa of approxi-mately 8 and a log P of approxiapproxi-mately 2.36 (calculated using Advanced Chemistry Development [ACD/Labs] Software V8.14 for Solaris [1994–2006 ACD/Labs]). Lidocaïne hydrochloride was obtained from Sigma-Aldrich (Steinheim, Germany) and 2,6-dimethylaniline from Fluka (Buchs, Switzerland). The latter was added in the formulation at a concentration of 5 µg/L.
Bromazepam, nitrazepam, oxazepam, clonazepam, alpra-zolam, flunitrazepam, and diazepam were purchased from Lipomed AG (Arlesheim, Switzerland) as stock standard solu-tions at 1 mg/mL in MeOH and stored at 4°C until use. These compounds possess weak basic moieties, with an average pKa value of 2.
Finally, an active substance (AC) was provided as standard by a pharmaceutical company with process-related substances, other impurities, and degradation compounds.
Acetonitrile was of HPLC gradient grade from Panreac Quimica (Barcelona, Spain). Water was obtained from a Milli-Q Waters Purification System from Millipore (Bedford, MA). Formic acid was obtained from SDS (Peypin, France). Aqueous phosphate buffer 50mM at pH 7.2 was prepared with an equiv-alent quantity of di-potassium hydrogen phosphate anhydrous (Fluka, Buchs, Switzerland) and potassium dihydrogen phos-phate (Fluka). Aqueous acetate buffer 50mM pH 7 consisted of a 50mM ammonium acetate buffer (Fluka) adjusted with ammonia. The pH was measured with a Metrohm pH meter (Herisau, Switzerland) and corresponded to the aqueous pH value.
Columns used throughout this study were Hypersil GOLD C18supports, provided by Thermo Fisher Scientific (Runcorn, UK). Various column geometries were used: 150× 4.6 mm, 5 µm; 30× 2.1 mm, 1.9 µm; 50 × 2.1 mm, 1.9 µm; and 100 × 2.1 mm, 1.9 µm.
Methodology for method transfer
A methodology has been described elsewhere (31,32) for transferring a chromatographic separation performed with a given column geometry and chemistry to a column packed with similar or identical stationary phase, without influence on chromatographic performance.
Briefly, in isocratic mode (31), the injection volume and mobile phase flow-rate should be adapted while the mobile phase composition, nature, and temperature remained iden-tical to the original method. A suitable instrumentation must
be used, particularly with smaller column dimensions, to limit the negative influence of extra-column band broadening on the separation performance.
In gradient mode (32), injection volume and mobile phase flow rate should be adapted as in isocratic mode. Regarding the gradient profile, it is important to scale the gradient volume in proportion to the column volume to yield identical elution patterns, using simple scaling equations. In gradient mode, special attention should be paid to the dwell volume (gradient delay volume), which causes the most detrimental effect during method transfer.
Optimal conditions for method transfer were established in isocratic and gradient mode using a freely usable Excel pro-gram distributed on an internal website (33).
Results and Discussion
Column stabilityThe routine use of columns packed with sub-2 µm particles remains quite recent and the few published studies only con-cerned hybrid silica-based stationary phases provided by Waters. These works demonstrated a very good resistance of the support in high-pressure conditions with up to 4000 injec-tions (34) or 1000 injecinjec-tions at pH 11.3 (35). Because the columns used throughout the present study were provided by another supplier, no indications concerning stability were available.
For this purpose, a test mixture consisted of 4 parabens and uracil was injected into the system with pressure conditions ranging from 200 to 800 bar. The mobile phase was unbuffered (i.e., ACN–water mixture [40:60, v/v]) and constantly pumped through the column at a flow rate comprised between 300 and 1320 µL/min (to achieve adequate pressures). With the 50 mm column length, 500 injections were initially performed at 200 bar (representing approximately 3000 column volumes) fol-lowed by 500 additional injections at 400 bar. Then, 300
injec-tions were carried out at 600 bar and finally 400 injecinjec-tions at 800 bar. To summarize, the column was tested with 1700 injec-tions, equivalent to approximately 10000 column volumes, with a sequential increase in flow rate.
Chromatographic performance was evaluated by means of efficiency (N), retention factor (k), asymmetry at 10% of peak
height (As), and column backpressure (∆P). Uracil was used for determining column dead volume. Only results of efficiency have been reported in Figure 1. Chromatographic parameters (N, k, or As) varied with pressure conditions because of flow rate changes (between 300 and 1320 µL/min). Therefore, each parameter was plotted on a relative scale (%), to directly com-pare results independently of the applied flow rate.
No significant change in efficiency was observed for the four tested compounds after 1700 injections under high pressure up to 800 bar. Corresponding relative standard deviations were between 0.8% and 1.1%. Regarding As, initial tailing values were comprised between 1.3 for methylparaben and 1.06 for butylparaben. When pressure increased up to 800 bar, As values decreased by approximately 10%, and final values were in the range 0.98–1.15. Therefore, a long-term exposure to high pres-sure did not appear detrimental for peak shape. Finally, k was stable after 1700 injections (data not shown) with a variation lower than 0.2% from the beginning to the end of the tested period.
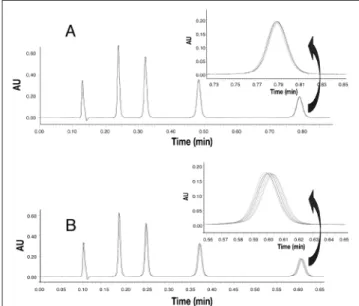
Chromatograms acquired during the stability study are given in Figures 2A and 2B for the highest tested pressures. Chro-matograms periodically obtained were overlaid at each pres-sure, and no significant differences were observed on the quality of the separation after a significant number of injec-tions. Furthermore, retention time changed less than 1 s at the highest pressure. Consequently, the reliability of the tested sub-2 µm chromatographic support was considered accept-able.
Figure 1. Stability study of Hypersil GOLD 50× 2.1 mm, 1.9 µm column:
variation of efficiency for the four selected parabens: 500 injections at 200 bar and F = 300 µL/min, 500 injections at 400 bar and F = 640 µL/min, 300 injections at 600 bar and 960 µL/min, and finally 400 injections at 800 bar and F = 1320 µL/min.
Figure 2. Evaluation of column repeatability at 600 and 800 bar: repetition
of a system suitability experiment (separation of uracil and 4 parabens). Overlaid chromatograms for injection: 1, 50, 100, 150, 200, 250, and 300 at a pressure of 600 bar (A). Overlaid chromatograms for injection: 1, 50, 100, 150, 200, 250, 300, 350, and 400 at a pressure of 800 bar (B).
Chromatographic performance
Performance of columns packed with 5 and 1.9 µm was compared and corresponding plate height curves plotted in Figure 3A for butylparaben at 30°C (kbutylparaben = 5). Least
square regression was employed to fit experimental data (H, u) with H = A + B/u + Cu, derived from the Van Deemter equation.
When particle size decreased, Hopt value diminished pro-portionally, from 11.1 to 4.9 µm. Therefore, for an equivalent column length, N value was improved by a factor 2.3. From a theoretical point of view, N should be increased by a factor 2.6 (ratio 5 µm/1.9 µm). Because extra-column contributions were negligible for butylparaben (k = 5), this discrepancy could be
attributed to the packing procedure (it is more difficult to homogeneously pack columns with sub-2 µm particles) or to the influence of particle size distribution, as recently demon-strated with sub-2 µm particles (36). Nevertheless, both columns presented an acceptable theoretical hopt(5) equal to 2.21 and 2.57 with 5 and 1.9 µm particles, respectively. The optimal mobile phase velocity (uopt) increased from 1.2 to 3.2 mm/s for a particle size reduction from 5 to 1.9 µm, leading to a reduction in analysis time in agreement with theory (uopt× dp= cte). The mass transfer resistance (i.e., C term of the H = f[u] equation, corresponding to the right part of the plate height curve) was significantly improved, allowing the appli-Figure 3. Effect of particle size on the chromatographic performance of
Hypersil GOLD support. Solute: Buytlparaben. Van Deemter curves H = f(u) for:▲= 150× 4.6 mm, 5 µm, and●= 50× 2.1 mm, 1.9 µm.
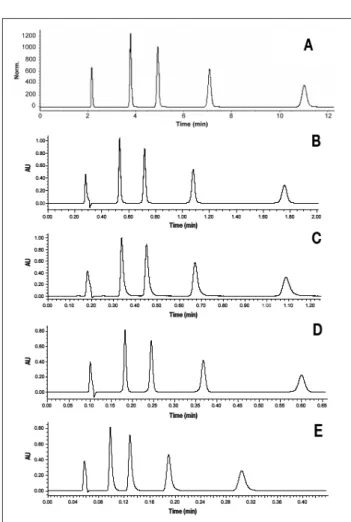
Figure 4. Chromatogram of a mixture containing uracil and 4 parabens on
Hypersil GOLD supports in isocratic conditions with a mobile phase ACN–water (40:60, v/v), T = 30ºC,λ = 254 nm. Column 150 × 4.6 mm, 5 µm, F = 800 µL/min, and Vinj = 20 µL (A). Column 50× 2.1 mm, 1.9 µm, F = 440 µL/min, and Vinj = 2 µL (B). Column 30× 2.1 mm, 1.9 µm, F = 440 µL/min, and Vinj = 1.5 µL (C). Column 50× 2.1 mm, 1.9 µm, F = 1320 µL/min, and Vinj = 2 µL (D). Column 30× 2.1 mm, 1.9 µm, F = 1640 µL/min, and Vinj = 1.5 µL (E). Elution order: uracil, methylparaben, ethyl-paraben, propylethyl-paraben, butylparaben; each at 50 mg/L.
Figure 5. Chromatogram of reconstituted rapidocaïne formulation obtained
in isocratic mode with a mobile phase containing ACN–water (40:60, v/v) with phosphate buffer 50 mM at pH 7, T = 30ºC,λ = 230 nm. Hypersil GOLD 150× 4.6 mm, 5 µm, F = 1000 µL/min, Vinj = 20 µL (A). Hypersil GOLD 50× 2.1 mm, 1.9 µm, F = 550 µL/min, Vinj = 1.4 µL (B). Hypersil GOLD 50× 2.1 mm, 1.9 µm, F = 1300 µL/min, Vinj = 1.4 µL (C). Hypersil GOLD 30× 2.1 mm, 1.9 µm, F = 1600 µL/min, Vinj = 0.8 µL (D). Elution order: 1, methylparaben at 0.08 mg/L; 2, 2,6-dimethylaniline at 0.005 mg/L; 3, propylparaben at 0.01 mg/L; 4, lidocaïne hydrochloride at 500 mg/L.
cation of higher flow rates than its optimal value without sig-nificant reduction in N. At the highest tested flow rate, only 25% loss in efficiency was reported on the column packed with 1.9 µm particles.
The variation of pressure with flow rate was not reported, but clearly remained the limiting parameter for columns packed with sub-2 µm particles, as discussed elsewhere (7,14,30). However, with column and instrumentation compatible with
very high pressure, the potential of sub-2 µm could be fully exploited (30).
Chromatograms obtained on the tested column geometries with the test mixture of parabens are shown in Figure 4. Cor-responding N, As, minimal Rs, ∆P, and analysis times are reported in Table I. Performance achieved at the optimal flow rate (800 µL/min), with the conventional 150× 4.6 mm, 5 µm column was excellent with an efficiency of 13500 plates for
Table I. Evaluation of Chromatographic Performance for Isocratic Separations of Parabens Given in Figure 4; Data are Given for Methylparaben (peak 2) and Butylparaben (peak 5)
5 µm Sub-2 µm
150×× 4.6 mm 50 ×× 2.1 mm 30 ×× 2.1 mm
800 µL/min 440 µL/min 1000 µL/min 1320 µL/min 440 µL/min 1000 µL/min 1640 µL/min
Efficiency 13500 8100 6600 6100 3800 3200 3000 (peak 2) Asymmetry 1.13 1.19 1.16 1.12 1.76 1.7 1.59 (peak 2) Efficiency 13500 10300 8500 7400 5800 4900 4000 (peak 5) Asymmetry 1.12 1.02 1.01 0.94 1.34 1.46 1.35 (peak 5) Most critical 7.8 6.7 5.9 5.6 4.4 3.9 3.6 resolution Pressure 70 280 610 790 220 470 740 (bar) Analysis time – 6 14 18 10 23 36 reduction
Table II. Evaluation of Chromatographic Performance for Isocratic Separations of Rapidocaïne Formulation Given in Figure 5; Data are Given for 2,6-Dimethylaniline (peak 2) and Lidocaïne Hydrochloride (peak 4)
5 µm Sub-2 µm
150 ×× 4.6 mm 50 ×× 2.1 mm 30 ×× 2.1 mm
1 µL/min 550 µL/min 1000 µL/min 1300 µL/min 550 µL/min 1000 µL/min 1600 µL/min
Efficiency 12900 10700 9000 7800 5900 4900 3900 (peak 2) Asymmetry 1.13 1.06 1.07 1.03 1.4 1.37 1.18 (peak 2) Efficiency 10400 7300 6300 5600 4600 4000 3200 (peak 4) Asymmetry 1.15 0.85 0.83 0.81 1.11 1.15 1.1 (peak 4) Most critical 3.7 3.42 3.17 3.05 2.4 2.21 2.01 resolution Analysis time – 6 12 16 10 20 28 reduction
methyl- and butyl-paraben, and an average As of 1.1. How-ever, the analysis time was 11 min and should not be reduced because N dramatically decreased at higher flow rate.
With the 50 × 2.1 mm, 1.9 µm column, in optimal flow rate conditions (440 µL/min) (Figure 4B), the separation was satisfactory, with an efficiency of 8100 for methylparaben and 10300 for butylparaben, and asymmetry values similar to those obtained previously (Table I). The low efficiency observed for the former, with a retention factor of 2, was attributed to extra-column contributions. Nevertheless, on these condi-tions, the backpressure was only of ca. 280 bar, demonstrating that columns packed with sub-2 µm particles are compatible with conventional HPLC equipment in terms of pressure but requires a special attention to extra-column volumes. When the flow rate was increased to its maximum value, efficiency dropped significantly but the separation remained satisfac-tory and the analysis time was reduced 18-fold, as shown in Figure 4D.
Finally, resolution obtained with the 30 × 2.1 mm, 1.9 µm column was still sufficient but with significant efficiency reduc-tion, because extra-column volume contributions were pre-dominant with this shorter column length. Separations presented in Figures 4C (440 µL/min) and 4E (1640 µL/min) were acceptable in terms of minimal resolution with analysis time reduced by a factor 36 (ca. 20 s).
Applications
Several case studies were developed in isocratic and gra-dient modes to illustrate the applicability and benefits of par-ticle reduction in pharmaceutical analysis (quality control, screening method, or purity profiling).
Quality control: rapidocaïne formulation in isocratic mode
Rapidocaïne is a pharmaceutical for-mulation containing lidocaïne hydro-chloride, a local anaesthetic known for its cardiac anti-arrhythmia properties and two preservatives, methylparaben and propylparaben. A potential degrada-tion product, 2,6-dimethylaniline, was also added to the formulation for this study to assess selectivity. Chro-matograms obtained are given in Figure 5 and associated data summarized in Table II.
The method was originally developed on a Hypersil GOLD 150 × 4.6 mm, 5 µm column at a flow rate of 1 mL/min with phosphate buffer at pH 7.2. The separa-tion (Figure 5A) demonstrated N values in the expected range, varying from 12900 for 2,6-dimethylaniline to 10400 for lido-caïne hydrochloride. The low N of the latter was due to injection overloading necessary to simultaneously detect its degradation product, which could be pre-sent at very low level. Minimal resolution between peaks 2 and 3 was equal to 3.7 for Figure 6. Separation of a benzodiazepines mixture in isocratic mode with
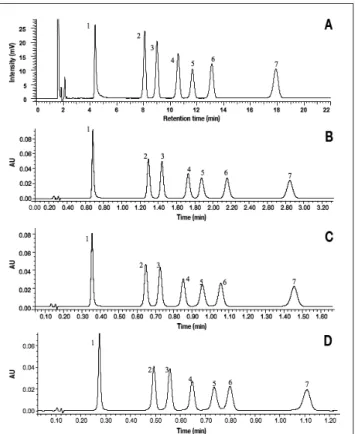
a mobile phase containing ACN–water (31:69, v/v) with 0.1% formic acid, T = 30°C, and λ = 254 nm. Hypersil GOLD 150 × 4.6 mm, 5 µm, F = 1000 µL/min, Vinj = 20 µL (A). Hypersil GOLD 50 × 2.1 mm, 1.9 µm, F = 550 µL/min, Vinj = 1.4 µL (B). Hypersil GOLD 50 × 2.1 mm, 1.9 µm, F = 1000 µL/min, Vinj = 1.4 µL (C). Hypersil GOLD 50 × 2.1 mm, 1.9 µm, F = 1320 µL/min, Vinj = 1.4 µL (D). Elution order: 1, bromazepam; 2, nitrazepam; 3, oxazepam; 4, clonazepam; 5, alprazolam; 6, flunitrazepam; and 7, diazepam, each at 10 mg/L.
Table III. Evaluation of Chromatographic Performance for Isocratic Separations of Benzodiazepines Given in Figure 6; Data are Given for Nitrazepam (peak 2) and Diazepam (peak 7)
5 µm sub-2 µm
150 ×× 4.6 mm 50 ×× 2.1 mm
1 mL/min 550 µL/min 1000 µL/min 1320 µL/min
Efficiency 11900 9700 7300 6000 (peak 2) Asymmetry 0.93 1.07 1.02 0.94 (peak 2) Efficiency 12200 9500 7800 6600 (peak 7) Asymmetry 0.94 0.98 0.94 0.95 (peak 7) Most critical 2.09 1.93 1.8 1.65 resolution Analysis time – 6 12 17 reduction
a 9 min analysis time.
This separation was transferred to shorter columns packed with sub-2 µm particles using the basic rules given in the literature (31,32). With the column of 50 mm at the geometrical transferred flow rate (F = 550 µL/min), performance was slightly altered in terms of resolution while the analysis time was reduced by a factor 6, as shown in Figure 5B. At a higher mobile phase flow rate, the resolution was reduced by 15% to 20% as shown in Table II and Figure 5C, but remained acceptable (Rs > 3), while a 12- to 16-fold reduction in analysis time was observed at F = 1000 and 1300 µL/min, respectively.
With the column of 30 mm and according to previous observations (Figure 3B), efficiency was reduced by approxi-mately 45%, leading to a minimal resolu-tion of 2.4 and 2, at flow rates of 550 and 1600 µL/min, respectively. Therefore, the separation obtained at the maximal flow rate with this column (Figure 5D) is suffi-cient to perform routine analyses in only 20 s.
Toxicological screening: benzodiazepines in isocratic mode
Benzodiazepines belong to a group of substances known for their tranquillizing, hypnotic, and anticonvulsant properties (37). These compounds possess weak basic moieties with average pKa of approximately 2. A simple and rapid pro-cedure in isocratic mode was developed for the simultaneous determination of seven benzodiazepines. Chromatograms obtained are given in Figure 6 and related data summarized in Table III.
The original method was developed on a conventional 150 × 4.6 mm, 5 µm column at a flow rate of 1 mL/min, with a mobile phase containing ACN–water (31:69, v/v) and 0.1% formic acid. The corresponding separation is given in Figure 6A and took 20 min, with a min-imal resolution between peaks 2 and 3 of 2.09 (average efficiency was 12000).
The method was transferred to a shorter column packed with 1.9 µm par-ticles. The chromatogram obtained at the optimal flow rate (550 µL/min) is given in Figure 6B with an analysis time reduced by a factor 6. N decreased by 20% (in agreement with previous obser-vations) and resolution of only 8%. With larger flow rates (1000 and 1320
Figure 7. Separation of active compound and 9 related impurities in gradient mode with a mobile phase
containing acetonitrile and ammonium acetate 50mM pH 7. T = 30°C and λ = 254 nm. Hypersil GOLD 150 × 4.6 mm, 5 µm, F = 1000 µL/min, Vinj= 20 µL, gradient profile: 38–46% ACN in 25 min
and 5 min step at the end of the gradient (A). Hypersil GOLD 50 × 2.1 mm, 1.9 µm, F = 550 µL/min, Vinj
= 1.4 µL, gradient profile: 38–46% ACN in 3.16 min and 0.63 min step at the end of the gradient (B). Hypersil GOLD 50 × 2.1 mm, 1.9 µm, F = 1000 µL/min, Vinj= 1.4 µL, gradient profile: 38–46% ACN
in 1.74 min and 0.34 min step at the end of the gradient (C). Hypersil GOLD 100 × 2.1 mm, 1.9 µm, F = 550 µL/min, Vinj= 2.8 µL, gradient profile: 38–46% ACN in 6.32 min and 1.26 min step at the end of
the gradient (D). Main compound concentration: 600 ppm and each impurity at 30 ppm.
Table IV. Evaluation of Chromatographic Performance for Gradient Separations of Main Compound and Related Impurities Given in Figure 7
5 µm sub-2 µm
150 ×× 4.6 mm 50 ×× 2.1 mm 100 ×× 2.1 mm 1 mL/min 550 µL/min 1000 µL/min 1300 µL/min 550 µL/min
Most critical 1.82 1.88 1.75 1.65 3.11 resolution (classic) Most critical 1.59 1.62 1.41 1.3 2.72 resolution (modified) Resolution 3.4 3.71 3.36 3.06 5.6 peaks 6–7 Analysis 25.2 3.8 2 1.6 7.5 time (min) Analysis – 6 12 16 3.5 time reduction
µL/min), efficiency was reduced by 35% and 45%, respec-tively, leading to an acceptable loss in resolution of 15% and 20%. As shown in Figures 6C and 6D, analysis times decreased 12- and 17-fold at 1000 and 1320 µL/min, respec-tively.
With the strict geometrical transfer (Figures 6A and 6B), selectivity was not altered, while at higher flow rate (Figures 6C and 6D), k of alprazolam (i.e., peak 5) significantly varied. This unexpected behavior suggested that the elevated backpressure conditions (comprised between 600 and 800 bar) lead to unde-sired phenomena such as frictional heating (causing thermal gradient inside the column). However, this modification was not critical because resolution always remained sufficient.
Purity profiling: active compound and related substances in gradient mode
A fundamental shortcoming of conventional HPLC is its limited resolving power, particularly for analyzing very complex mixtures. For years, the maximal achievable number of plates within an acceptable analysis time (less than 1 h) was limited to approximately 20,000 plates, but UPLC technology could sig-nificantly overcome this limit. Several authors experimentally demonstrated its potential for separations requiring a high resolution (38,39), and on the basis of theoretical kinetic plots (40–42). In the pharmaceutical industry, the resolving power is a key parameter because it is of primary importance in devel-oping analytical methods able to separate an active compound from its process-related substances, other impurities, and degradation compounds, for quantitative purity assay or purity profiling. As example, an active pharmaceutical ingredient was selected as the model compound with nine related compounds. Chromatograms obtained with this mixture are given in Figure 7 and data are summarized in Table IV. The original separation was performed in approximately 27 min on a conventional 150 × 4.6 mm, 5 µm column at a flow rate of 1 mL/min. Suit-able chromatographic conditions were found thanks to HPLC modelling software (Osiris, Datalys, Grenoble, France). The latter quickly determined optimal conditions for the separation with two initial gradient runs (gradient slope of 1% and 3%/min) at a given pH and temperature. Thus, the chro-matogram in Figure 7A corresponded to the highest resolution for the least separated pair of peaks, provided that the resolu-tion was higher than 1.5 and k in the range 1–10.
In the case of purity profiling, the active compound was not at the same concentration as other process-related substances (600 ppm vs. 30 ppm). Therefore, minimal resolution between peak 3 and “AC” was evaluated in two ways and both values are reported in Table IV. The first method was based on the basic equation of resolution: Rs= 2(tr2–tr1) Eq. 1 _________ Wb1+ Wb2
where tr2and tr1are the retention times of two adjacent peaks; Wb1 and Wb2are base-widths of the two peaks. The second approach takes into account differences in peak height (43) and gives a more reliable estimation of resolution:
Rs= (tr2–tr1) •
√
__ N Eq. 2 ____________________________ tr1+ tr2 • 1 + 0.5ln h2where h1and h2are the peak heights of two adjacent peaks. N is the average chromatographic efficiency (assumed to be iden-tical for both peaks).
Using equation 1, the minimal resolution between peak 3 and “AC” was equal to 1.82, while with equation 2, minimal res-olution was reduced to an acceptable value of 1.59 for the sep-aration presented in Figure 7A. This method was thus transferred to a 50 mm column packed with 1.9 µm particles. The optimal flow rate was found at 550 µL/min, the injected quantity 1.4 µL, and the gradient time was changed from 25 to only 3.2 min. The corresponding chromatogram is given in Figure 7B. Additionally, a 6-fold reduction in the overall analysis time (separation and reconditioning) was observed. The mobile phase flow rate was further increased to 1000 and 1300 µL/min. In gradient mode, it is mandatory to readapt the gradient profile when changing mobile phase flow rate (32). Gradient time was thus reduced to 1.7 and 1.3 min at 1000 (Figure 7C) and 1300 µL/min, leading to an overall analysis time reduction of 12- to 16-fold, compared to con-ventional LC experiments. However, in such conditions, reso-lution between peak 3 and “AC” calculated with equation 2 became lower than 1.5 (Rs = 1.41 at 1000 µL/min and 1.3 at 1300 µL/min), as shown in Figure 7C.
When dealing with a complex mixture and critical resolu-tions, longer columns can be used to increase substantially effi-ciency and peak capacity. Therefore, a 100 mm column length (generating approximately 20000 theoretical plates) was eval-uated for the separation of the active compound and related substances. Because the generated backpressure is directly proportional to column length, maximal acceptable flow rate was 550 µL/min. In such conditions, gradient run was reduced to 6.3 min and the corresponding chromatogram is given in Figure 7D. The analysis time was reduced by a factor of 3.5 compared to Figure 7A, and average resolution increased by 70% compared to the original method. This example demon-strated the possibility of obtaining highly efficient separations with sub-2 µm supports, when analysis time is not the main issue.
Conclusions
In this study, column stability was initially evaluated up to 800 bar in terms of efficiency, asymmetry, retention factor, and pressure. The evaluated sub-2 µm support remained still usable after 1700 injections in unbuffered mobile phase and very high-pressure conditions.
This work also clearly demonstrated the potential of 1.9 µm supports to obtain ultra-fast or highly efficient separations by simultaneously using very high pressure and mobile phase linear velocity. Several analytical methods (quality control,
√
( )
h1screening method, or purity profiling) originally developed in isocratic or gradient modes, were transferred to illustrate the benefits and limitations of the new UPLC technology. For a simple pharmaceutical formulation and for the separation of numerous benzodiazepines in isocratic mode, the analysis time was reduced 15- and 30-fold with columns of 50 and 30 mm, respectively, while resolution remained acceptable even at the maximal backpressure. For a complex purity profiling in gradient mode, the analysis time was reduced 6-fold with a column of 50 mm, with no loss in resolution. A 2-fold improve-ment in resolution was also observed for a longer column (i.e., 100 mm) packed with the same small particles while the analysis time was reduced by a factor of 3.
Acknowledgments
Authors would like to thank Thermo Fisher Scientific and particularly Harald Ritchie (Runcorn, UK) for the generous gift of Hypersil GOLD columns used throughout this study. Waters is also acknowledged for the loan of the UPLC system.
References
1. J.C. Giddings. Comparison of theoretical limit of separating speed in gas and liquid chromatography. Anal. Chem. 37: 60–3 (1965). 2. J.H. Knox. The speed of analysis by gas chromatography. J. Chem.
Soc. 1: 433–37 (1961).
3. J.H. Knox and M. Saleem. Kinetic conditions for optimum speed and resolution in column chromatography. J. Chromatogr. Sci. 7: 614–22 (1969).
4. M. Martin, C. Eon, and G. Guiochon. Study of the pertinency of pressure in liquid chromatography: I. theoretical analysis. J.
Chro-matogr. 99: 357–76 (1974).
5. J.H. Knox. Practical aspects of LC theory. J. Chromatogr. Sci. 15: 352–64 (1977).
6. J.C. Kraak, H. Poppe, and F. Smedes. Construction of columns for liquid chromatography with very large plate numbers: Theory and practice. J. Chromatogr. Sci. 122: 147–58 (1976).
7. D.T.T. Nguyen, D. Guillarme, S. Rudaz, and J.L. Veuthey. Fast analysis in liquid chromatography using small particles size and ultra high pressure. J. Sep. Sci. 29: 1836–48 (2006).
8. R.E. Majors. Fast and ultrafast HPLC on sub-2µm porous parti-cles—where do we go from here? LC-GC N.A. 23: 1248–55 (2005).
9. C.G. Horvath, B.A. Preiss, and S.R. Lipsky. Fast liquid chro-matography. Investigation of operating parameters and the sepa-ration of nucleotides on pellicular ion exchangers. Anal. Chem.
39: 1422–28 (1967).
10. E.V. Piel. Accelerated microparticulate bed liquid chromatog-raphy. Anal. Chem. 38: 670–72 (1966).
11. B.A. Bidlingmeyer, R.P. Hooker, C.H. Lochmuller, and L.B. Rogers. Improved chromatographic resolution from pressure-induced changes in liquid-solid distribution ratios. Sep. Sci. 4: 439–46 (1969).
12. M.E. Swartz. Ultra performance liquid chromatography (UPLC): An introduction. LC-GC N.A. Suppl: 8–14 (2005).
13. R.E. Majors. New chromatography columns and accessories at the 2006 Pittcon Conference: Part I. LC-GC N.A. 24: 248–66 (2006). 14. D.T.T. Nguyen, D. Guillarme, S. Rudaz and J.L. Veuthey. Chro-matographic behaviour and comparison of column packed with
sub-2µm stationary phases in liquid chromatography. J.
Chro-matogr. A 1128: 105–13 (2006).
15. J.E. Macnair, K.C. Lewis, and J.W. Jorgenson. Ultrahigh-pressure reversed-phase liquid chromatography in packed capillary columns. Anal. Chem. 69: 983–89 (1997).
16. A.D. Jerkovich, J.S. Mellors, and J.W. Jorgenson. The use of micron-sized particles in ultrahigh pressure liquid chromatog-raphy. LC-GC Eur. 16: 20–3 (2003).
17. N. Wu, J.A. Lippert, and M.L. Lee. Practical aspects of ultrahigh pressure capillary liquid chromatography. J. Chromatogr. A 911: 1–12 (2001).
18. Y. Xiang, D.R. Maynes, and M.L. Lee. Safety concerns in ultrahigh pressure capillary liquid chromatography using air-driven pumps.
J. Chromatogr. A 991: 189–96 (2003).
19. M. Martin and G. Guiochon. Effects of high pressure in liquid chromatography. J. Chromatogr. A 1090: 16–38 (2005). 20. L.A. Colon, J.M. Cintron, J.A. Anspach, A.M. Fermier, and
K.A. Swinney. Very high pressure HPLC with 1 mm i.d. columns.
Analyst 129: 503–04 (2004).
21. I.S. Lurie. High-performance liquid chromatography of seized drugs at elevated pressure with 1.7 µm hybrid C18 stationary phase columns. J. Chromatogr. A 1100: 168–75 (2005). 22. J.R. Mazzeo, U.D. Neue, M. Kele, and R.S. Plumb. Advancing LC
performance with smaller particles and higher pressure. Anal.
Chem. 77: 460A–67A (2005).
23. L. Novakova, L. Matysova, and P. Solich. Advantages of applica-tion of UPLC in pharmaceutical analysis. Talanta 68: 908–18 (2006).
24. K.A. Johnson and R. Plumb. Investigating the human metabolism of acetaminophen using UPLC and exact mass TOF MS. J. Pharm.
Biomed. Anal. 39: 805–10 (2005).
25. R. Li, L. Dong, and J. Huang. Ultra performance liquid chro-matography–tandem mass spectrometry for the determination of epirubicin in human plasma. Anal. Chim. Acta 546: 167–73 (2005).
26. N. Wu and A.M. Clausen. Fundamental and practical aspects of ultrahigh pressure liquid chromatography for fast separations.
J. Sep. Sci. 30: 1167–82 (2007).
27 Special Issue. High pressures and high temperatures in separation sciences. J. Sep. Sci. 30: 1099–26 (2007).
28. J.M. Cunliffe, S.B. Adams-Hall, and T.D. Maloney. Evaluation and comparison of very high pressure liquid chromatography systems for the separation and validation of pharmaceutical com-pounds. J. Sep. Sci. 30: 1214–23 (2007).
29. L. Novakova, D. Solichova, and P. Solich. Advantages of ultra-performance liquid chromatography over high-ultra-performance liquid chromatography: comparison of different analytical approaches during analysis of diclofenac gel. J. Sep. Sci. 29: 2433–43 (2006).
30. D. Guillarme, D.T.T. Nguyen, S. Rudaz, and J.L. Veuthey. Recent developments in liquid chromatography—impact on qualitative and quantitative performance. J. Chromatogr. A 1149: 20–9 (2007).
31. D. Guillarme, D. Nguyen, S. Rudaz, and J.L. Veuthey. Method transfer for fast liquid chromatography in pharmaceutical analysis: Application to short columns packed with small par-ticle—Part I, isocratic separation. Eur. J. Pharm. Bio. 66: 475–82 (2007).
32. D. Guillarme, D. Nguyen, S. Rudaz, and J.L. Veuthey. Method transfer for fast liquid chromatography in pharmaceutical analysis: Application to short columns packed with small particle—Part II, gradient separation. Eur. J. Pharm. Bio. 68: 430–40 (2008). 33. Laboratory of analytical pharmaceutical chemistry (LCAP). HPLC
calculator download. In: LCAP website [on-line]. Site updated on January 29th 2007. http://www.unige.ch/sciences/pharm/ fanal/lcap/divers/downloads.php
34. S. King, P.J. Stoffolano, E. Robinson, T.E. Eichhold, S.H. Hoke, II, T.R. Baker, E.C. Richardson, and K.R. Wehmeyer. The evaluation and application of ultra-performance liquid chromatography
(UPLC) for the rapid analysis of dose formulations. LC-GC N.A.
Suppl: 36–40 (2005).
35. E.S. Grumbach, T.E. Wheat, M. Kele, and J.R. Mazzeo. Devel-oping columns for UPLC: design considerations and recent devel-opments. LC-GC N.A. Suppl: 40–5 (2005).
36. J. Billen, D. Guillarme, S. Rudaz, J.-L. Veuthey, H. Ritchie, B. Grady, and G. Desmet. Relation between the particle size dis-tribution and the kinetic performance of packed columns: Appli-cation to a commercial sub-2µm particle material. J. Chromatogr.
A 1161: 224–33 (2007).
37. O.H. Drummer. Methods for the measurement of benzodi-azepines in biological samples. J. Chromatogr. B 713: 201–12 (1998).
38. A. De Villiers, F. Lestremau, R. Szucs, S. Gelebart, F. David, and P. Sandra. Evaluation of ultra-performance liquid chromatog-raphy: Part I. Possibilities and limitations. J. Chromatogr. A 1127: 60–9 (2006).
39. F. David, G. Vanhoenacker, B. Tienpont, I. Francois, and P. Sandra. Coupling columns and multidimensional configurations to increase peak capacity in liquid chromatography. LC-GC Eur.
20: 154–62 (2007).
40. D. Cabooter, A. De Villiers, D. Clicq, R. Szucs, P. Sandra, and G. Desmet. Method to predict and compare the influence of the particle size on the isocratic peak capacity of high-performance liquid chromatography columns. J. Chromatogr. A 1147: 183–91 (2007).
41. G. Desmet, D. Cabooter, P. Gzil, H. Verelst, D. Mangelings, Y. Vander Heyden, and D. Clicq. Future of high-pressure liquid chromatography: Do we need porosity or do we need pressure?
J. Chromatogr. A 1130: 158–66 (2006).
42. G. Desmet, P. Gzil, D. Nguyen, D. Guillarme, S. Rudaz, J.L. Veuthey, N. Vervoort, G. Torok, D. Cabooter, and D. Clicq. Including practical constraints in the kinetic plot representation of chromatographic performance data: theory and application to experimental data. Anal. Chem. 78: 2150–62 (2006).
43. S. Heinisch and J.L. Rocca. Optimization of a multisolvent com-position in RPHPLC: generalization to non-ideal peaks.
Chro-matographia 41: 544–52 (1995).
Manuscript received September 11, 2007; revision received October 12, 2007.