HAL Id: insu-02321883
https://hal-insu.archives-ouvertes.fr/insu-02321883
Submitted on 1 Jul 2020HAL is a multi-disciplinary open access archive for the deposit and dissemination of sci-entific research documents, whether they are pub-lished or not. The documents may come from teaching and research institutions in France or abroad, or from public or private research centers.
L’archive ouverte pluridisciplinaire HAL, est destinée au dépôt et à la diffusion de documents scientifiques de niveau recherche, publiés ou non, émanant des établissements d’enseignement et de recherche français ou étrangers, des laboratoires publics ou privés.
A new crustal fault formed the modern Corinth Rift
David Fernández-Blanco, Gino de Gelder, Robin Lacassin, Rolando Armijo
To cite this version:
David Fernández-Blanco, Gino de Gelder, Robin Lacassin, Rolando Armijo. A new crustal fault formed the modern Corinth Rift. Earth-Science Reviews, Elsevier, 2019, pp.102919. �10.1016/j.earscirev.2019.102919�. �insu-02321883�
PREPRINT PEER-REVIEWED & ACCEPTED FOR PUBLICATION
This manuscript is a preprint uploaded to EarthArXiv. It has been formally accepted for publication to EARTH-SCIENCE REVIEWS on the 06/08/2019. A type-setted version of the manuscript is available via the “Peer-Reviewed Publication DOI” link to the right. Authors welcome comments, feedback and discussions anytime.
[Earth ArXiv postprint – Published in Earth Science Reviews]
1
A new crustal fault formed the modern Corinth Rift
David Fernández-Blanco, Gino de Gelder, Robin Lacassin and Rolando ArmijoUniversité de Paris, Institut de physique du globe de Paris, CNRS, F-75005 Paris, France
Abstract 1 Introduction
2 Geologic background: Corinth Rift & proposed models 2.1 Corinth Rift mechanical models
2.1.1 High-angle faults: Evidence and models 2.1.2 Low-angle faults: Evidence and models 2.2 Evolutionary models for the Corinth Rift
2.2.1 Evolutionary models of continuous rift development 2.2.2 Evolutionary models of disruptive rift development 2.3 Implications
3 The modern Corinth Rift 3.1 Active normal faults
3.2 Uplifted Quaternary marine terraces
3.3 Modern and (perched) Plio-Pleistocene Gilbert Deltas 3.4 Plio-Pleistocene (uplifted) basin extent
3.5 Hanging wall synrift deposits 3.6 Topobathymetry
3.6.1 Across the rift axis 3.6.2 Along the rift axis
3.7 Footwall river long profiles and tectonic knickpoints 4 Theoretical background: Footwall record of normal fault growth
4.1 Footwall elements used as proxies for normal fault growth 4.2 Approach to reconstruct normal fault growth in time 5 Analysis of fault growth and relief response
5.1 Border fault growth in the west rift 5.2 Border fault growth in the rift margin 5.3 Vertical motions in time
6 Discussion on rift models and implications
6.1 Mechanical model of the modern Corinth Rift 6.2 Evolutionary model of the Corinth Rift
6.2.1 Antecedent distributed extension 6.2.2 Change in extension mechanics 6.2.3 The advent of the modern Corinth Rift 6.2.4 The modern Corinth Rift at present 6.3 Tectonic implications
7 Conclusions Acknowledgements References
[Earth ArXiv postprint – Published in Earth Science Reviews]
2
A new crustal fault formed the modern Corinth Rift
David Fernández-Blanco, Gino de Gelder, Robin Lacassin and Rolando ArmijoUniversité de Paris, Institut de physique du globe de Paris, CNRS, F-75005 Paris, France
Abstract
This review shows how collective analysis of morphotectonic elements on uplifting rift margins can constrain the mechanical behaviour of continents during early rifting. This is shown for the modern Corinth Rift, one of the fastest-extending and most seismically active continental regions worldwide. We reconstruct the growth of the normal fault system that accommodates most of the rift strain and the uplift of the rift margin it bounds, from onset to present and at rift scale. Our approach allows first-order inferences on the mechanics and evolution of the rift, and can be used in other areas of early continental rifting.
We review and re-assess known geologic evidence in the Corinth Rift, and compile morphotectonic elements into a new map. We analyse the rift topo-bathymetry, and the footwall relief, river catchments and tectonic knickpoints in its uplifting margin. We also review studies that constrain the growth of normal faults using morphotectonic elements in their footwall, and propose a novel theoretical framework to reconstruct fault time-evolution during early rifting. We couple known and new data to derive fault displacement profiles in time, and use the theoretical framework to infer the history of growth and linkage of rift border faults, in turn constraining rift growth mechanics and evolution.
Our rift-scale morphotectonic investigation shows that the current rift-bounding faults are kinematically coherent at depth and constitute a fault >80 km in length. This composite master fault grew along-strike from the rift centre, linking and integrating individual fault segments that developed co-linearly at earlier times. The observed fault elastic flexure, footwall relief wavelength and high uplift and slip rates
throughout the rift margin suggest the border fault is steep and highly localized in strain, and transects the entire seismogenic layer growing in a long-term strong elastic lithosphere.
Integration of previous and our new findings suggest the Corinth Rift evolved in two distinct extensional phases. These extensional phases are delimited by the fast, overwriting growth of the new rift-forming fault, that switched rift mechanics in a ~300 kyr timespan, and controls rift evolution thereafter. The new rift-forming fault enlarges the modern rift as an asymmetric half-graben, along and across strike,
superimposed onto the preceding ~4 My distributed extension.
[Earth ArXiv postprint – Published in Earth Science Reviews]
3
1 Introduction
The kinematics, spatial distribution and geometry of normal faults control the mechanics and evolution of intracontinental rifts, as defined by the strength of the continental lithosphere. In continents, the thickness and rheological strength of lithospheric layers set the dip and geometry of normal faults (Buck, 1991, 1993; Brun, 1999; Gueydan et al., 2008), and the seismogenic thickness and effective elastic thickness of the crust regulate the maximum fault slip and along-axis segmentation of the resulting asymmetric grabens (Scholz and Contreras, 1998). Concurrently, the kinematics, spatial distribution, and geometry at depth of normal faults, expressed as footwall uplift and uplift rate, control the maximum elevation and morphology of mountain fronts (Wallace, 1978; Armijo et al., 1986, 1991), as well as the presence, geometry and wavelength of footwall up-warping (King and Ellis, 1990; Resor and Pollard, 2012; De Gelder et al., 2019). Normal border faults also control footwall relief, fluvial catchment drainage area and spacing (Densmore et al., 2004, 2005; Cowie et al., 2006), and the distribution and height of river long-profile convexities (e.g., Boulton and Whittaker, 2009; Kent et al., 2016; Gallen and Wegmann, 2017). It follows that morphotectonic elements in extensional footwalls record the growth of border faults and have the potential to characterise rift mechanics and evolution, and thus to provide insights into continental lithospheric
behaviour to a first order.
Intracontinental rift mechanics can be generally abridged as two end-members (Fig. 1). High-angle faults commonly accommodate extensional strain at early stages of continental rifting (Bell et al., 2017), in an overall-strong lithosphere with the largest rheological strength in the lower crust or upper lithospheric mantle (Fig. 1A) (De Gelder et al., 2019). Contrarily, low-angle faults commonly tend to occur at late stages of rifting due to rotation by continued stretching (e.g., Jackson and McKenzie, 1983; Buck, 1993) in an overall-weak lithosphere with maximum strength in the upper crust (Fig. 1B) (Brun, 1999; Burov and Watts, 2006; Gueydan et al., 2008). Exceptionally, low-angle faults can occur during early rifting by magmatism or
presence of favouring inherited structures (Bell et al., 2017 and references therein). Both faulting mechanisms have been proposed to accommodate rifting in tensionally-stressed, continental regions like the Basin and Range (e.g., Allmendinger et al., 1983; Stein and Barrientos, 1985), East African Rift (e.g., Ebinger, 1989; Morley, 1989), Baikal Rift (e.g., Mats, 1993; van der Beek, 1997), Central Apennines (e.g., Ghisetti and Vezzani, 1999; Boncio and Lavecchia, 2000) and the Corinth Rift (e.g., Armijo et al., 1996; Sorel, 2000).
[Earth ArXiv postprint – Published in Earth Science Reviews]
4
Fig. 1 End-member models for intracontinental rifts and representative strength profiles. In the upper section is the
flexural-cantilever rift model (Kusznir et al., 1991), and in the lower section is the core complex-detachment rift model (Buck, 1991). Their representative strength profiles are shown to the right of each model.
The asymmetric continental rift of Corinth is young and amagmatic, and studies have reported both high- and low-angle faults transecting nearly orthogonally the pre-existing structural grain of the thickened Hellenic orogenic wedge (e.g., Armijo et al., 1996; Flott. and Sorel, 2001). The rift is one of the fastest extending regions accessible on land worldwide and one of the most seismically active (e.g., Dan McKenzie, 1978; Collier and Dart, 1991;
Papazachos et al., 1992; Armijo et al., 1996; Avallone et al., 2004; Bernard et al., 2006; Leeder et al., 2008; Jolivet et al., 2010; Charalampakis et al., 2014). Therefore, the Corinth Rift is an outstanding natural laboratory for intracontinental rifting and a key site to gain an enhanced understanding of normal fault mechanics and continental tectonics.
Models of mechanics and evolution in the Corinth Rift are diverse, despite an
impressive volume of research that spans from the fifth century BC philosophical arguments on mythological attributions given to karstic features in the mountains south of the Corinth Gulf (Herodotus “History”; e.g., Clendenon, 2009) to present-day results of the IODP Expedition 381
[Earth ArXiv postprint – Published in Earth Science Reviews]
5
in the gulf itself (McNeill et al., 2019). Models lack a coherent view on growth history, kinematics and mechanics of the latest, currently active, rift border fault system and its significance for the Corinth Rift and for generic rift growth processes. Reconstructing the growth of these rift-bounding faults is possible by assessing, collectively and at rift scale, well-preserved geomorphic strain markers that record rift margin uplift.
Here we constrain the modern Corinth Rift mechanics and evolution, analysing at rift-scale the growth of active, collinear faults that bound the rift southern margin. First, we review previous geologic knowledge, and reassess, (re)map and integrate geologic and
morphotectonic data into a new map. Second, we analyse relief along and across the rift axis to characterize rift morphology and study its relation with rift geology. We then review
approaches that use the geomorphology of extensional footwalls to constrain normal fault mechanics, and put forward a theoretical framework to reconstruct normal fault growth history during early rifting of continents. Finally, we correlate time-strain markers and tectonic
knickpoints at rift margin scale. With all the above, we derive the kinematic evolution and along-strike sequence of growth of modern border faults in the rift, as well as rates, wavelength and amplitude of fault uplift. Data and interpretation are coherent with the growth of a new, high-angle, rift-scale border fault that controls and progressively develops the modern Corinth Rift atop antecedent extension.
2 Geologic background: Corinth Rift & proposed models
Progressive rollback of the downgoing African slab and concomitant southward migration of the Hellenic trench since ~30–45 Ma lead to widespread extension in NW Greece, in the Cyclades and W Turkey (e.g., Le Pichon and Angelier, 1981; Reilinger et al., 2009; Brun and Sokoutis, 2010; Jolivet and Brun, 2010; Jolivet et al., 2013; Brun et al., 2016). In N Greece, however, this extension is overwritten by younger, steep normal faults that are active at present and formed in relation to the westward propagation of the North Anatolian Fault (NAF) into the North Aegean Trough (NAT) (e.g., Armijo et al., 1999; Koukouvelas and Aydin, 2002). The age of stress change from older to younger faulting is unclear but can be broadly
bracketed between 430 ka in the southwestmost NAT (Saporades Basin; Ferentinos et al., 2018) and ~4 Ma at the NAT front (Olympos-Ossa-Pelion Range; Lacassin et al., 2007). The Corinth Rift is located to the NE of the Hellenic subduction trench, to the NW of a south-arched bathymetric trough formed by a detachment of the Aegean Sea, and to the SW of the
[Earth ArXiv postprint – Published in Earth Science Reviews]
6
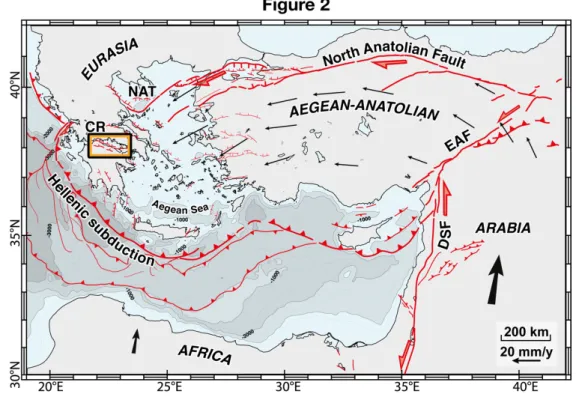
southmost NW-SE-trending extensional trough of the NAF (Fig. 2). The rift, with an overall strike of N105°E, transects almost orthogonally the thickened continental crust of the Eocene-to-Miocene Hellenides nappes (e.g., Jacobshagen et al., 1978; Bonneau, 1984; Jolivet et al., 2010).
Fig. 2 Active tectonic faults and GPS velocities of the W Turkey-Greece region. The map shows the main tectonic
units, plate boundaries and active faults in the region, and the location of the Corinth Rift (CR). The bathymetry is modified from Huguen et al. (2004). The GPS vectors, with a fixed Eurasian Plate, are simplified from Le Pichon and
Kreemer (2010). The map of active faults comes from Armijo et al. (1999) and Flerit et al. (2004) for the Aegean and North Anatolian areas, and Kreemer & Chamot-Rooke (2004) for the Mediterranean Ridge area. Line thickness and
arrow size represent amount of slip to a first-order. NAF and EAF are the North and East Anatolian faults. Normal faults with overall north dips control the south coast of the Gulf of Corinth and govern present-day extension in the Corinth Rift (e.g., Doutsos and Piper, 1990). Rift border faults arranged in en-chelon segments ~10–25 km-long have a ~130 km cumulative length and along-rift strikes that vary from NSW to ENWSW in the easternmost rift to WNW-ESE to E-W in the central and west rift (Fig. 3). These active normal faults cut not only the Hellenic nappes at a high angle, but also a former set of normal faults with WNW-ESE trends that bounded (now exposed) Plio-Pleistocene basins (e.g., Collier et al., 1992; Armijo et al., 1996). These relationships are readable in the rift eastern end, where ESE-striking extensional faults bounding former depocenters are cross-cut by the younger fault system (e.g., Leeder et al.,
[Earth ArXiv postprint – Published in Earth Science Reviews]
7
1991; Gawthorpe et al., 1994). Similar observations are not clear in the central and west rift, where both antecedent and presently active fault systems are sub-parallel to each other.
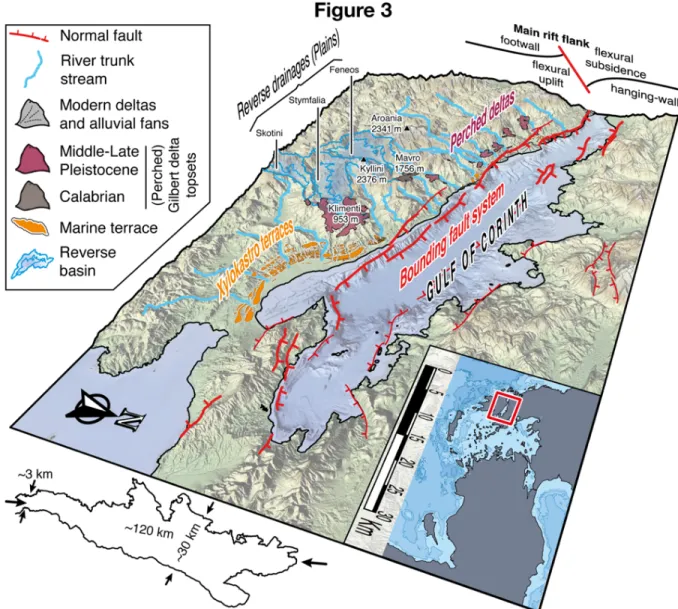
Fig. 3 3D view of the Corinth Rift with representation of the main morphotectonic elements of the southern margin.
Whereas active north-dipping rift-bounding faults set a markedly asymmetric half-graben in the rift center (e.g., Armijo et al., 1996; De Gelder et al., 2019), conjugate faults dipping south set more symmetric rift sectors at rift ends (e.g., Sakellariou et al., 1998, 2007; McNeill et al., 2005; Bell et al., 2011) (Fig. 3). The rift basin is broader and has its maximum basement subsidence at its centre where the whole-crust extension is greater (e.g., Bell et al., 2011), and the highest summits bound reversed, endorheic drainages (Fig. 3). Westwards along the rift axis, the wide, asymmetric half-graben changes into a symmetrical and narrow
[Earth ArXiv postprint – Published in Earth Science Reviews]
8
graben, as the gulf width changes from ~30 km to ~3 km and its seafloor depth decreases from ~850 m to ~200 m (Fig. 3). By contrast, modern deltaic systems are significantly more developed in the west than in the rift centre (e.g., Seger and Alexander, 2009). Similarly, the extent of now-exposed marine Plio-Pleistocene rocks reduces westward (e.g., Ori, 1989), whereas syn-tectonic sedimentary wedges of the rift-bounding fault decrease in thickness (e.g., Nixon et al., 2016). In the same direction, overall fault orientations change from N105°E to N090°E and mean topography reduces by ~400 m. Rift morphology towards the east is more complex, for rift border faults change their orientation to N045°E-N055°E and the orientation of other faults is more variable (Fig. 3). Both east and west rift ends are highly active seismically (Jackson et al., 1982; Ambraseys and Jackson, 1990; Hubert et al., 1996; Bernard et al., 2006; Godano et al., 2014; Duverger et al., 2015).
2.1 Corinth Rift mechanical models
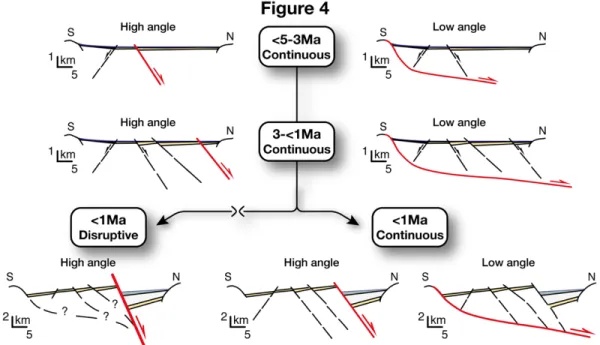
We discriminate proposed mechanical and evolutionary models for the Corinth Rift by two key characteristics: mechanics at depth and evolutionary continuity (Fig. 4). Despite the
specificities of each model, we define mechanical models by proposed fault geometry at depth, and evolutionary models by proposed continuity between early distributed extension and the youngest, fastest rifting phase of highly localised strain.
Fig. 4. Types of models proposed for the Corinth Rift in time, when classified by two key characteristics: mechanics
[Earth ArXiv postprint – Published in Earth Science Reviews]
9 2.1.1 High-angle faults: Evidence and models
High-angle planar faults predominate in the Corinth Rift (e.g., Jackson et al., 1982; Armijo et al., 1996). At present, extension is largely accommodated by faults that have dips of 40°-60° north and rupture the surface seismically during the Holocene, especially along the gulf southern coast (e.g., Hubert, 1996; Rigo et al., 1996; Stewart and Vita‐Finzi, 1996). Whereas these active border faults lead to the rift marked asymmetry (Armijo et al., 1996), mostly-inactive faults located southwards also dip ~40°-60° north at the surface and delimit narrow tilted blocks with little footwall relief (Rohais et al., 2007; Bell et al., 2008; Ford et al., 2012). Individual faults imaged by offshore seismic studies are planar and remain steep at least until ~3 km depth (e.g., Taylor et al., 2011; Nixon et al., 2016) (Fig. 4).
In the east rift, border faults accommodate elastic flexure of lithosphere (elastic-plastic flexure sensu stricto, given inelastic strain above the brittle-ductile transition and plastic strain below it). Onshore-offshore strain markers accurately record elastic flexure at
glacial-interglacial intervals (~120 ky; De Gelder et al., 2019) (Fig. 5A). Elastic flexure derived from these markers delineate an uplift/subsidence ratio of 1:1.2-2.4 along the SE rift margin (De Gelder et al., 2019) that agrees well with ratios of 1:1.2-2.2 estimated along the SW rift margin with geological features (McNeill et al., 2005). Coupled flexural footwall uplift south of the border faults (rates up to ~1.7±0.1 mm×yr-1 near the Xylokastro Fault) (Armijo et al., 1996; De
Gelder et al., 2019) and flexural hanging-wall subsidence to their north (rates of ~3.6 mm×yr-1 in
the gulf center) (Moretti et al., 2004) mark the ~4.8 km high-amplitude structural relief that exists in the rift centre-east in relation with the latest phase of faulting (Armijo et al., 1996; De Gelder et al., 2019) (Fig. 5A). This modern relief is in stark contrast with the antecedent “proto-gulf” low-amplitude relief inferred from stratigraphic data (e.g., Ori, 1989). The wavelength of elastic flexure in the east rift implies a high-angle (40°-60°) planar fault reaching the base of the seismogenic layer (Armijo et al., 1996; Bell et al., 2017; De Gelder et al., 2019).
Mechanical models derived from the data above propose the rift is controlled by elastic flexure along the border fault system since their onset (e.g., Armijo et al., 1996), probably by the Middle Pleistocene (Ford et al., 2016). The model is supported by the geometry of marine terraces, river catchments and topography (Armijo et al., 1996; De Gelder et al., 2019;
Fernández-Blanco et al., 2019b) (Fig 5A), and the distribution of large earthquakes in the east and west rift with focal mechanisms that indicate normal faulting at 40°-60° angles (e.g., Jackson et al., 1982; King et al., 1985; Lyon-Caen et al., 2004). High-angle faulting is similarly supported by the correlation between observations of basement subsidence and crustal
[Earth ArXiv postprint – Published in Earth Science Reviews]
10
thinning, and rift total extension, calculated by computing fault heaves under the assumption of planar faulting (McNeill et al., 2005; Bell et al., 2011; Ford et al., 2012). Moreover, finite-element models reproduce the vertical displacements and subsidence-uplift ratios observed in nature in simulations with high-angle planar faults reaching the brittle-ductile transition, but not in those with low-angle faults (Bell et al., 2017). Different seismic imaging methods show a minimum in regional Moho depths <30 km below the east and central gulf and elongated along axis (Zelt et al., 2005; Sachpazi et al., 2007; Pearce, 2015) that is coherent with the single, high-angle fault model (Fig. 5A).
2.1.2 Low-angle faults: Evidence and models
At the southern end of the rift margin, field observations led to the proposal of a low-angle fault (0° to 30°) dipping north at shallow depths (0-2km) (e.g., Sorel, 2000; Flotté and Sorel, 2001; Flotté et al., 2005) (Fig. 5B). These studies suggest that high-angle normal faults root into such low-angle detachment, interpreted to deepen northward from the surface to 2-3 km depth at the gulf southern coast, and proposed to be active from Pleistocene to Present. More recent research by Jolivet et al. (2010) considers the outcropping detachment as one of three
decollements active before formation of border faults in the gulf southern coast (Fig. 5B). These studies extend the low-angle structure farther north into a microseismicity cloud imaged in the west rift (see below). Between the two sites, a low-angle basement fault compatible with the detachment has been interpreted in reflection seismics (Sachpazi et al., 2003; Taylor et al., 2011), although the structure is not mapped by other studies (Bell et al., 2008, 2009), even if using the same seismic lines (Nixon et al., 2016).
In the west rift, high-angle border faults seem to reach a ~2.5-km-thick microseismicity cloud that increases in depth from ~6 km with a gentle northward dip (10°-20°) (Rietbrock et al., 1996; Rigo et al., 1996; Lyon-Caen et al., 2004; Bernard et al., 2006; Gautier et al., 2006) (Fig. 5B). Whereas short-term microseismicity swarms in the upper ~2 km of the cloud may be controlled by pore-pressures in a highly-fractured, fluid-saturated geologic layer, long-term microseismicity in regular multiples located to its base may be explained by aseismic slip (Gautier et al., 2006; Duverger et al., 2015).
[Earth ArXiv postprint – Published in Earth Science Reviews]
11
Fig. 5. Cross sections across the (A) centre-east and (B) west sectors of the Corinth Rift. Sections are modified from
De Gelder et al. (2019) and Jolivet et al. (2010) respectively, and scaled for direct comparison. The top 3-4km below the surface is exaggerated 3 times, and show the main elements as highlighted by the original studies. Notice the
different set of elements and constraints used to reproduce each section. The bottom of the sections show the interpreted geometry of normal faults at the brittle-ductile transition at 1:1 scale. Fault geometry for (A) is proposed,
and for (B) is shown as nodal planes of extensional focal mechanisms of large earthquakes that are parallel to the interpreted low-angle structure (as plotted in Jolivet el al., 2010). Panels at the bottom left of each section are crustal
transects at 1:1 scale that extent the sections northward (~25 km). We use geophysical studies with maps of the Moho depth (Tiberi et al., 2001; Zelt et al., 2005; Sachpazi et al., 2007; Pearce, 2015) to derive Moho depth below each section, and plot seismicity along a 10 km-wide swath that is centered in the section. Seismicity data comes from the (A) 1996-2008 University of Athens and the (B) 2000-2017 Corinth Rift Laboratory seismic catalogues.
[Earth ArXiv postprint – Published in Earth Science Reviews]
12
Mechanical models derived from the data above propose the rift is controlled by the low-angle north-dipping structure and that high angle faults root and are mechanically linked to it (Fig. 5B). The structure is interpreted as a detachment, either related to the brittle-ductile transition (Hatzfeld et al., 2000) or to shear (e.g., Rigo et al., 1996; Sorel, 2000; Bernard et al., 2006), occurring along either an inherited crustal-scale detachment (Jolivet et al., 2010) or a local incipient detachment (Lambotte et al., 2014). Most of these studies consider that the structure transitions into the ductile middle crust, since seismicity is reduced below the microseismicity cluster (e.g., Duverger et al., 2015). Contrarily, active structures 1-2 km in length imaged at that depth are suggested to relate to significant strain (Lambotte et al., 2014). The low-angle fault models are supported by extensional focal mechanisms of large
earthquakes in the west rift with one nodal plane parallel to the low-angle structure (e.g., Bernard et al., 1997) (Fig. 5B) and the weakening and fluid circulation usually associated with shallow-dipping detachments (e.g., Morrison and Anderson, 1998). A gravity inversion study, showing a shallower Moho north of the gulf (Tiberi et al., 2001), is also compatible with low angle fault models (Fig. 5B).
2.2 Evolutionary models for the Corinth Rift
Early distributed extension (e.g., Seger and Alexander, 2009; Gawthorpe et al., 2017b) and basinward fault migration (e.g., Gawthorpe et al., 1994; Goldsworthy and Jackson, 2001) occurred before the marked present-day strain localization that characterizes the modern Corinth Rift (e.g., Armijo et al., 1996; Hubert et al., 1996). Present-day extension rates in the rift are among the largest geodetic rates measured on any continental site (cf., Briole et al., 2000; Tetreault and Buiter, 2018), with GPS velocities increasing westward from ~11 mm×yr-1 in the
Xylokastro area to ~16 mm×yr-1 in Aigion (e.g., Avallone et al., 2004). However, modern
extension rates have increased by up to more than one order of magnitude since extension started (e.g., Ford et al., 2012) and geodetic data is at variance with finite strain and long-term average extension rates (e.g., Bell et al., 2011). These discrepancies, together with
uncertainties over the age, (un)disruptive nature and overall tectonic relevance of the modern rift-bounding fault(s) leads to different rift evolutionary models (Fig. 4).
2.2.1 Evolutionary models of continuous rift development
The onset of distributed extension is poorly constrained to 3.6-5 Ma with radiometric dating of syn-extension volcanics in the east rift (Collier, 1990; Collier and Dart, 1991; Leeder et al.,
[Earth ArXiv postprint – Published in Earth Science Reviews]
13
2008), and led to protected-setting continental and shallow water deposits (e.g., Gawthorpe et al., 2017a). In the southern flank of the modern rift, these deposits were uplifted in extensional footwalls that are sequentially younger northward, thereby recording basinward migration of normal faults and block tilting (e.g., Gawthorpe et al., 1994; Goldsworthy and Jackson, 2001; Ford et al., 2012).
Continuous rift models (Fig. 4) suggest self-organization of normal faults and
progressive strain localization since the onset of distributed extension in a 20–30 km-wide area south of the present rift (e.g., Jolivet et al., 2010; Ford et al., 2016; Nixon et al., 2016;
Gawthorpe et al., 2017b). In these models, increased rate and strain localization in the border fault system results from sequential rift development (e.g., Nixon et al., 2016). Continuous rift models frame the last faulting event within an undisrupted sequence of fault migration and block tilting in two-to-four continuous rift phases, i.e. the “Great Breaching” event at 0.6 Ma, within R2 phase starting at 2.2 to 1.8 Ma (Gawthorpe et al., 2017b); Phase 3 onset at 0.7±0.2 Ma (Ford et al., 2016); or Syn-rift 2 at 0.8 Ma (Rohais and Moretti, 2017). In these models, the rift evolves in response to retreat of the Hellenic slab and crustal collapse as an early form of a core complex similar to those in the Cyclades (Jolivet et al., 2010). For these models, the last faulting event is not necessarily indicative of a relevant kinematic change in response to large-scale tectonic boundary conditions (Jolivet, 2001).
2.2.2 Evolutionary models of disruptive, non-continuous rift development
Early distributed strain with low extensional rates (0.6–1 mm×yr-1) (Ford et al., 2012) preceded
the development of the modern, strain-localised border fault (Armijo et al., 1996). The onset of activity on the border fault is still disputed. Estimations based on lateral
chrono-/bio-stratigraphic correlations of syn-extensional deposits in the uplifted margin give an upper boundary age of 2.2–1.8 Ma for fault initiation (Gawthorpe et al., 2017b). An age of ~1 Ma is derived from linear extrapolation of Late Pleistocene marine terraces (Armijo et al., 1996; De Gelder et al., 2019) and datation of calcite cements (Causse et al., 2004). Depositional ages (Rohais et al., 2007a, b; Ford et al., 2009, 2016) and U-Th dating of tufa (Brasier et al., 2011) in perched conglomeratic deltas onshore, and depocenter coalescence in the offshore (Nixon et al., 2016) give a lower boundary of ∼0.7–0.6 Ma. Given the uncertainty involved in assigning chronostratigraphic significance to systems tracts when marked spatial variations in vertical motions exits (Gawthorpe et al., 2017a), we here consider an age between ~1 Ma and ~0.6 Ma for the onset of fault activity. Border fault growth marked a dramatic increase in subsidence
[Earth ArXiv postprint – Published in Earth Science Reviews]
14
and a first-order switch in rift tectonostratigraphy, with a sharp sedimentation contrast both onland and in the offshore, and to a rift-scale angular unconformity (e.g., Ori, 1989; Sachpazi et al., 2003).
Disruptive, non-continuous rift models (Fig. 4) suggest a strongly-localized strain since border fault onset (De Gelder et al., 2019), and discriminate an early proto-Gulf from a modern Corinth Rift (Ori, 1989). Increased rates and strain localization results from disruptive growth of a new high-angle, rift-forming fault driving the elastic flexure along the rift margin (Ori, 1989; Armijo et al., 1996). Disruptive rift models frame the last faulting event as discontinuing
comparatively minor antecedent extension, and controlling the rift geometry and most defining features thereafter (e.g., Armijo et al., 1996). In these models, the modern rift evolves in
response to propagation of the NAF and lithospheric flexure, accommodating extension at the fault tip, much like those extensional throughs to the NE (Armijo et al., 1996, 1999). This evolution implies a marked kinematic change that disrupts previous extension in response to the process zone of the lithospheric-scale transform fault (Hubert-Ferrari et al., 2003; Flerit et al., 2004).
2.3 Implications
Different models imply different behaviour of the continental lithosphere below the rift (Fig. 1 & 5). Continuous low-angle detachment models assume combined shear (Barbier et al., 1986) in the rift, transiting eastwards to simple shear rifting (Wernicke, 1981) in the central Aegean. Continuous high-angle fault models infer pure shear rifting (McKenzie, 1978a) south of the present rift evolving to a flexural cantilever model (Kusznir et al., 1991) in its rift-bounding fault. Disruptive models infer a flexural cantilever rift that overwrites prior extension (whether pure or simple shear) at younger times, implying a temporal modern rift that is sustained by protracted seismicity (King et al., 1988).
3 The modern Corinth Rift
We compiled, reassessed and (re)mapped active tectonic, tectonomorphic and geologic
information from 30+ suitable papers, compilation papers, and published maps into a new map at the scale of the rift (Fig. 6). We provide in the supplementary material a detailed account on the data used (Suppl. material A), a comparison with the map of offshore faults by Nixon et al. (2016) (Suppl. material B), as well as shapefiles and KML files (topobathymetric DEM, 5-level
[Earth ArXiv postprint – Published in Earth Science Reviews]
15
hierarchy active faults, marine terraces, Gilbert-delta topsets, and river streams and catchments) (Suppl. material G to K).
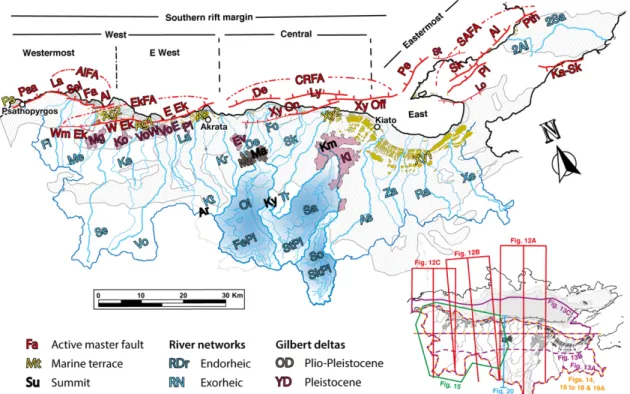
We differentiate two rift sectors that correlate with the strike of the rift border fault system (Fig. 7). Whereas faults trend NE-SW to ENE-WSW in the “easternmost rift” (Perachora peninsula and offshore north of it), faults trend WNW-ESE to E-W in the “rift southern margin” (W of the Perachora peninsula). We further identify three footwall sectors in the rift southern margin, where we perform our analyses, using position and distance of the coast and main morphological elements from the active fault system; “east” (east of Kiato), “central” (from Kiato to Akrata) and “west” (from Akrata to Psathopyrgos) (Fig. 7). For the latter, we
differentiated as needed between “E west” sector, related to the Eliki Fault Array (Eliki FA) and “westermost” sector, related to faults farther west. Hereon, we distinguish individual faults (F) from fault arrays (FA).
3.1 Active normal faults
Geomorphic markers uplifting in the footwall of individual border faults have been extensively studied, often to derive fault uplift and/or slip rates (e.g., Collier et al., 1992; Armijo et al., 1996; Stewart, 1996; Stewart and Vita‐Finzi, 1996; Koukouvelas et al., 2001; Stefatos et al., 2002; Houghton et al., 2003; Leeder et al., 2003; McNeill and Collier, 2004; Pantosti et al., 2004; Pavlides et al., 2004; Verrios et al., 2004; Palyvos et al., 2005, 2007, 2008; Turner et al., 2010; Karymbalis et al., 2016b; De Gelder et al., 2019). Details on fault activity, slip and uplift rates derived by these studies were compiled by other studies (see Table 1 & 2 in Bell et al., 2009 and e.g., Collier et al., 1992; Armijo et al., 1996; Stewart, 1996; Stewart and Vita‐Finzi, 1996; Koukouvelas et al., 2001; Stefatos et al., 2002; Houghton et al., 2003; Leeder et al., 2003; McNeill and Collier, 2004; Pantosti et al., 2004; Pavlides et al., 2004; Verrios et al., 2004; Palyvos et al., 2005, 2007, 2008; Turner et al., 2010; Karymbalis et al., 2016b; De Gelder et al., 2019), and the overarching findings follow.
Uplift and slip rate are maximum in the rift centre (CRFA, Fig. 7 & 8), minimum in the east rift and intermediate yet high in the west rift (AiFA, EkFA, Fig. 7 & 8). Upward elastic flexure along the rift margin led to uplift rates that range from up to 1.5-2 mm×yr-1 to ~0.2-0.3
mm×yr-1 (e.g., Collier et al., 1992; Armijo et al., 1996; Stewart and Vita‐Finzi, 1996; Leeder et
al., 2003; McNeill and Collier, 2004; Pavlides et al., 2004; Turner et al., 2010; Karymbalis et al., 2016b; De Gelder et al., 2019). Except in the east rift, these values markedly overpass a
[Earth ArXiv postprint – Published in Earth Science Reviews]
16
regional uplift signal, estimated between 0 and 0.3 mm×yr-1 (e.g., Armijo et al., 1996; Turner et
al., 2010). Fault slip rates inferred are also consistently high along the entire rift margin, with minima ranging from 4 mm×yr-1 (McNeill and Collier, 2004) to 7 mm×yr-1 (Armijo et al., 1996).
[Earth ArXiv postprint – Published in Earth Science Reviews]
17
Fig. 6 (prev. page). Tectonomorphologic and active tectonics map of the Gulf of Corinth. Based on a compilation,
reassessment and remapping from 30+ contributions, and own mapping (see Suppl. material A). Inlet shows the different DEMs used for the topobathymetry.
Fig. 7. Index map, showing the main elements of the Corinth Rift considered in this review. The lower right inset
shows the extent of the DEM for across-axis (red) and along-axis (purple) stacked swath profiles and their projection lines, as well as the location of other figures of the western rift (green), the full rift (orange), and cross sections (in blue). Abbreviation of the main elements, from east to west. Main active faults: Psatha (Pth); Kakia-Skala (Ka-Sk); Alepochori (Al) and Skinos (Sk); Strava (St); Pisia (Pi); Perachora (Pe); Loutraki (Lo); Central Rift Fault Array (CRFA) [composed of Xylokastro Onshore (Xy On), Xylokastro Offshore (Xy Off), Lykoporia (Ly) and Derveni (De)]; Eliki Fault Array (EkFA) [with the East Eliki (E Ek) and West Eliki (W Ek)]; and the Aigio Fault Array (AiFA) [inclusive of Aigio (Ai), Fasouleika (Fa), Selianitika (Sel), Lambiri (La) and Psathopyrgos (Psa)]. Marine terraces location: Xylokastro (Xy1 &
Xy2), Akrata (Ak), Aigio (Ag1 & Ag2), and Psathopyrgos (Ps). Pleistocene perched Gilbert deltas: Klimenti (Kl), Evrostini (Ev), Platanos (Pl), Vouraikos East (VoE) and West (VoW), Kolokotronis (Ko) and Meganitis (Mg). Late Pliocene (perched) Gilbert delta: Mavro (Mv). Main drainage systems: Xerias (Xe), Raizanis (Ra), Zapantis (Za), Asopos
(As), Trikalitikos (Tr), Fonissa (Fo), Skoupeiko (Sk), Dervenios (De), Krios (Kr), Krathis (Kt), Ladopotamos (La), Vouraikos (Vo), Kerinitis (Ke), Selinous (Se), Meganitis (Me) and Finikas (Ph). Internally drained basins and their plains:
Soutini (So) and Skotini Plain (SkPl); Safenetos (Sa) and the Stymfalia Plain (StPl); and Olvios (Ol) and the Feneos plain (FePl). Main summits: Klimenti (Km) and Mavro (Ma) at the front and Kyllini (Ky) and Aroania (Ar) at the back.
Fig. 8 (next page). Map of Corinth Rift active faults with displaced relief. (A) Corinth Rift topobathymetry
and the map of active faults. The topobathymetry is derived from a merged DEM, and the active faults map comes from own mapping and reassessment of fault maps from other contributions (see Suppl. material A). (B) Highlight of
the three highest levels of our fault hierarchy. (C) Master fault (acronyms as in Fig. 7). In grey for all panels, a
representation of a hypothetical composite master fault at seismogenic layer basal depths (~10 km) with similar high-angle north dips and planar attitudes than at-surface faults bounding the rift at present.
[Earth ArXiv postprint – Published in Earth Science Reviews]
18
North of the border fault system, parallel faults dipping south and conjugate faults are kinematically linked to the border fault system and passively accommodate its motion (Fig. 8) (e.g., Stefatos et al., 2002). These smaller active faults are either synthetic or antithetic to the border fault and trend roughly parallel to it along most of the rift, or conjugate faults in the rift eastern and western terminus (Figs. 6 & 8). With the exception of faults in the westernmost rift (e.g., Beckers et al., 2015), these south-dipping faults develop smaller syntectonic sedimentary wedges that the border faults (e.g., Nixon et al., 2016). Among these faults, the system with largest offsets locates north of the bathymetric low and is composed of E-W trending faults with south dips. This fault set produces small reliefs and has no associated pattern of onshore uplift and offshore subsidence (e.g., Stefatos et al., 2002). In fact, the irregular northern
[Earth ArXiv postprint – Published in Earth Science Reviews]
19
3.2 Uplifted Quaternary marine terraces
Sequences of uplifted marine terraces correlated to sea level highstands up to ~400 ka outcrop near the coast all along the rift-bounding fault footwall, from Alepochori to Psathopyrgos (Figs. 6, 7 & 9A). The best-developed marine terrace sequence outcrops in a ~6-8 km wide strip trending NW-SE, parallel to the gulf southern coast west of Corinth for ~40 km (Fig. 9A). This wave-cut marine terrace flight, carved into Plio-Pleistocene marls, is correlated to sea level highstands up to ~400 ka. It has large lateral variations NW-wards as distance to the master fault decreases from ~20 km to ~3 km; i.e. the marine terrace sequence increases in the number of levels, from a few-low laying levels in Kechrie to ~14 levels in the Onshore
Xylokastro F footwall, and in elevation by a factor of 3-4, reaching as high as ~400 m (Armijo et al., 1996; De Gelder et al., 2019) (Figs. 6, 7 & 9A). The MIS 5e terrace at ~177 m is the highest of its age for the whole gulf (Fig. 9A).
In the west rift, marine terraces formed by wave erosion far from the outlets of major rivers, and depositional marine terraces developed at these locations over prograding delta fans (e.g., Hemelsdaël and Ford, 2016) (Figs. 6, 7 & 9A). Up to ten levels of relatively well-developed marine terraces with laterally consistent elevations of up to ~350 m lay along the coastline in the footwall of the West and East Eliki and Aigio faults (McNeill and Collier, 2004) (Figs. 6, 7 & 9A). The Eliki F footwall terraces show a relevant marine terrace sequence in Akrata that dims westwards. They outcrop typically within 5 km of the Eliki FA trace and their elevation varies westward from 135 to 150 m for MIS 5e level and from 240 to 255 m for the MIS 7e terrace (McNeill and Collier, 2004; for their preferred ~1.1 mm×yr-1 uplift rate) (Fig. 9A).
Marine terraces lying between the Aigio F footwall and the hanging wall of the western sector of West Eliki F are at 160 m for MIS 5e, and 232 m for MIS 7e. Although a MIS 9 level at 360 m has been dated in the western sector of West Eliki F footwall, it is not confidently correlated laterally (De Martini et al., 2004). At the westernmost rift, seven narrow terrace levels reaching a maximum elevation of ~250 m are carved into the Plio-Pleistocene rocks of the Ps footwall, outcropping within 2 km of Ps trace, at ~90 m elevation (for MIS 5e) and ~160 m (for MIS 7e) (Houghton et al., 2003) (Figs. 6, 7 & 9A).
[Earth ArXiv postprint – Published in Earth Science Reviews]
[Earth ArXiv postprint – Published in Earth Science Reviews]
21
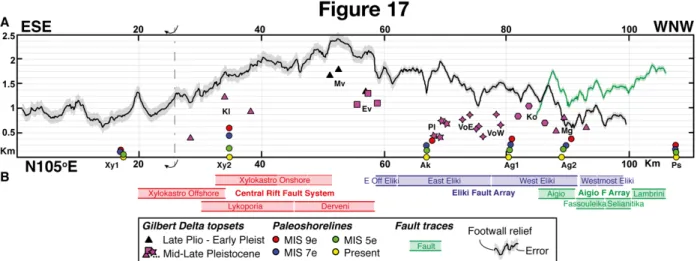
Fig. 9 (prev. page). Variations along the Corinth Rift axis, in map views highlighting different geologic elements. The
main trend of each corresponding feature is shown schematically on top of each map. (A) The presence of known
marine terraces, their estimated ages and elevations at six locations - bold highstands are dated levels, and the asterisks indicate elevations extrapolated in space to match the distance to the master fault of the MIS 5e terrace. (B)
The presence and location of mapped topsets of Gilbert deltas, their age and rough elevations. (C) Extent of the
Plio-Quaternary basin exposed onland. (D) and (E) Isochore maps showing two-ways travel times true vertical thickness
for two seismic units, representing ~1.5-2 Ma to 620 ka, and 620 ka to Present, simplified from Nixon et al. (2016).
3.3 Modern and perched Plio-Pleistocene Gilbert Deltas
Two families of coarse-grained Gilbert-type deltas with similar facies associations and geometries are differently distributed along the Corinth Rift southern flank (e.g., Seger and Alexander, 2009) (Figs. 6, 7 & 9B). Whereas Plio-Pleistocene deltas outcrop with varying angular unconformity atop of uplifted Plio-Pleistocene syn-rift and Hellenic basement rocks (e.g., Ori, 1989; Gawthorpe et al., 2017a), Holocene deltas lie in a narrow rim along the coast (Figs. 6 & 7). In the east rift, a large low lying plain passes seawards to a wide coastal platform in the absence of deltas (Figs. 6, 7 & 9B). In the rift center, prominent Plio-Pleistocene deltas display thick foresets packages (>700 m) at up to ~1750 m elevation, and down-step in stranded offlapping sequences that become younger towards the under-developed Modern deltas in the gulf shore (e.g., Rohais et al., 2007; Seger and Alexander, 2009). In the west rift, less-developed Plio-Pleistocene deltas crop out along a relatively continuous strip behind well-developed Modern deltas, which coalesce in a broad coastal delta plain (e.g., Ford et al., 2009, 2016) (Fig. 6). The shift in the locus of growth of large deltaic systems from the rift center in the Plio-Pleistocene to the west in the Holocene may relate with changes in master fault activity and differential footwall uplift or changes in sediment supply.
3.4 Plio-Pleistocene (uplifted) basin extent
The extent of the exposed Plio-Pleistocene basin decreases westward along the rift southern flank strike, from an extensive area ~35 km long to a couple of strips each <10 km long (Fig. 9C). In the east rift, the Plio-Pleistocene rocks cover a large area of low relief (Figs. 6 & 9C). Towards the central rift, the uplifted syn-rift deposits are reduced to an extent of ~20 km. Similarly, the modern progradational coastal area loses extent until it is very limited or not existent between the towns of Kiato and Derveni (Karymbalis et al., 2016a, 2016b) (Fig. 9). However, in the west rift, the extent of the Plio-Pleistocene rocks presently outcropping onland is reduced in comparison to areas farther east, and they outcrop in elongated WNW-ESE areas alternating with basement rocks (Fig. 9C). Father west, the extent of the Pliocene marine basin
[Earth ArXiv postprint – Published in Earth Science Reviews]
22
is reduced to a stripe of several kilometers, i.e., smaller than anywhere else in the southern margin of the Corinth Rift (Fig. 9C).
3.5 Hanging wall synrift deposits
The rift basin is markedly asymmetric and dominated by the north dipping master fault system (e.g., Brooks and Ferentinos, 1984; Stefatos et al., 2002; Taylor et al., 2011), except at the basin ends, where antithetic faults are relevant (Fig. 8) (e.g., Hubert et al., 1996; Benedetti et al., 2003; McNeill et al., 2005; Bell et al., 2008). In the west, the transition from asymmetric to roughly symmetric is located around the area where East Eliki F crosses onland (e.g., Nixon et al., 2016), and albeit asymmetric, larger symmetry is also recognized in the eastern end of the rift basin (Sakellariou et al., 2007).
A rift-scale unconformity with an estimated age of ~620 ka, bounds two units with distinct seismic character that mark a change in setting from lacustrine to mixed
marine/lacustrine; a unit with non-coherent reflectors below the unconformity, and a unit with rhythmical alternations of low-/high-amplitude reflectors above it (Sachpazi et al., 2003;
Lykousis et al., 2007; Sakellariou et al., 2007; Bell et al., 2008, 2009; Taylor et al., 2011; McNeill et al., 2018). Synrift depocenters traced for both units (Fig. 9 in Nixon et al., 2016) mark a switch from a complex rift zone with distributed depocenters (Fig. 9D) to a markedly asymmetrical rift (Fig. 9E). This switch towards the present asymmetric rift may have taken place by establishment of the north dipping faults by ~620 ka and their later linkage by ~340 ka (Nixon et al., 2016). The upper unit is laterally continuous along the rift, with two exceptions; a second unconformity (~340 ka) exists in the west, and only the upper part of the sequence can be traced in the Alkyonides Gulf (Fig. 8) (e.g., Bell et al., 2008, 2009).
3.6 Topo-bathymetry
We analyse the morphology of the Corinth Rift in relation to its current bounding fault system, and its interrelation with geological and morphological elements, using stacked swath profiles of average topography. Stacked swath profiles (Armijo et al., 2015) are a suite of parallel swath profiles plot orthogonally to their strike. We use a 20-m DEM to derive stacked swath profiles that are either parallel or perpendicular to border faults (Fig. 7). See details on the procedure followed to produce the stacked swaths in Suppl. material C.
[Earth ArXiv postprint – Published in Earth Science Reviews]
23 3.6.1 Across the rift axis
Topographic variations in the rift central sector are the largest for both the maximum and minimum topographic envelopes (red and blue in Fig. 10A). The central rift has the highest mean elevations, the highest summit (Killini, 2376 m) and the former basin outcropping at the highest location (Mavro, 1756 m). In the south, flat-laying and gently south-dipping endorheic basins (Feneos, Stymfalia y Skotini plains; Figs. 6 & 7) remain overall at similar mean elevations for horizontal distances of ~40 km. Here, maximum and minimum topography show similar mean elevations (of ~1650 m and of ~650 m, respectively) for similar horizontal distances (Fig. 10A). The northward decreasing relief contains Gilbert delta topsets at ~1100-1200 m
(Evrostini) and ~900-1000 m (Klimenti) (Figs. 6 & 7) and reaches in 10-15 km bathymetric depths in excess of −800 m, as close as 2 km away from the shore (Fig. 10A). This represents a relief change of ~2.5 km in <15 km in the horizontal, or >3 km in <25 km, measured from the rift highest topography to its lowest bathymetry, i.e. a slope of ~9.5° or ~7°, respectively. Northwards, the flat basin floor lays at approx. −850 m for ~10 km and the gulf is the widest at sea level. The envelope of maximum relief in the northern margin rises from −750 m to ~1000 m in a rounded convex-up shape (Fig. 10A).
Fig. 10 (next page). Topobathymetry across the Corinth Rift in three “views” perpendicular to the current
rift-bounding fault. Each ~26 km wide swath is composed of 400 swath profiles, stacked over a projection line perpendicular to the average strike of the main fault in each sector (see below). The width of each individual swath is
calculated dynamically and of ~75 m. Relief is exaggerated ~8 times. Distance along each wide swath is measured from the master fault (positive northwards). (A) Topobathymetry associated with the Central Rift FA in a view looking
towards N295oE. (B) Topobathymetry associated with the Eliki FA as seen looking in a N290oE direction. (C)
Topobathymetry associated with the Aigio FA in a view looking towards N290oE. In all views the upper envelope (red
line) and the lower envelope (blue line) represent the maximum and minimum topobathymetry, respectively. Each individual sector of the master fault is shown with a 55o north dip in red. Other associated features are shown: rivers
and endorheic basins (dim red); topsets of Gilbert deltas in light brown (Late Pliocene - Early Pleistocene), blue (Mid-Late Pleistocene); and yellow for modern Gilbert Deltas.
[Earth ArXiv postprint – Published in Earth Science Reviews]
24
Topographic variations in the west rift are relevant in short horizontal distances, as marked by the maximum and minimum topography envelopes (Fig. 10B). The west rift contains the
second highest summit (Aroania, 2341 m) and a northward decreasing topography with topsets of Mid-Late Pleistocene Gilbert deltas at ~700-1000 m heights and <5 km from the border fault. Rivers with flat upstream reaches and steep lower reaches set the minimum topography and feed large modern Gilbert-type deltas (Fig. 10B). A flat wide bathymetry at −750 m in the east changes westward to a narrower rugged bathymetry at shallower depths (approx. −375 m). This change occurs in both basin margins and not only in relation to deltas. The maximum topography envelope in the northern margin has a concave-up profile not paralleled by the minimum topography envelope (Fig. 10B).
[Earth ArXiv postprint – Published in Earth Science Reviews]
25
The westernmost rift has the lowest variations in topography (Fig. 10C). Two
topographic maxima bound two differentiated areas in the southern margin. In the area close to the master fault, a steep maximum relief envelope decays monotonically from the footwall river headwaters, except for a topographic high in its westernmost end (“off-fault topography” in Fig. 10C). The area farther away from the master fault has a minimum topography envelope in relation to longer rivers. The rift is here the narrowest and shallowest, with a width of ~8 km at sea level and a basin floor at depths between −250 m and −350 m (Fig. 10C). The maximum and the minimum topographic envelopes in the northern margin have a sharp triangular shape with its maximum ~15 km north of the coast.
3.6.2 Along the rift axis
Maximum drainage topography has variable along-strike average elevations of ~750 m in the east, ~2000 m in the center and ~1600 m in the west (Fig. 11A). The maximum relief within ~21 km of the rift-bounding fault (Fig. 11B) similarly varies along-strike at heights ~70-80% of those in the maximum drainage topography (Fig. 11A). Both profiles significantly increase in elevation between the east and central rift while only the maximum drainage topography decreases markedly west of Aroania summit (at ~2341 m) (Figs. 6, 7 & 11). Bathymetric depths show a sharp transition in the east, from depths of ~150 m to >800 m. Similar bathymetric depths are maintained westwards for ~40 km, and then decrease gently to <250 m in ~40 km (Fig. 11C).
[Earth ArXiv postprint – Published in Earth Science Reviews]
26
Fig. 11 (prev. page). Stacked swath profiles of topography and bathymetry along the southern flank of the Corinth
Rift in a view parallel to the master fault. The “view” is looking SSW, with a projection line N105oE, defined to
represent the average strike of the master fault. Plotted profiles are exaggerated ~8 times. Relief in A and B panels is defined by 500 stacked swath profiles of estimated width ~90 m, on a 20m-resolution DEM. (A) Maximum relief
within the rift flank drainage is obtained clipping the DEM to the extent of the river networks draining the southern coast of the Gulf of Corinth, including the endorheic river basins; and (B) Maximum relief within ~21 km from the fault
is obtained clipping the DEM at ~21 km from the main fault and aims to approximate to the relief related to the bounding fault system. In these panels, no bathymetric data is used and there is no correction on the basis of master
fault position, i.e. plotted relief is a good approximation to footwall relief only in the area where the fault is at or near sea level (from Akrata eastwards for ~7 km, Fig. 6). River basins are marked in red in panel A, and the topsets of Gilbert delta are marked in blue (Mid-Late Pleistocene) and light brown (Calabrian) in panel (B). (C) Bathymetry from
north of the lower bathymetry axis to the south coast of the gulf, as seen by 500 stacked swaths profiles in a 50-m resolution bathymetry (see section 3.1).
River drainages and triangular facets stand out in the stacked swaths of southern margin of the Corinth Rift (Fig. 11). River drainages (dimmed red lines; Fig. 11A) show
significant differences along the main rift margin strike. Low laying drainages in the east exist at elevations below ~300 m. Flat concave-up drainages in the center lay at elevations between ~700 m and ~800 m in relation to the endorheic plains. Catchments farther west have similar morphologies decaying in elevation to ~600 m and tilting lightly to the east (Fig. 11A). Well-developed triangular facets in the center and west rift occur in four hierarchical levels and often have a perched Gilbert deltas laying at their triangular facets “tips” (Fig. 11B). The oldest Gilbert delta of the rift, Mavro (Figs. 6 & 7) outcrops at the highest fault-related relief (~1756 m) in relation to the highest set of triangular facets, with triangle tips at ~1600-1750 m (purple line; Fig. 11B). Gilbert delta topsets of younger age, Klimenti and Evrostini, outcrop to the sides of Mavro at heights coincident with the second highest tips of the triangular facets (at ~1000-1200 m). Gilbert deltas to the west (Platanos, Vouraikos, Kolokotronis and Meganitis) (Figs. 6 & 7) lay on top of triangular facets with tips at ~850-950 m (Fig. 11B). A fourth set of triangular facets, with tips at ~500 m elevation, is seen only in the center of the margin (Fig. 11B).
Aforementioned first-order variations along the rift axis may result from changes in rift maturity potentially derived from decreasing slip rates and/or younger ages in border fault westwards. 3.7 Footwall river long profiles and tectonic knickpoints
We analyse the longitudinal profile geometry of the 16 largest rivers draining the southern margin of the rift, and picked tectonic knickpoints in their trunks (Fig. 12 & Table 1). We
reproduce river profile geometry using Topotoolbox 2.0 (Schwanghart and Scherler, 2014), and perform knickpoint analysis with the χ-profiler package (Gallen and Wegmann, 2017). We
[Earth ArXiv postprint – Published in Earth Science Reviews]
27
analyse knickpoints in river trunks to assess their tectonic origin, which we corroborate with knickpoints at similar heights in nearby tributary streams. See Suppl. material D for details on river profile analysis.
In the east rift, river longitudinal profiles are flat (<300 m elevation in upstream distances of >15 km) and show broad up-convexities (Fig. 12A, right). Here, all trunks show a knickpoint laying at low elevations (100-200 m) (Fig. 12B & Table 1), and a variable number of knickpoints with heights that lay at three elevations (two at ~275 m, two at ~450 m and one at ~700 m). In the central rift, the shortest and steepest longitudinal profiles (>1 km height in <15 km) flow towards the gulf at the front of wind-gaps bounding large endorheic plains of reversed rivers. Central rift exorheic and endorheic catchments, taken together, show the largest divergence from theoretical profiles in steady-state (Fig. 12A, center). Here, each river has either three or four tectonic knickpoints, and there are three families at different heights (Fig. 12B & Table 1). A set of knickpoints lay again at low elevations (100-200 m) for all but Trikalitikos R, which is the largest river network. Two other sets of tectonic knickpoints lay at ~1100-1200 m
(Trikalitikos, Fonissa, Dervenios, Krios), and between ~1500 m and ~1700 m for the two river networks that reach that elevation (Trikalitikos, Krios) (Fig. 12B, Table 1). In between these knickpoints, their height is more distributed, but another set can be seen gaining elevation from east (500 m at Trikaitikos R) to west (700 m at Krios R) (Fig. 12B). Fonissa R has another
tectonic knickpoint at ~375 m and Skoupeiko R at ~825 m.
In the west rift, rivers alternate long (≥35 km) and short (<15 km) longitudinal profiles except for the westernmost footwall river catchments. Short rivers catchments compare with the steep profiles of the central rift. Long rivers have morphologies with up-convexities departing from an inferred steady state profile geometry (Fig. 12A, left) and declining in steepness westwards (see Fernández-Blanco et al., 2019a for details). In the west rift, we differentiate two areas. Rivers transecting the Eliki FA have four tectonic knickpoints, except Ladopotamos R, with three (Fig. 12B, Table 1). With the exception of the latter, one set of knickpoints lies again at elevations between 100 m and 200 m. Tectonic knickpoints of the other three families lay at lower elevations for the longer trunks (Krathis, Vouraikos, Selenous) and at higher elevations for the shorter trunks (Ladopotamos, Kerinitis). Footwall rivers
associated with the Aigio FA (Meganitis, Finikas) present two knickpoints each and none correspond to the low elevation knickpoints observed elsewhere in the southern rift flank (Fig 12B, Table 1). Contrarily, the uppermost set of tectonic knickpoints in both rivers is at a similar position than the set of tectonic knickpoints at highest elevations in all trunks eastwards.
[Earth ArXiv postprint – Published in Earth Science Reviews]
28
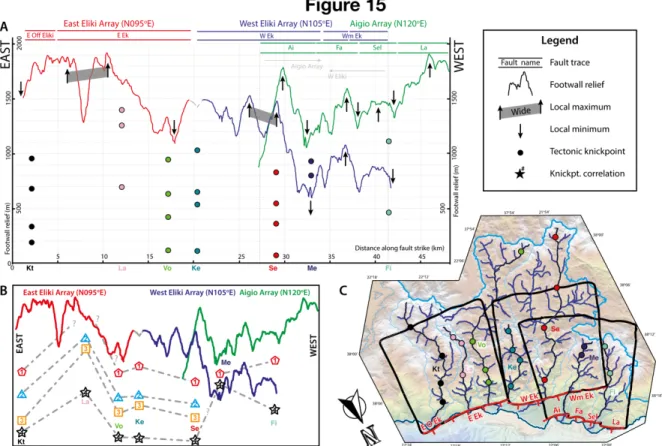
Fig. 12. Sixteen largest river catchments in the southern margin of the Corinth Rift and tectonic knickpoints of their
trunks. (A) Illustrative representations of main characteristics of river longitudinal profiles and plainviews per rift
sector defined by this contribution; west (left), center (center) and east (right) rift, exaggerated 4 times in the vertical.
(B) Main tectonic knickpoints of the trunks of the sixteen largest river catchments of the southern margin of the
Corinth Rift in longitudinal profile view, grouped per rift sector. East: (Xe) Xerias, (Ra) Raizanis, (Za) Zapantis and (As) Asopos; Center: (Tr) Trikalitikos, (Fo) Fonissa, (Sk) Skoupeiko, (De) Dervenios and (Kr) Krios; West: (Kt) Krathis, (La) Ladopotamos, (Vo) Vouraikos, (Ke) Kerinitis, (Se) Selinous, (Me) Meganitis and (Fi) Finikas. (C) Location of tectonic
knickpoints in map view. For this analysis we also used slope-area and χ plots . The stars mark the lower set of tectonic knickpoints seen in most river trunks at low elevations.
[Earth ArXiv postprint – Published in Earth Science Reviews]
29
4 Theoretical background: Footwall record of normal fault growth
Normal faults growing self-similarly by tip propagation have distinct individual displacement profiles with displacement maximum at the centre of the fault total length and displacement minima at its ends (e.g., Dawers et al., 1993; Manighetti et al., 2005; Childs et al., 2017).Elliptical to triangular fault displacement profiles are common, although mechanical restrictions like adjacent faults and/or original location of the fault nucleation point result in other shapes (e.g., Manighetti et al., 2001, 2005). The displacement profile of single normal faults is similarly modified during fault growth as local stress fields deviate at its tips by mechanical interactions with adjacent faults (e.g., Willemse, 1997; Gupta and Scholz, 2000). This intrinsic
characteristics of normal fault displacement profiles help evaluate whether fault segments adjacent at the surface are connected at depth.
Whereas unconnected faults initiating mechanical interaction may have a displacement profile with more than one maxima and reduced aspect ratios, fault segments mechanically linked at depth show a single displacement profile for their summed fault lengths and normal aspect ratios (e.g., Anders and Schlische, 1994; Dawers and Anders, 1995; Gupta and Scholz, 2000; Manighetti et al., 2001, 2005). Faults that grew independently and later linked may show a large-wavelength composite displacement profile composed of fault displacement profiles with shorter wavelengths (e.g., Cowie and Roberts, 2001; Whittaker and Walker, 2015). Between initial mechanical interaction and full linkage of individual fault strands, increased aspect ratios and transient “under-recovered” displacement profiles briefly occur as lateral tip propagation and fault lengthening is limited while faster-than-normal displacement takes place at the linkage zone in order to reach a new “recovered” single-fault profile (e.g., Cartwright et al., 1995).
4.1 Footwall elements used as proxies for normal fault growth
Range front relief is the result of cumulative fault displacement and can be used to assess the dimensions and the history of growth and linkage of range-bounding normal faults (e.g., Dawers and Anders, 1995; Gupta and Scholz, 2000). If erosion is effective and fault tip propagation and slip rate are coupled, the range front relief maxima occurs at a uniform distance from their border faults (Densmore et al., 2005, 2007). We use an equivalent to range
[Earth ArXiv postprint – Published in Earth Science Reviews]
30
front relief, footwall relief (Fig. 13B), defined as the height of the first major slope break in the extensional footwall, measured vertically from the trace of their active normal faults (e.g., Whittaker and Walker, 2015), and can be used as a proxy to upper-limit fault displacement profile (Fig. 13). Suppl. material E provides details about our procedure to calculate footwall relief.
While migrating upstream as a kinematic wave (Rosenbloom and Anderson, 1994), the knickpoint bounds steeper downstream river reaches adjusted or adjusting to the new uplift conditions from flatter upstream river reaches unaware of the uplift rate change (Fig. 13A) (e.g., Whipple and Tucker, 1999; Snyder et al., 2000). Whereas knickpoint retreat rates (map view) are fundamentally controlled by drainage area and bedrock erodibility (e.g., Wobus et al., 2006; Berlin and Anderson, 2007), knickpoint vertical propagation rates (profile view) are directly proportional to tectonic change amplitude (e.g., Whittaker et al., 2008). Hence, tectonic
knickpoints migrate upwards predictably and have heights, measured from the active fault, that scale with the fault vertical displacement and footwall relief (e.g., Kent et al., 2016). A given set of tectonic knickpoints found in river drainages of extensional footwalls may be related to three fault-related events: fault initiation, fault linkage or fault slip rate increase (Whittaker and
[Earth ArXiv postprint – Published in Earth Science Reviews]
31
Fig. 13 (prev. page). (A) Schematic representation of elements in extensional footwalls in relation with their active
faults in an along-strike view and footwall rivers and their tectonic knickpoints in across-strike view. (B) Elements of
an extensional footwall and their relation with the proxies of relief used in this study. (C) Self-similar growth of a
normal fault, as shown by geomorphic features in its footwall, in four time-steps: (t0) steady-state of a river network - Gilbert delta system; (t1) initiation of normal fault activity and footwall flexural uplift propels formation of a tectonic
knickpoint and uplifts former Gilbert deltas; (t2) lateral growth of the normal fault leads to inclusion of rivers in its footwall, and the formation of new tectonic knickpoints and uplift of new Gilbert-deltas; (t3) lateral self-growth and perpetuation of t2. Similar constraints by Gilbert-deltas on fault displacement profile (albeit more accurate) can be inferred using marine terraces. Other inferences on fault displacement profiles can be obtained from footwall relief and total topography. Assuming that geomorphic features formed at each time-step are not eroded and can be
dated, their location and height provide key constraints on the fault growth and displacement profile in time.
Fluvial geomorphology accounting for normal fault laws allow the evaluation of fault growth, linkage, and inferences of tectonic and fault throw rates (e.g., Boulton and Whittaker, 2009; Whittaker and Boulton, 2012; Whittaker and Walker, 2015; Kent et al., 2016; Gallen and Wegmann, 2017). For example, in detachment-limited rivers, a new local convexity or
knickpoint forms in a footwall river after an increased uplift rate led by a fault slip increase. Correlatable marine terraces and/or Gilbert-type deltas can be used as strain markers and allow reconstructions of coastal landscapes (Fig. 13C). Marine terrace shoreline angles, at
[Earth ArXiv postprint – Published in Earth Science Reviews]
32
the intersection between the terrace and its inland-bounding cliff, best characterize sea level position during terrace formation, typically in sea level highstands (Lajoie, 1986; Anderson et al., 1999; Scott and Pinter, 2003). Similarly, Gilbert-type delta topset-foreset contacts set approximately at sea level (Gilbert, 1890) as proximal topsets extend the alluvial plain subaerially, and distal foresets prograde basinwards underwater. Sets of coeval
morphotectonic markers, i.e. marine terraces of the same sea-level highstand or Gilbert deltas deposited at similar age, may form sequentially along uplifting coasts and lead to uplifted sets that down-step coastwards into younger sets (Figs. 13B, C). Land relative upwards motion between the formation of two sets of morphotectonic markers can be retrieved from the height difference between them, taking into account past sea-level positions. If coastal uplift occurs in extensional footwalls, the land upwards motion relative to the sea level is a proxy for fault displacement, and sets of coeval morphotectonic markers can be approximated to fault displacement profiles in time (Fig. 13C). Relative along-strike fault uplift rates can be derived using the age of the coeval morphotectonic sets.
4.2 Approach to reconstruct normal fault growth in time
We propose a conceptual framework to reconstruct growth and propagation history of active normal faults (Fig. 14). The framework uses the first-order morphological expression of
topography, relief, river catchments and morphotectonic markers in extensional footwalls (Figs. 13 & 14), and is predicated on the response to fault linkage expected in fault displacement profiles and tectonic knickpoints of extensional footwall river profiles (e.g., Anders and Schlische, 1994; Dawers and Anders, 1995; Gupta and Scholz, 2000; Cowie and Roberts, 2001; Manighetti et al., 2001, 2005; Attal et al., 2008; Whittaker et al., 2008; Whittaker and Boulton, 2012; Whittaker and Walker, 2015; Gallen and Wegmann, 2017). This framework builds on these studies to discriminate, barring complicating factors, the relative time of activity of individual fault segments and linkage mode; simple, directed or propagated (Fig. 14).
Co-linear normal faults that initiated activity concurrently and later interacted by simple (non-directed) linkage (Fig. 14C) present symmetrical fault displacement profiles throughout their evolutionary history, both as individual and composite faults. These normal faults show two sets of genetically-linked tectonic knickpoints. The oldest set of tectonic knickpoints forms at the moment of initiation of each fault and lays at higher elevations, roughly similar in all river networks. The youngest set of knickpoints develops when faults link and lays at lower
[Earth ArXiv postprint – Published in Earth Science Reviews]
33
elevations, with knickpoint heights relatively higher for footwall river profiles in the area of fault linkage (Fig. 14C).
Although co-linear normal faults initiating activity at different times may develop
similarly asymmetric end displacement profiles, we envisage characteristic tectonic knickpoint arrays depending on whether faults are initially unconnected and link successively or new fault segments become active by propagation. In the successive initiation case (Fig. 14D left), fault displacement profiles are symmetrical until the moment of linkage, and have a composite asymmetrical displacement profile from linkage until displacement profile “recovery” to single fault shape. The displacement maxima of the older fault sets at a higher position than the displacement maxima in the younger fault. Three families of knickpoints occur (Fig. 14D left); (i) an oldest set at the relative highest elevations exists solely in the oldest fault footwall; (ii) a second set appears at mid elevations solely in the youngest fault footwall; (iii) one last set of knickpoints occurs at the relative lowest elevations along the strike of the composite fault, with knickpoints that lay higher at its linkage zone and are absent at its tips.
[Earth ArXiv postprint – Published in Earth Science Reviews]