American Journal of Epidemiology
Copyright © 1998 by The Johns Hopkins University School of Hygiene and Public Health All rights reserved
Vol. 147, No. 2
Printed in U.S.A.
A BRIEF ORIGINAL CONTRIBUTION
Collecting Saliva Samples by Mail
Jean-Frangois Etter, Thomas V. Perneger, and Anne Ronchi
Collecting saliva samples by mail can serve numerous purposes in epidemiologic research. The objectives of this study were to assess what proportion of participants in a mail survey would provide a saliva sample and whether incentives could improve participation. In 1995,2,994 students, faculty, and staff members of Geneva University, Geneva, Switzerland, were randomized to receive, together with a mailed questionnaire about smoking, a saliva vial, a ballpoint pen, the offer of a lottery, or any combination of these. After one mailing and a reminder letter, response rates were 52% among those who had been requested to provide saliva and 63% among controls (p < 0.001). In the former group, most respondents (98%) provided a saliva sample. Incentives improved participation only among those who were asked to provide saliva (lottery: + 1 1 % response, p = 0.003; pen: + 6 % response, p = 0.1). The final participation, after up to three reminders, was 76% overall. The authors conclude that while the collection of saliva samples by mail is feasible it tends to decrease response rates. Am J Epidemiol 1998;147:141-6.
cotinine; data collection; incentives; postal service; randomized controlled trials; saliva; smoking; specimen handling
Collecting saliva samples by mail can serve numer-ous purposes in epidemiologic research, including measurement of cotinine, a metabolite of nicotine ( 1 -3). Cotinine is stable in unrefrigerated saliva (4), even when samples are collected by mail and remain unfro-zen for 12 days (5, 6). Collection of saliva samples by mail costs four times less than collection at the par-ticipant's workplace (6). Other substances that are stable in unrefrigerated saliva and could be collected by mail include thiocyanate (7, 8), genetic materials (9), testosterone (10), and human immunodeficiency virus (HIV) antibodies (11, 12).
Despite the potential benefits of collecting saliva samples by mail, to our knowledge, only studies of technical feasibility have so far been conducted (7-11). A possible concern is that requesting saliva sam-ples may reduce response rates, but no evidence exists regarding this issue (13). We aimed to establish what proportion of potential respondents to a mailed survey about smoking would agree to provide a saliva sample,
Received for publication January 30, 1997, and accepted for publication August 11, 1997.
Abbreviation: HIV, human immunodeficiency virus.
From the Institute of Social and Preventive Medicine, University of Geneva, Geneva, Switzerland.
Reprint requests to Dr. Jean-Francois Etter, Institute of Social and Preventive Medicine, University of Geneva, CMU, Case postale, CH-1211 Geneva 4, Switzerland.
and whether requesting saliva affects the response rate.
Various incentives may increase response to mailed surveys (14), such as offering a pen (15-17) or par-ticipation in a lottery (18-22). Our second aim was to assess whether response rates could be increased by offering participation in a lottery and/or a ballpoint pen.
Finally, asking participants to provide saliva or of-fering incentives could bias results, either by modify-ing response rates in population subgroups (selection bias) or by altering respondents' answers (information bias). Our third objective was to establish whether such procedure-related bias occurred.
MATERIALS AND METHODS Study setting and population
The study population (n = 9,686) included students (82 percent), faculty (12 percent), and administrative and technical staff (6 percent) of the University of Geneva, Geneva, Switzerland. A simple random sam-ple of 3,000 persons was drawn from the university files. This file indicated the address, birth date, and sex of each participant. The study was approved by the review board of the Institute of Social and Preventive Medicine of the University of Geneva.
Study design
Potential participants were randomized in a three-way factorial trial of the following interventions: 1) request to provide a saliva sample, 2) inclusion of a ballpoint pen (value <$1), and 3) offer to participate in a lottery if the questionnaire was returned. Lottery prizes were a weekend in Paris for two persons (valued at $540) and nine vouchers for books (valued at $40 each). Randomization resulted in groups of similar age (mean age, 29 years) and sex (men, 42 percent). After deletion of six names that appeared twice, the survey package was mailed to 2,994 persons in November
1995.
was of interest. We planned to collect saliva only in the initial mailing, because our resources allowed lab-oratory analysis only of a limited number of samples. A reminder postcard was sent 2 days after the first mailing (29), and a reminder letter was sent to all nonrespondents after 15 days, without the question-naire or saliva vial. The randomized intervention was interrupted on day 28 of data collection. To maximize the final response rate, all reminder packages sent to nonrespondents after day 28 included both incentives. Data collection ended 121 days after the initial mail-ing, when up to four survey packages had been sent to nonrespondents.
Data collection
The initial mailing contained the questionnaire, a cover letter explaining the purpose of the study, and a business reply envelope. Questions covered smoking history, exposure to environmental tobacco smoke, health status (SF-36 "general health" scale (23, 24)), stages of change of smoking (25) and, for smokers only, the pros and cons of smoking (26), level of nicotine dependence (27), and smoking self-efficacy (28). The date when the questionnaire was mailed back was assessed by the post office date of cancella-tion on the envelope.
Saliva was collected in a plastic vial containing a sterile dental cotton roll (Salivette, Sarstedt, Niim-brecht, Germany, article no. 511534). The cover letter indicated that nonsmokers too should provide saliva, because exposure to environmental tobacco smoke
Analysis
Separate analyses were conducted for the "random-ized phase" (days 1-28), the "most effective interven-tion phase" (days 29-121), and overall (days 1-121). At the end of the "randomized phase," we assessed selection bias by comparing response rates by age and sex across randomized groups; interactions between demographic variables and incentives were tested in logistic regression models with interaction terms (30). We also examined procedure-related bias by compar-ing respondent characteristics across randomized groups. We also compared participants who responded during the "randomized phase" and the "most effective intervention phase." Finally, we compared delays be-tween the initial mailing and the return of the ques-tionnaire among subgroups of respondents. Participa-tion was described using Kaplan-Meier curves (30).
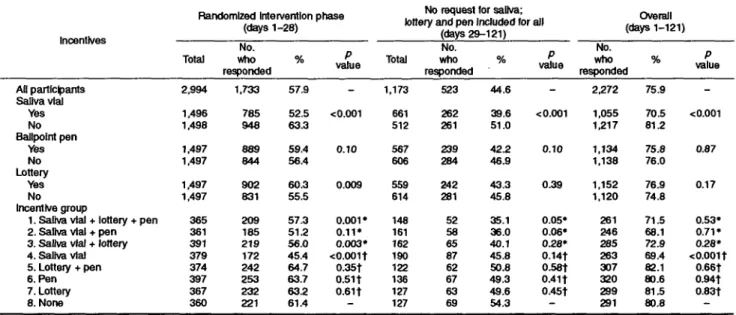
TABLE 1. Response rates to a mailed questionnaire in a three-way factorial randomized trial of requesting a saliva sample, offering a lottery and a ballpoint pen, Geneva, Switzerland, 1995
Incentives All participants Cflih/a vial Oailvd Vial Yes No Ballpoint pen Yes No Lottery Yes No Incentive group
1. Saliva vial + lottery + pen 2. Saliva vial + pen 3. Saliva vial + lottery 4. Saliva vial 5. Lottery + pen 6. Pen 7. Lottery 8. None
Randomized Intervention phase (days 1-28) Total 2,994 1,496 1.498 1,497 1,497 1,497 1,497 365 361 391 379 374 397 367 360 No. who responded 1,733 785 948 889 844 902 831 209 185 219 172 242 253 232 221 % 57.9 52.5 63.3 59.4 56.4 60.3 55.5 57.3 51.2 56.0 45.4 64.7 63.7 63.2 61.4 P value -<0.001 0.10 0.009 0.001* 0.11* 0.O03* <0.001t 0.35t 0.511 0.61 f
-No request tor saliva; lottery and pen Included tor all
(days 29-121) Total 1,173 661 512 567 606 559 614 148 161 162 190 122 136 127 127 No. who responded 523 262 261 239 284 242 281 52 58 65 87 62 67 63 69 % 44.6 39.6 51.0 42.2 46.9 43.3 45.8 35.1 36.0 40.1 45.8 50.8 49.3 49.6 54.3 P value -< 0.001 0.10 0.39 0.05* 0.06* 0.28* 0.14t 0.58t 0.411 0.45t -Overall (days 1-121) No. who responded 2,272 1,055 1,217 1,134 1,138 1,152 1,120 261 246 285 263 307 320 299 291 % 75.9 70.5 81.2 75.8 76.0 76.9 74.8 71.5 68.1 72.9 69.4 82.1 80.6 81.5 80.8 P value -<0.001 0.87 0.17 0.53* 0.71* 0.28* <0.001t 0.66t 0.94t 0.83t -• Difference with group 4 (saliva vial only).
Collecting Saliva Samples by Mail 143 10 20 30 40 50 D a y s of d a t a c o l l e c t i o n 60 o a. 10 D a y s of d a t a c o l l e c t i o n
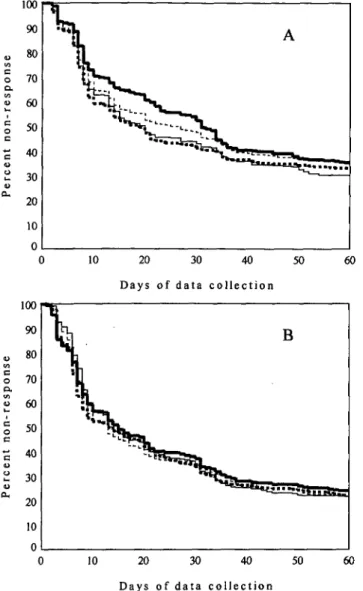
FIGURE 1. Cumulated nonresponse rate to a mail survey in eight randomized groups, Geneva, Switzerland, 1995. The individuals in the eight groups were requested to provide a saliva sample (A) or no saliva sample (B), and received the following incentives: lottery and ballpoint pen (heavy dashed line), lottery only (light solid line), pen only (light dashed line), or no incentive (heavy solid line).
RESULTS Response rates
During the "randomized phase," including a saliva vial in the survey package decreased the response rate by 11 percent (table 1). Almost all participants in the saliva vial group (769 out of 785 (98 percent)) also returned the saliva sample.
In the saliva vial group, during the "randomized phase," both the lottery (+11 percent) and the pen (+6 percent) improved response rates, but this trend lacked statistical significance. Cumulative incentives was hardly better than the lottery alone (+1 percent). When no saliva sample was requested, incentives had
no statistically significant effects on response rates (table 1).
During the "most effective intervention phase," per-sons who had received a saliva vial with the first survey package had persistently lower response rates, even when they were no longer reminded to provide saliva. Persons who received incentives for the first time on day 29 had higher response rates that persons who had already received these incentives with the first survey package.
Response delay among respondents
Respondents in the saliva vial group returned the questionnaire on average 2 days later than controls (19 vs. 17 days, p = 0.009) (figure 1). The lottery accel-erated response only in the saliva vial group (—2.6 days, p = 0.03). Effects of the pen, age, and sex were nonsignificant.
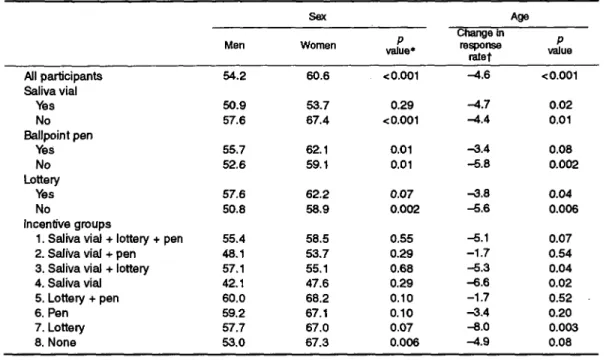
Incentive-related selection bias. In the "random-ized phase," increasing age was significantly nega-tively associated with response rate, regardless of in-centive group (table 2). The impact on response rates of a saliva sample request was stronger in women (-13.7 percent) than in men (—6.7 percent, between-sex difference; p — 0.04). The response rate was similar in men and women in the saliva vial group, but it was lower in men than in women in the control group. The lottery and the pen had similar effects on response in men and women and across age groups.
Procedure-related bias. At the end of the "ran-domized phase," respondents in the saliva vial group were similar to controls in terms of age, sex, level of education, health status, proportion of smokers, and stages of change (table 3). Among smokers, the two groups had similar scores on the nicotine dependence test, the pros and cons of smoking, and self-efficacy. Smokers who had been asked to provide saliva re-ported smoking on average 1.4 fewer cigarettes per day than controls, but the difference was not statisti-cally significant. Answers were similar in groups de-fined by receipt of incentives (data not shown). Early vs. late respondents
The proportion of smokers was 6 percent lower among persons who returned the questionnaire during the "randomized phase" than among persons who re-turned it later (table 3). In all other respects, early and late respondents were similar.
DISCUSSION
In a mail survey of university students, faculty, and staff, half the potential participants provided a saliva sample after an initial mailing, reminder postcard, and
TABLE 2. Response rates to a mailed questionnaire after one mailing and a reminder letter ("randomized phase"), according to sex, age, and three randomly allocated incentives, Geneva, Switzerland, 1995
Sex Age
Men Women value*P
Change in response ratef P value Ail participants Saliva vial Yes No Ballpoint pen Yes No Lottery Yes No Incentive groups
1. Saliva vial + lottery + pen 2. Saliva vial + pen 3. Saliva vial + lottery 4. Saliva vial 5. Lottery + pen 6. Pen 7. Lottery 8. None 54.2 60.6 < 0.001 -4.6 < 0.001 50.9 57.6 55.7 52.6 57.6 50.8 55.4 48.1 57.1 42.1 60.0 59.2 57.7 53.0 53.7 67.4 62.1 59.1 62.2 58.9 58.5 53.7 55.1 47.6 68.2 67.1 67.0 67.3 0.29 <0.001 0.01 0.01 0.07 0.002 0.55 0.29 0.68 0.29 0.10 0.10 0.07 0.006 -4.7 -4.4 -3.4 -5.8 -3.8 -5.6 -5.1 -1.7 -5.3 -6.6 -1.7 -3.4 -8.0 -4.9 0.02 0.01 0.08 0.002 0.04 0.006 0.07 0.54 0.04 0.02 0.52 0.20 0.003 0.08 * Chi-square test.
t Change in response rate (percent) for a 10-year increase in age (linear regression).
TABLE 3. Impact of request to provide a saliva sample on the information obtained from a mailed questionnaire among persons who returned the questionnaire during the "randomized phase," Geneva, Switzerland, 1995
Respondent characteristics
No. Men (%) Mean age (years) Education (years)
SF-36 "general health" scaled Stages of change Precontemplation (%) Contemplation (%) Preparation (%) Action (%) Maintenance (%) Current smokers (%) Among current smokers
Cigarettes per day Nicotine dependence§ Pros of smokingH Cons of smoking! Self-efficacy! Missing answers (%) Randomized phase Requested to provide a saliva sample Yes 785 41.0 28.4 17.3 76.3 46.2 12.5 5.0 12.9 23.4 27.1 10.7 1.85 50.0 49.8 50.8 11.8 No 948 38.0 28.6 17.3 76.2 46.9 12.8 4.9 12.2 23.2 27.9 12.2 2.04 50.7 50.4 49.4 11.9 P value* -0.20 0.63 0.87 0.98 1.0 0.69 0.07 0.36 0.48 0.57 0.08 0.86 Most effective Intervention phase All 539 43.6 28.6 17.7 75.3 49.4 15.4 5.7 13.4 16.2 33.8 11.4 1.91 49.1 49.8 50.7 11.7 P valuet -0.09 0.89 0.05 0.29 0.21 0.005 0.84 0.79 0.14 0.68 0.26 0.82 * p value on difference between saliva and no-saliva groups during randomized phase,
t p value on difference between persons who returned the questionnaire during the randomized phase and persons who returned it during the best intervention phase.
$ Scaled between 0 (worst) and 100 (best) (23, 24).
§ Fagerstrom test, mean score between 0 (least dependent) and 10 (most dependent). I Mean scores, standardized to mean = 50 and standard deviation = 10.
Collecting Saliva Samples by Mail 145
reminder letter. Requesting a saliva sample reduced the initial response rate to the questionnaire; because we asked for a saliva sample only in the first mailing, we do not know how much repeated requests for saliva would have affected the final response rate. When a saliva sample was requested, offering a pen or partic-ipation in a lottery increased returns of questionnaires and saliva vials.
The request for a saliva sample may reduce partic-ipation for several reasons. First, asking for a biologic sample may irretrievably antagonize some potential participants. This hypothesis is suggested by persis-tently lower participation rates among persons who had received a" saliva vial in the first mailing, even after requests for saliva samples were discontinued. A better explanation of the purpose of the study may alleviate this problem. Second, some persons may have been concerned about confidential handling of the samples (for instance, some may have feared that drug or HIV tests would be performed). We have no evidence that this occurred, but better explanations and an anonymous data collection procedure may min-imize such concerns. Third, the fact that incentives were effective only in the saliva group suggests that some people failed to return the saliva vial because they did not receive any compensation in exchange for their collaboration. Only this barrier can be overcome by appropriate incentives. However, what incentives to choose remains an open question.
Results observed among persons who were not re-quested to provide saliva are consistent with previous studies which showed that a lottery ticket (18) and a raffle (19) have little influence on response rates, but conflict with the findings of others (20-22). Inconsis-tencies between studies suggest that incentives should be tailored to particular study groups. The choice of incentives may be optimized by appropriate pretests (20, 31). One option worth exploring is whether prom-ising to inform participants of their laboratory result would increase their willingness to provide a saliva sample.
In view of the reduced participation caused by saliva sample requests, an important result is that such a request did not cause bias, particularly regarding smoking-related information. In adolescent popula-tions, saliva collection is sometimes used to increase the sincerity of answers (32, 33); in the adult popula-tion that we studied, this would be unnecessary. The selection bias associated with the timing of response (higher proportion of smokers among late respon-dents) was unrelated to saliva sample requests.
Several features of this study may limit its general-izability. First, we studied a highly educated popula-tion, and participation in mail surveys increases with
education level (34, 35). Therefore, our response rates were probably higher than those that could be ex-pected in general population surveys. Moreover, the survey was sponsored by a university, which also increases participation (36, 37). Finally, populations of other countries may react differently to request for saliva samples, for various cultural reasons. Neverthe-less, the feasibility of collecting saliva samples by mail opens promising perspectives in epidemiologic research.
ACKNOWLEDGMENTS
This research was supported by the Geneva Health Au-thority; the Swiss Federal Office of Public Health; the Swiss Foundation for Health Promotion; the University of Ge-neva; the Swiss Cancer League; the Geneva Cancer League; the Geneva Tuberculosis League; the Radix Foundation; and by grant nos. 3233-32069-91 and 32-47122.96 from the Swiss National Science Foundation to Drs. Perneger and Etter.
REFERENCES
1. Abrams DB, Follick MJ, Biener L, et al. Saliva cotinine as a measure of smoking status in field settings. Am J Public Health 1987;77:846-8.
2. Etzel RA. A review of the use of saliva cotinine as a marker of tobacco smoke exposure. Prev Med 1990;19:190-7. 3. Kemmeren JM, van Poppel G, Verhoef P, et al. Plasma
cotinine: stability in smokers and validation of self-reported smoke exposure in nonsmokers. Environ Res 1994;66: 235-43.
4. Greeley DA, Valois RF, Bernstein DA. Stability of salivary cotinine sent through the US mail for verification of smoking status. Addict Behav 1992;17:291-6.
5. Foulds J, Bryant A, Stapleton J, et al. The stability of cotinine in unfrozen saliva mailed to the laboratory. (Letter). Am J Public Health 1994;84:1182-3.
6. Murray DM, McBride C, Lindquist R, et al. Sensitivity and specificity of saliva thiocyanate and cotinine for cigarette smoking: a comparison of two collection methods. Addict Behav 1991;16:161-6.
7. Schneider SJ, Singer H. Validating reports of nonsmoking with breath and saliva samples: your checkup is in the mail. Addict Behav 1983;8:187-91.
8. Sexton M, Nowicki P, Hebel JR. Verification of smoking status by thiocyanate in unrefrigerated, mailed saliva samples. Prev Med 1986;15:28-34.
9. Hayney MS, Dimanlig P, Lipsky JJ, et al. Utility of a "swish and spit" technique for the collection of buccal cells for TAP haplotype determination. Mayo Clin Proc 1995;70:951-4. 10. Dabbs JM. Salivary testosterone measurements: collecting,
storing, and mailing saliva samples. Physiol Behav 1991 ;49: 815-17.
11. Stark K, Warnecke C, Brinkmann V, et al. Sensitivity of HTV antibody detection in saliva. Med Microbiol Immunol 1993; 182:147-51.
12. Van den Akker R, van den Hoek JAR, van den Akker WMR, et al. Detection of HIV antibodies in saliva as a tool for epidemiological studies. AIDS 1992;6:953-7.
13. Velicer WF, Prochaska JO, Rossi JS, et al. Assessing outcome in smoking cessation studies. Psychol Bull 1992;! 11:23—41.
14. Church AH. Estimating the effect of incentives on mail survey response rates: a meta-analysis. Public Opinion Q 1993;57: 62-79.
15. Houston MJ, Jefferson RW. The negative effects of personal-ization on response patterns in mail surveys. J Marketing Res
1975;12:114-17.
16. Pucel DJ, Nelson HF, Wheeler DN. Questionnaire follow-up returns as a function of incentives and responder characteris-tics. Vocational Guidance Q 1971;19:188-93.
17. May RC. What approach gets the best return in mail surveys? Industrial Marketing 1960;45:50-l.
18. Marrett LD, Kreiger N, Dodds L, et al. The effect on response rates of offering a small incentive with a mailed questionnaire. Ann Epidemiol'1992;2:745-53.
19. Mortagy AK, Howell JBL, Waters WE. A useless raffle. J Epidemiol Community Health 1985,39:183-4.
20. Woodward A, Douglas B, Miles H. Chance for a free dinner increases response to mail questionnaire. Int J Epidemiol 1985; 14:641-2.
21. Blythe BJ. Increasing mailed survey responses with a lottery. Soc Work Res Abstr 1986;22:18-19.
22. Spry VM, Melbourne IH, Sallis JG, et al. Recruiting survey respondents to mailed surveys: controlled trials of incentives and prompts. Am J Epidemiol 1989;30:166-72.
23. Perneger TV, Leplege A, Etter JF, et al. Validation of a French-language version of the MOS 36-item short form health survey (SF-36) in young healthy adults. J Clin Epide-miol 1995;48:1051-60.
24. Ware JE, Sherbourne CD. The MOS 36-item short form health survey (SF-36). I. Conceptual framework and item selection. Med Care 1992;30:473-83.
25. Prochaska JO, DiClemente CC, Norcross JC. In search of how people change. Applications to addictive behaviors. Am Psy-chol 1992;47:1102-14.
26. Velicer WF, Di Clemente CC, Prochaska JO, et al. Decisional
balance measure for assessing and predicting smoking status. J Pers Soc Psychol 1985;48:1279-89.
27. Heatherton TF, Kozlowski LT, Frecker RC, et al. The strom test for nicotine dependence: a revision of the Fager-strom tolerance questionnaire. Br J Addict 1991 ;86:1119-27. 28. Bandura A. Self-efficacy mechanism in human agency. Am
Psychol 1982;37:122-47.
29. Pemeger TV, Etter JF, Rougemont A. Randomized trial of use of a monetary incentive and a reminder card to increase the response rate to a mailed health survey. Am J Epidemiol 1993;138:714-22.
30. Clayton D, Hills M. Statistical models in epidemiology. Oxford, England: Oxford University Press, 1993.
31. Groves RM, Cialdini RB, Couper MP. Understanding the decision to participate in a survey. Public Opinion Q 1992; 56:475-95.
32. Jones EE, Sigal H. The bogus pipeline: a new paradigm for measuring affect and attitude. Psychol Bull 1971;76:349-64. 33. Kombo KA, Kelder SH, Perry CL, et al. Effects of a saliva pipeline procedure on adolescent self-reported smoking be-havior and youth smoking prevention outcomes. Prev Med 1993,22:857-65.
34. Jooste PL, Yach D, Steenkamp HJ, et al. Drop-out and new-comer bias in a community cardiovascular follow-up study. Int J Epidemiol 1990,19:284-9.
35. Rodes A, Sans S, Balana LL, et al. Recruitment methods and differences in early, late and non-respondents in the first MONICA-Catalonia population survey. Rev Epidemiol Sante Publique 1990;38:447-53.
36. Fox RJ, Crask MR, Jonghoon K. Mail survey response rate, a meta-analysis of selected techniques for inducing response. Public Opinion Q 1988;52:467-91.
37. Yammarino FJ, Skinner SJ, Childers TL. Understanding mailed survey response behavior, a meta-analysis. Public Opinion Q 1991;55:613-39.