HAL Id: hal-02193686
https://hal.archives-ouvertes.fr/hal-02193686
Submitted on 24 Jul 2019HAL is a multi-disciplinary open access
archive for the deposit and dissemination of sci-entific research documents, whether they are pub-lished or not. The documents may come from teaching and research institutions in France or abroad, or from public or private research centers.
L’archive ouverte pluridisciplinaire HAL, est destinée au dépôt et à la diffusion de documents scientifiques de niveau recherche, publiés ou non, émanant des établissements d’enseignement et de recherche français ou étrangers, des laboratoires publics ou privés.
actuators for flow control
Ahmad Batikh, Azeddine Kourta, Henri Boisson, Lucien Baldas, Robert
Caen, Stéphane Colin
To cite this version:
Ahmad Batikh, Azeddine Kourta, Henri Boisson, Lucien Baldas, Robert Caen, et al.. Numerical and experimental study of mini synthetic jets actuators for flow control. The second International Francophone Congress of Advanced Mechanics - IFCAM02, May 2007, Aleppo, Syria. �hal-02193686�
Numerical and experimental study of mini synthetic jets actuators
for flow control
Ahmad BATIKH1, Azeddine KOURTA2, Henri BOISSON2, Lucien BALDAS1, Robert CAEN1; Stéphane COLIN1
[email protected],[email protected],
[email protected], [email protected],
1 LGMT-INSA, 135 Avenue de Rangueil, 31077 Toulouse Cedex 4, France
[email protected], [email protected]
2 Institut de Mécanique des Fluides de Toulouse, Allée du Prof. Camille Soula, 31400 Toulouse, France
Abstract: A synthetic jet is a time-averaged fluid motion generated by sufficient strong oscillatory flow downstream
from a sudden expansion. The study of the interaction between the synthetic jet and an external flow is of great interest in particular for aeronautical applications. A network of such actuators could be used indeed on airplane wings for example to control, with a good energetic efficiency, the boundary layer separation in order to increase the lift or the laminar / turbulent transition for drag reduction. In this paper, the interaction of a sub-millimetric synthetic jet actuator with an external flow is experimentally studied. In these experiments, the actuation is ensured by acoustic excitations produced by a loud-speaker. Hot-wire anemometry is used for measurement of the velocity field in various functioning configurations (velocity of the transversal flow, actuation frequency,…). In most of the tested configurations, the boundary layer of the transversal flow is significantly modified by the synthetic jet, which shows that these types of actuators could be efficiently used for flow control purposes. A comparison with a continuous jet is finally performed.
Keywords: Synthetic jet, flow control, CFD 1. Introduction
Wall-bounded flows may be efficiently controlled by appropriately modifying the boundary layer structure. It is thus possible to reduce the drag or increase the lift of an aircraft wing, to favor mixing in a combustion chamber, to reduce the aero-acoustic noise or to improve heat transfer. The nature of perturbations that need to be introduced in the boundary layer mainly depends on the flow characteristics: Reynolds and Mach numbers, type of instabilities in the boundary layer… For high Reynolds numbers and for compressible flows, active control methods based on momentum injection in the near wall flow thanks to dynamic systems composed of sensors and actuators have proved to be more efficient that passive control devices which modify the boundary layer structure simply by changing the wall geometry (Gad-el-Hak, 1996), (Ho & Tai, 1998)
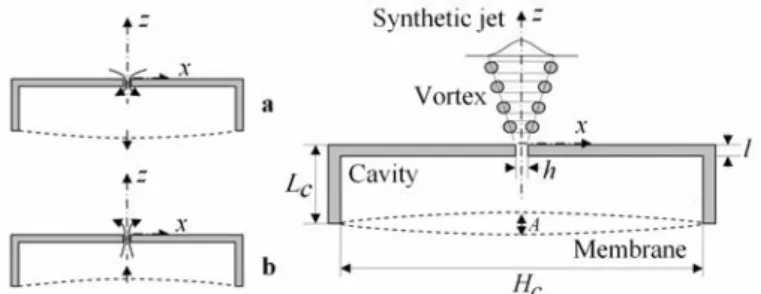
Several types of mechanical microactuators have been developed for active control applications (thermal microactuators, micro magnetic flaps, micro balloons…) (Batikh et al., 2004). However, many recent works have been devoted to fluidic solutions which have the advantage, important for reliability, to have no moving part in direct contact with the external flow and allow a simple control. Among those, the synthetic jet actuators (SJA) are composed of a cavity whose volume is modulated by a membrane itself activated by means of electrostatic or piezoelectric material, and an orifice (figure 1). When the membrane is moved, these actuators suck in, in the boundary layer, a certain amount of fluid of small momentum and reject this same amount of fluid with a larger momentum forming a vortex ring (in case of a circular orifice) or a pair of vortex (in case of a slot). If the vortices have a sufficient velocity to move outwards before the ejection of the next vortex, a train of vortices will be formed (Smith & Glezer, 1998). The created jet acts on the structures of the near wall flow and allows its control.
In order to characterize the synthetic jet behavior, several non-dimensional parameters may be considered: - the jet stroke length
(1) h dt t u h L / T/2 ( ) / 0 0 0 =
∫
permits to compare the ejection mean velocity with the actuation frequency; L0 is the distance at which a fluid element
moves away from the orifice during the ejection stage (Utturkar et al., 2003), h is the orifice diameter or the slot width,
T the actuation period and u0(t) the instantaneous velocity of jet at the center of the orifice/slot.
- viscosity effects are quantified by the Reynolds number which can be based:
o either on the average jet velocity U0 at the center of the orifice/slot during the ejection stage and on the
orifice/slot characteristic dimension h:
0 0
/
U
Re
=
U h
ν
(2)where ν is the kinematic viscosity and
0 0
/
U
=
L T
(3)o or on the average momentum I0 injected per unit width:
0 / 2 2 0
/
0 T I 0( )
Re
=
I
μ
h
=
ρ
h
∫
u t d
t
(4)For low Reynolds numbers, (typically for
0
50
U
Re
<
), the flow does not separate from the orifice/slot edge during theejection phase and the blowing and the suction phases are symmetrical. - the Stokes Number
2
/
vSt h
=
δ
=
ω
h /
ν
(5)where ω = 2π f and f is the membrane actuation frequency, compares the thickness of the unsteady boundary layer
inside the orifice/slot to the orifice/slot characteristic length. For large Stokes numbers, viscosity does not affect the jet while for low St the unsteady boundary layer may limit significantly the jet average velocity.
- St and Re can also form a Strouhal number:
2 2 0 0 0
/
2
/
2
/
/
St
h
h
h T
h
Sr
0Re
U h
U
L T
L
ω
ν ω
π
π
ν
=
=
=
=
=
(6)This Strouhal number is inversely proportional to the stroke length defined by Eq. (1). For large Strouhal numbers, it will take several cycles for a fluid element to leave the orifice region, as for low Sr the fluid will cross this zone in only one cycle.
To sum up, with a Reynolds number rather low (low velocity, small orifice/slot or high kinematic viscosity), the fluid will be strongly influenced by viscosity effects at the orifice/slot. With a rather large Strouhal number (high frequency) the fluid will not have sufficient time to leave the orifice/slot during the compression phase. To generate strong jets with high momentum, it is thus necessary to operate the jet at high Reynolds number and low Strouhal number (Wu & Breuer, 2003).
When the synthetic jet actuator is used to control a cross flow, it is also useful to define the jet momentum coefficient (Traub et al., 2002) 2 max ⎥ ⎦ ⎤ ⎢ ⎣ ⎡ = ∞ ∞ U U D h C j j ρ ρ μ (7)
which will permit to quantify the synthetic jet efficiency, i.e. its capability to modify the cross flow structure. According
to previous studies (Seifert & Pack, 1999), the jet momentum coefficient must at least be on the order of 10-3 to have a
substantial effect on the controlled cross flow. Note that this coefficient may also be defined using the root mean square of the velocity at the slot exit (Greenblatt et al., 2006).
In the first part of this paper, a sub-millimetric Synthetic Jet Actuator working in a quiescent air is numerically and experimentally characterized. The action of this actuator on a transverse wall flow is then studied experimentally. A comparison with a continuous jet in a cross flow is finally presented.
2. Numerical configuration
A 2-D configuration of SJA is simulated at a submillimetric scale. Dimensions of simulated domains (slot width h and
depth l, and cavity width Hc and depth Lc) and the amplitude A of the membrane oscillation are given in Table 1. Only
one half of the geometry is meshed using symmetry properties in order to reduce the computation time. Dimensions in µm
Orifice (h X l) 500 x 500
Cavity (Hc X Lc) 25.4 103 x 5 103
Amplitude (A) 152.4
Outer domain 5 104 x 5 104
Table 1. Dimensions and amplitude for synthetic jet layouts
Simulations are performed in double precision using the finite-volume solver FLUENT. Checking that the solution is not grid-dependent has been done. The origin of the Cartesian coordinate system is at the center of the slot exit. The outer domain boundary condition is a pressure outlet. The oscillation of the membrane is modeled as the movement of a rigid piston.
The model is solved with a 2nd order upwind discretization scheme, and the SIMPLEC algorithm is used for
pressure-velocity coupling. A laminar model and two turbulence models based on the Reynolds Average approach are tested: • the Realizable k-ε model which is more capable to accurately predict the spreading rate of both planar and
round jets than the standard or RNG models proposed in Fluent;
• the k-ω model, chosen for its ability to take into account low Reynolds number effects, compressibility effects, and shear flow spreading.
Concerning the viscous-affected near-wall region modeling, the "enhanced wall treatment" option is activated in the k-ε model leading to the complete resolution of the buffer layer and viscous sublayer through a two-layer zonal model. In the same purpose, "transitional flow" option is activated in the k-ω model.
It is verified (through the wall unit value in the wall adjacent cell) that the grid density is suited to the chosen near wall treatment.
Further details about the numerical models (grid size, time step, boundary conditions type,…) can be found in a previous paper (Batikh et al., 2006).
3. Simulation results
The unsteady simulations converge towards a periodic solution after the 10th period. All numerical data are recorded at
the 25th period. As mentioned before, the study is made with three viscous models (laminar, k-ε and k-ω turbulent
models).
Figures 2 shows the iso-contours of vorticity for the laminar, k-ω and k-ε turbulent models at t/T = 0.75 corresponding to the middle of the suction phase.
Considering the laminar simulations (figure 2-a), the formation of a train of vortices is clearly visible. Vortices are generated at the slot exit during the blowing stage and are advected along the jet axis even during the suction stage of the actuator. In the outer field, vortices break down far away from the slot, mainly by viscous dissipation effects. This flow structure is very close to the results obtained by Lee and Goldstein (Lee & Goldstein, 2002) by Direct Numerical Simulation on the same geometry.
In the k-ε turbulent simulation (figure 2-c), vortices are also generated at the slot at the beginning of the ejection phase. However, once detached from the slot they rapidly merge with the preceding pair of vortices which leads to the generation of an unique pair of vortices of higher size. Dissipation occurs quite rapidly due to turbulence and the big vortices pair remains nearly stationary during the cycle.
The k-ω turbulent simulation (figure 2-b) lead to an intermediate behavior: vortices generated at the slot exit merge with the preceding ones but only during the following cycle (figure 3-b), i.e. much less rapidly than in the k-ε case. As for the
the cycle due to the migration of the smaller vortices pairs generated at the slot.
a b c
Figure 2. Iso-contours of vorticity - t/T = 0.75. a) laminar model, b) k-ω model , c) k-ε model
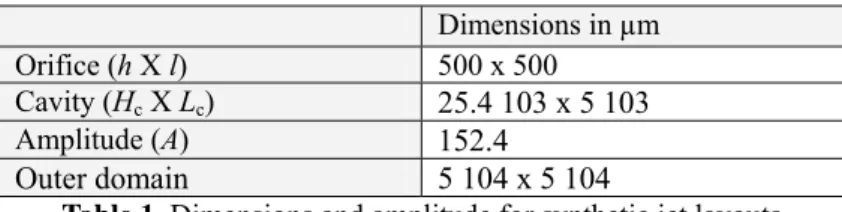
Figure 3 shows the distribution of time-average streamwise velocity for each viscous model. Data are recorded at several distances above the slot (z/h = 9.8, 13.8, 19.7 and 31.5). The spanwise x-coordinate is normalized by the local
jet half-width b(x) based on (Ucl/2) and the velocity by the local center line velocity Ucl. Note that for readability
reasons, scales in the spanwise direction are different for each model.
In the three cases classical "top-hat" profiles (Mallinson et al., 1999), (Lee & Goldstein, 2002), (Smith & Glezer, 1998)
are obtained for the mean streamwise velocity U/Ucl. However, the self-similarity of the jet is more evident for the
turbulent simulations than for the laminar ones.
-0,2 0 0,2 0,4 0,6 0,8 1 1,2 -4 -3,5 -3 -2,5 -2 -1,5 -1 -0,5 0 0,5 x/b U /U c l -0,2 0 0,2 0,4 0,6 0,8 1 1,2 -4 -3,5 -3 -2,5 -2 -1,5 -1 -0,5 0 0,5 x/b U/ Ucl -0,2 0 0,2 0,4 0,6 0,8 1 1,2 -4 -3,5 -3 -2,5 -2 -1,5 -1 -0,5 0 0,5 x/b U/ Uc l a b c
Figure 3. Mean streamwise velocities. a) laminar model, b) k-ω model , c) k-ε model : z/h = 9.8, : z/h = 13.8, c: z/h = 19.7, z : z/h = 31.5
Figure 4 shows the variation of mean streamwise velocity along the jet center-line for each viscous model. Velocity is
here normalized by the mean velocity U0 during the ejection stage and coordinates are normalized by the slot width h.
The three curves exhibit the same shape: velocity strongly increases to reach a maximum value for z/h between 3 (k-ε) and 8 (laminar). Then, it decreases in different ways. In the laminar case, the fall is not regular, revealing the existence of vortices pairs which move along the jet axis and dissipate only far away from the orifice. In the k-ω case, the velocity decrease is more rapid due to stronger dissipation. However, the presence of plateaus on the curve highlights the existence of vortices pairs along the axis which dissipate more rapidly than in the laminar case. Finally, for k-ε simulations, the velocity falls much more rapidly after the peak which occurs at z/h = 3, indicating a strong dissipation rate which causes the rapid breakdown of the vortices created at the orifice exit.
However, the chosen viscous model has a non negligible influence on the other characteristic parameters of the synthetic jet as shown in Table 2. One can note in particular that a larger Strouhal number is obtained with the k-ε model, confirming the results observed on vorticity contours: lower velocity of the generated vortex pairs leading to a weaker synthetic jet.
Case Model L0 (m) U0 (m/s) RU0 RI0 Upeak (m/s) St Sr
1 Laminar 0.01223 13.94 477.6 29910 51.12 11.08 0.2568
2 Turbulent k-ε 0.01096 12.50 428.1 23020 38.95 11.08 0.2866
3 Turbulent k-ω 0.01240 14.14 484.2 29270 49.29 11.08 0.2533
Table 2. Variables for the three viscous models
0 0,1 0,2 0,3 0,4 0,5 0,6 0,7 0,8 0,9 1 1,1 -10 -5 0 5 10 15 20 25 30 35 40 45 y / h Uc l m a x / U o z/h
Figure 4. Variation of mean streamwise velocity with distance from the slot
: Laminar model, c: K-ε model, z : K-ω model
4. Experimental setup
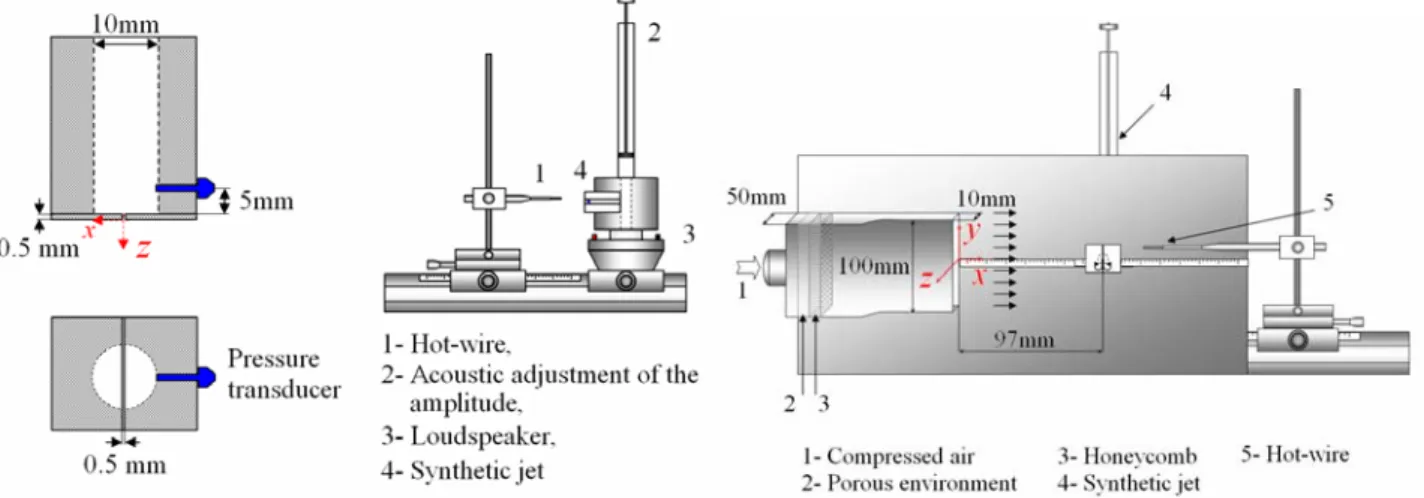
The tested experimental SJA consists in a cylindrical cavity closed on one side by a metallic plate in which a rectangular slot has been machined and connected on the other side to the exit of a pneumatic signals generator. The latter is controlled (in frequency and amplitude) by an electric signals generator (figure 5-a) associated to a variable volume chamber.
The width and the length of the slot are 500 µm and 10 mm respectively. Its thickness is 500 µm. A pressure transducer
(0.14x10⁵ Pa maximum) is located on one side of the cavity and at 5 mm from the slot.
a. Synthetic jet system without external flow b. Synthetic jet system with cross flow Figure 5. Experimental setup
In the second experimental configuration, (figure 5-b), the SJA is used to control a wall turbulent plane jet generated by a rectangular channel (10 mm height, 100 mm width) connected to a settling chamber via a converging element. A honeycomb flow straightener and a section of porous foam are installed between the chamber and the compressed air supplying pipe to ensure a low turbulence level and to produce a uniform, smooth flow. The SJA is flush mounted on
the plane plate, the slot center being at 97 mm from the channel exit (x direction) and the slot length in the same direction (noted y) than the channel width.
A single Dantec hot wire (9 µm in diameter) anemometer is used to measure the velocity. The signal of the hot wire is recorded on a computer via an acquisition card and software. The sampling rate is 10 kHz. The experimental standard deviation of the velocity measurements has been estimated, from the 4 measurements done at each probe location, to be of the order of 2.5%. It was mainly due to uncertainty in hot-wire calibration (±0.3%) and uncertainty in hot-wire probe position.
5. Characterization of the synthetic jet without external flow and comparison with numerical simulation
Experimental data are compared to the numerical ones for the following configuration: 1100 Hz actuation frequency
and 2 103 Pa pressure amplitude in the cavity. Figure 6 shows the distribution of the maximum velocity along the jet
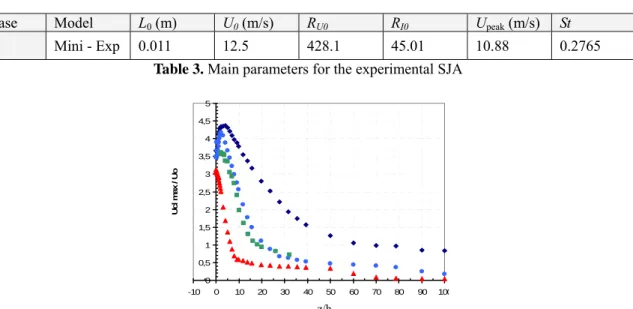
center line obtained from hot-wire measurements compared to the numerical simulations data obtained with the three viscous models. Experimental data are in good agreement with the k-ω turbulent model. The main experimental synthetic jet parameters are reported in table 3. The experimental Stokes number is very close to the one chosen for the numerical simulations, confirming that this experimental configuration can be used for the validation of the numerical models. Experimental values of Reynolds and Strouhal numbers are here closer to the numerical values obtained from the k-ε model. This trend is confirmed in figure 7 which presents the velocity magnitude distribution at z/h = 10.
Case Model L0 (m) U0 (m/s) RU0 RI0 Upeak (m/s) St
4 Mini - Exp 0.011 12.5 428.1 45.01 10.88 0.2765
Table 3. Main parameters for the experimental SJA
0 0,5 1 1,5 2 2,5 3 3,5 4 4,5 5 -10 0 10 20 30 40 50 60 70 80 90 100 y / h U c l m a x / U o
Figure 6. Distribution of maximum velocity on the jet axis – comparison between experimental and numerical data
f = 1100 Hz, h = 500 µm, A= 2 103 Pa. : Laminar model, c: K-ε model, z : K-ω model, : Experience (A=4 volts)
z/h 0 0,1 0,2 0,3 0,4 0,5 0,6 0,7 0,8 0,9 1 1,1 1,2 -30 -25 -20 -15 -10 -5 x / b U m a g / U c l 0
Figure 7. Distribution of velocity magnitude at z/h = 10 with f = 1100 Hz, h = 500µm, A= 2 103 Pa
: Laminar model, : K-ε model, c: K-ω model, z: Experience (A=4 volts)
Further experimental investigation is necessary for the validation of the numerical model. In particular, it was not possible to obtain from a single hot-wire the velocity components across the jet which would have permitted to obtain the cross-stream and stream-wise velocity profiles. PIV measurements are currently performed in order to explore the jet more in details.
6. Synthetic jet with cross flow
Measurements have been done for two values (11.5 m/s and 6.5 m/s) of the "uniform" (or freestream) velocity U∞ of the
cross flow just upstream from the SJA (x = 90 mm). The SJA is positioned at x = 97 mm (figure 5-b) and actuated at f = 200 Hz.
For each configuration, 10 time-average velocity profiles were recorded: the first one just upstream from the SJA (x = 90 mm), the second one at the position of the SJA and 8 profiles downstream from the SJA (x = 98, 99, 100, 105, 110, 115, 120 and 125mm). Table 4 summarizes the main experimental parameters of the two tested configurations.
Case U∞ (m/s) Re∞=ρ∞U∞/µ∞ Ujmax/U∞ ReU0 Cµ
5 11.5 7872 1.43 565 5.10-3
6 6.5 4450 2.5 565 0.0184
Table 4. Main parameters for the SJA with cross flow experimental configurations
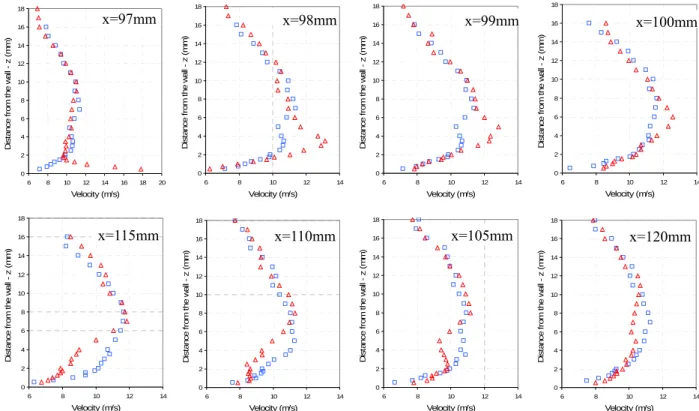
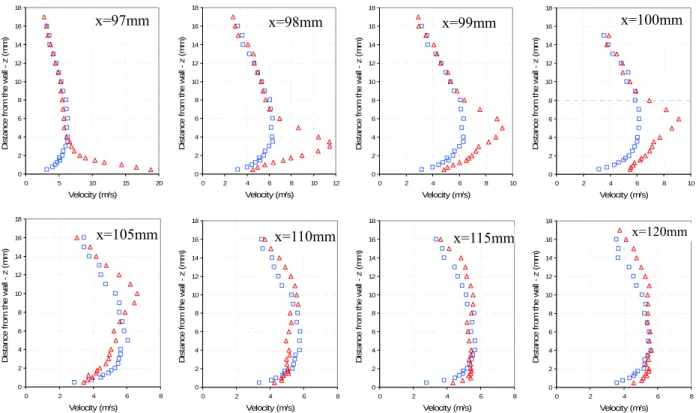
Figures 8 and 9 show the velocity profiles at each position with and without SJA actuation for cross flow "uniform" velocities of respectively 11.5 and 6.5 m/s.
0 2 4 6 8 10 12 14 16 18 6 8 10 12 14 16 18 20 Velocity (m/s) D is tanc e f rom t he w al l - z ( m m ) 0 2 4 6 8 10 12 14 16 18 6 8 10 12 14 Velocity (m/s) D is ta n c e fr o m th e w a ll z ( m m ) 0 2 4 6 8 10 12 14 16 18 6 8 10 12 14 Velocity (m/s) D is tanc e f rom t h e w al l z ( m m ) 0 2 4 6 8 10 12 14 16 18 6 8 10 12 14 Velocity (m/s) D is tanc e f rom t h e w al l z ( m m ) x=98mm x=99mm x=97mm x=100mm 0 2 4 6 8 10 12 14 16 18 6 8 10 12 14 Velocity (m/s) D is tanc e f rom t he w a ll z ( m m ) 0 2 4 6 8 10 12 14 16 18 6 8 10 12 14 Velocity (m/s) D is tanc e f rom t he w al l - z ( m m ) 0 2 4 6 8 10 12 14 16 18 6 8 10 12 14 Velocity (m/s) D is tanc e f rom t he w al l z ( m m ) 0 2 4 6 8 10 12 14 16 18 6 8 10 12 14 Velocity (m/s) D is tan c e f rom t he w al l - z ( m m ) x=115mm x=110mm x=105mm x=120mm
Figure 8. Velocity profiles with (on) and without (off) actuation of SJA – Cross flow velocity : 11.5 m/s
Δ: SJ-On, : SJ-Off
The effects of the SJA on the boundary layer of the cross flow are clearly visible on these profiles (figure 8). At the slot level, the velocity magnitude is strongly increased for z < 2 mm. This is mainly due to the vertical component of the synthetic jet velocity at the slot exit. It was not possible indeed to identify z and x components of the velocity with a single hot wire probe. Nevertheless, it can be seen that the synthetic jet is bended by the cross flow : the z position of the interaction zone is increasing, moving downstream from the SJA position up to x = 100 mm. On the following profiles, the flow velocity is reduced, mainly in the boundary layer, when the SJA is switched on. This is due to the presence of a recirculation zone created by the "right" vortices generated by the SJA and convected downstream by the cross flow. This phenomena apparition is dependent on the ratio between the synthetic jet maximum velocity at the slot exit plane and the cross flow free stream velocity. In their numerical study, Mittal (Mittal et al., 2001) have observed
this behaviour for a velocities ratio around 3 which is also the case in our configuration (Ujmax/U∞ ≈ 36 / 11.5 ≈ 3).
Finally, from x = 120 mm, the flow modifications due to the synthetic jet actuation become negligible.
Globally, the same behaviour is observed when the wall jet free stream velocity is 6.5 m/s (figure 9). However, as the momentum coefficient is more than three times higher than in the previous configuration (cf. table 4), the effects are more emphasized. The synthetic jet penetration in the cross flow is more important : the velocity profile near the wall is
strongly modified up to z = 8 mm (for x = 100 mm). On the other hand, its deviation from the vertical position is slighter.
Moreover, as the synthetic jet momentum is stronger compared to the wall jet one, the "left" vortices generated at the slot exit are here not completely cancelled by the cross flow but they induce an increase of the cross flow velocity more far away from the wall which can be observed from x = 105 mm up to x = 120 mm.
As the jet is less bended by the cross flow, the recirculation zone clearly observed in the previous configuration seems here to be much more reduced. However, as the hot-wire does not give information on the velocity direction, this analysis has to be confirmed thanks to PIV measurements currently performed on this experimental setup.
0 2 4 6 8 10 12 14 16 18 0 5 10 15 20 Velocity (m/s) D is tan c e f rom t h e w a ll z ( m m ) 0 2 4 6 8 10 12 14 16 18 0 2 4 6 8 10 12 Velocity (m/s) D is tan c e f rom t h e w a ll z ( m m ) 0 2 4 6 8 10 12 14 16 18 0 2 4 6 8 10 Velocity (m/s) D is tanc e f rom t he w al l z ( m m ) 0 2 4 6 8 10 12 14 16 18 0 2 4 6 8 10 Velocity (m/s) D is tanc e fr om t he w al l z ( m m ) x=100mm x=97mm x=98mm x=99mm 0 2 4 6 8 10 12 14 16 18 0 2 4 6 8 Velocity (m/s) D is ta nc e f rom t he w al l z ( m m ) 0 2 4 6 8 10 12 14 16 18 0 2 4 6 8 Velocity (m/s) D is tan c e f rom t h e w a ll z ( m m ) 0 2 4 6 8 10 12 14 16 18 0 2 4 6 8 Velocity (m/s) D is tan c e f rom t h e w a ll z ( m m ) 0 2 4 6 8 10 12 14 16 18 0 2 4 6 Velocity (m/s) D is tanc e f rom t he w al l z ( m m ) x=105mm x=110mm x=115mm x=120mm 8
Figure 9. Velocity profiles with and without actuation of SJA – Cross flow velocity : 6.5 m/s
Δ: SJ-On, : SJ-Off Further details about this part can be found in (Batikh et al., 2007).
7. Comparison with continuous jet
To compare the synthetic jet with a continuous one (CJ) we chose a mean blowing velocity equal to the mean velocity
of the synthetic jet at z=0.5mm (just in front of the slot). In our case (f=200 Hz, A=4 volts) the mean velocity was U0 =
16.5 m/s. We used the same experimental setup for the generation of the cross flow.
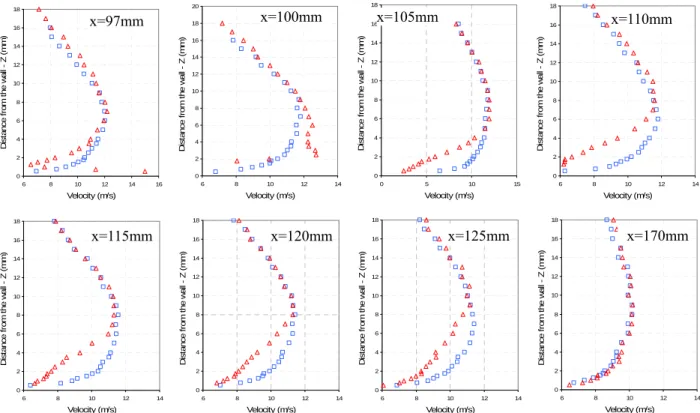
Figures 10 and 11 show the velocity profiles at each position with and without CJ actuation for cross flow "uniform" velocities of respectively 11.5 and 6.5 m/s.
We can notice that the velocity decreases in the zone close to the wall (until z=8mm). This reduction is due to the formation of a considerable recirculation zone generated by the CJ. Downstream from this recirculation zone (at x=170mm), the 2 profiles (Jet-On, and Jet-Off) are identical showing that the boundary layer structure has not been
strongly modified by the CJ. We see the same behaviour on profiles with U∞=6.5 m/s but the change is stronger. The
main difference between the two types of jet (SJ and CJ) is that the SJ modifies the boundary layer in the zone far downstream from its position (added momentum to the boundary layer).
0 2 4 6 8 10 12 14 16 18 6 8 10 12 14 16 Velocity (m/s) D is tanc e f rom t he w al l Z ( m m ) 0 2 4 6 8 10 12 14 16 18 20 6 8 10 12 14 Velocity (m/s) D is tanc e f rom t h e w al l Z ( m m ) 0 2 4 6 8 10 12 14 16 18 0 5 10 15 Velocity (m/s) D is tanc e f rom t he w al l Z ( m m ) 0 2 4 6 8 10 12 14 16 18 6 8 10 12 14 Velocity (m/s) D is ta n c e fr o m th e w a ll Z ( m m ) x=100mm x=105mm x=110mm x=97mm 0 2 4 6 8 10 12 14 16 18 6 8 10 12 14 Velocity (m/s) D is ta nc e f rom t he w a ll Z ( m m ) 0 2 4 6 8 10 12 14 16 18 6 8 10 12 14 Velocity (m/s) D is tan c e f rom t he w al l Z ( m m ) 0 2 4 6 8 10 12 14 16 18 6 8 10 12 14 Velocity (m/s) D is tanc e f rom t h e w al l Z ( m m ) 0 2 4 6 8 10 12 14 16 18 6 8 10 12 1 Velocity (m/s) D is tan c e f rom t he w al l Z ( m m ) x=170mm x=125mm x=115mm x=120mm 4
Figure 10. Velocity profiles with and without actuation of CJ – Cross flow velocity : 11.5 m/s
Δ: CJ-On, : CJ-Off 0 2 4 6 8 10 12 14 16 18 0 5 10 15 20 Velocity (m/s) D is ta n c e fr o m th e w a ll Z ( m m ) 0 2 4 6 8 10 12 14 16 18 0 2 4 6 8 10 Velocity (m/s) D is ta n c e fr o m th e w a ll Z ( m m ) 0 2 4 6 8 10 12 14 16 18 0 2 4 6 8 Velocity (m/s) D is tanc e f ro m t h e w a ll Z ( m m ) 0 2 4 6 8 10 12 14 16 18 0 2 4 6 Velocity (m/s) D is ta n c e fr o m th e w a ll Z ( m m ) x=105mm x=100mm x=97mm x=110mm 8 0 2 4 6 8 10 12 14 16 18 0 2 4 6 8 Velocity V (m/s) D is ta n c e fr o m th e w a ll Z ( m m ) 0 2 4 6 8 10 12 14 16 18 0 2 4 6 8 Velocity (m/s) D is tan c e f rom t he w al l Z ( m m ) 0 2 4 6 8 10 12 14 16 18 0 2 4 6 8 Velocity (m/s) D is ta n c e fr o m th e w a ll Z ( m m ) 0 2 4 6 8 10 12 14 16 18 0 1 2 3 4 5 6 Velocity (m/s) D is ta n c e fr o m th e w a ll Z ( m m ) x=120mm x=115mm x=125mm x=170mm
Figure 11. Velocity profiles with and without actuation of CJ – Cross flow velocity: 6.5 m/s
Δ: CJ-On, : CJ-Off
8. Conclusion
The flow produced by a mini synthetic jet actuator has been examined performing 2D simulations with three viscous models: laminar, k-ε and k-ω turbulent models. The ability to predict the vortex generation at the slot exit has been
shown to be highly dependant on the chosen model.
Experiments have been carried out, using hot-wire anemometry, for validation of the numerical models. Good agreement was found between experimental streamwise velocity on jet axis and k-ω numerical model results. However,
the flow characteristic parameters (ReU0, U0, L0, Sr) obtained from experiments were closer to the k-ε numerical ones.
Further experimental investigations are in progress, in particular PIV measurements which would permit to get all the components of the velocity vectors.
Experimental characterization of a Synthetic Jet Actuator in a cross wall jet flow has been performed for two free stream velocities of the cross flow, using hot-wire anemometry. The effect of the synthetic jet is clearly visible on the velocity profiles downstream from the slot and all the more pronounced that the velocity ratio and the jet momentum coefficient are important.
A comparison with a continuous jet has been performed. The CJ modifies the velocity profiles but in a different way from the SJ. By adding more momentum in the boundary layer, the SJ permits to obtain increases in the velocity in the boundary layer far downstream from the actuators, which is not the case the CJ. This effect is particularly interesting with a view to delaying boundary layer separation.
References
Batikh, A., Baldas, L., Caen, R. & Colin, S., 2004. Contrôle actif en aérodynamique au moyen de Micro actionneurs
fluidiques. P 10. In: SHF (ed.) 2ème Congrès Français de Microfluidique - Microfluidique 2004 (µFlu’04), Toulouse - France.
Batikh, A., Baldas, L., Caen, R., Colin, S., KOURTA, A. & Boisson, H.-C., 2007. Behavior of a mini synthetic jet in
a transverse wall flow: experimental and numerical study. P 10. In: ASME (ed.) Accepted paper at : 5th International
Conference on Nanochannels, Microchannels and Minichannels (ASME ICNMM2007), Puebla, Mexico.
Batikh, A., Caen, R., Colin, S., Baldas, L., Kourta, A. & Boisson, H.-C., 2006. Numerical and experimental study of
micro synthetic jets for flow control. In: SHF (ed.) 3rd Microfluidics French Conference - Microfluidics 2006 (µFlu’06), Toulouse - France.
Gad-el-Hak, M., 1996. Modern developments in flow control, Applied Mechanical Review. 49: pp.365-379.
Greenblatt, D., Paschal K., B., Yao, C.-S. & Harris, J., 2006. Experimental Investigation of Separation Control Part
2: Zero Mass-Flux Oscillatory Blowing. AIAA Journal 44(12).
Ho, C.-M. & Tai, Y.-C., 1998. Microelectromechanical systems (MEMS) and fluid flows. Ann. Rev. Fluid Mech 30:
579-612.
Lee, C.Y. & Goldstein, D.B., 2002. Two-dimensional synthetic jet simulation. AIAA Journal 40(3).
Mallinson, S.G., Reizes, J.A., Hong, G. & Buttini, M., 1999. Synthetic jet actuators for flow control. Proceedings of
the SPIE Asia/Pacific Symposium on Microelectronics and MEMS, Gold Coast, Australia.
Mittal, R., Rampunggoon, P. & Udaykumar, H.S., 2001. Interaction of a synthetic jet with a flat plate boundary layer.
31st AIAA Fluid Dynamics Conference and Exhibit AIAA-2001-2773, Anaheim, CA, .
Seifert, A. & Pack, L., 1999. Oscillatory Control of Separation at High Reynolds Numbers. AIAA Journal 37(9):
1062-1071.
Smith, B.L. & Glezer, A., 1998. The formation and evolution of synthetic jets. Physics of fluids 10(9): 2281-2297. Traub, L.W., Gilarranz, J.L. & Rediniotis, O.K., 2002. Delta wing hingeless control via synthetic jet Actuation. 40th
AIAA Aerospace Sciences Meeting and Exhibit AIAA-2002-0415, Reno, NV.
Utturkar, Y., Holman, R., Mittal, R., Carroll, B., Sheplak, M. & Cattafesta, L., 2003. A jet formation criterion for
synthetic jet actuators. 41st Aerospace Sciences Meeting and Exhibit 2003-0636, Reno, Nevada.
Wu, K.E. & Breuer, K.S., 2003. Dynamics of Synthetic Jet Actuator Arrays for Flow Control. 33rd AIAA Fluid
Nomenclature
Symbol Description Unit
b Local half width of the jet (based on half local central velocity) m
Cµ Momentum coefficient 2 ⎥ ⎦ ⎤ ⎢ ⎣ ⎡ = ∞ ∞ U U D h C j j ρ ρ μ -
f Membrane actuation frequency Hz
h Slot width m
HC Cavity width m
I0 Average momentum injected per unit width during the ejection stage (I h T/2u (t)dt)
0 2 0 0=ρ
∫
Kg.s -1 l Slot height mL0 Jet "stroke length" (L u t dt)
T ) ( 2 / 0 0 0=
∫
m LC Cavity height m ReIoReynolds Number based on I0. (
µh dt t u h T Io ) ( Re 2 / 0 2 0
∫
= ρ ) -ReUo Reynolds Number based on the mean jet velocity and the slot width
(ReUo=U0h/ν =ρU0h/μ )
-
s Orifice outlet area m2
Sr Strouhal Number (Sr=St2/ReUo) -
St Stokes Number (St= 2π f h2/ν ) -
T Actuation period (T=1/f ) s
U∞ Freestream velocity m.s-1
U0 Time-averaged velocity at the orifice center during the ejection stage (U0=L0/T) m.s-1
u0(t) Instantaneous velocity at slot center m.s-1
ucl Time-averaged velocity on the jet centerline m.s-1
ucl max Maximum velocity on the jet centerline m.s-1
u Time-averaged local velocity m.s-1
max
j
U Maximum velocity at the orifice center m.s-1
µ Dynamic viscosity Kg.m-1.s-1
ν Kinematic viscosity m2.s-1