Publisher’s version / Version de l'éditeur:
Vous avez des questions? Nous pouvons vous aider. Pour communiquer directement avec un auteur, consultez la
première page de la revue dans laquelle son article a été publié afin de trouver ses coordonnées. Si vous n’arrivez pas à les repérer, communiquez avec nous à PublicationsArchive-ArchivesPublications@nrc-cnrc.gc.ca.
Questions? Contact the NRC Publications Archive team at
PublicationsArchive-ArchivesPublications@nrc-cnrc.gc.ca. If you wish to email the authors directly, please see the first page of the publication for their contact information.
https://publications-cnrc.canada.ca/fra/droits
L’accès à ce site Web et l’utilisation de son contenu sont assujettis aux conditions présentées dans le site LISEZ CES CONDITIONS ATTENTIVEMENT AVANT D’UTILISER CE SITE WEB.
2nd International Building Physics Conference, pp. 379-388, 2003-09-01
READ THESE TERMS AND CONDITIONS CAREFULLY BEFORE USING THIS WEBSITE.
https://nrc-publications.canada.ca/eng/copyright
NRC Publications Archive Record / Notice des Archives des publications du CNRC :
https://nrc-publications.canada.ca/eng/view/object/?id=c5b5884d-4681-473a-ba5e-48c3772952af https://publications-cnrc.canada.ca/fra/voir/objet/?id=c5b5884d-4681-473a-ba5e-48c3772952af
NRC Publications Archive
Archives des publications du CNRC
This publication could be one of several versions: author’s original, accepted manuscript or the publisher’s version. / La version de cette publication peut être l’une des suivantes : la version prépublication de l’auteur, la version acceptée du manuscrit ou la version de l’éditeur.
Access and use of this website and the material on it are subject to the Terms and Conditions set forth at Envelope air pressure design load: an approach for hygrothermal analysis of retrofitted high-rise masonry wall assemblies
Envelope air pressure design load: an approach for hygrothermal analysis of retrofitted high-rise masonry wall assemblies
Djebbar, R.; van Reenen, D.; Kumaran, K.; Ruan, H.
NRCC-46111
A version of this document is published in / Une version de ce document se trouve dans: Research in Building Physics, Leuven, Belgium, Sept. 14-18, 2003, pp. 379-388
1 I INTRODUCTION
A review of literature has shown that there is still no standard available on what design loads to use for hygrothermal analysis of building envelope per-formance in general and high-rise building envelope in particular. No consensus among the scientific community has yet been reached on how to impose both the hygrothermal and envelope air-pressure dif-ferential design loads on the interior and exterior boundary conditions of building envelopes for either low or high-rise buildings. A method to obtain both indoor and outdoor moisture reference years was developed and implemented in WeatherSmart-1.0 presented in Djebbar et al. (2001a,b).
Another important moisture source in both high and low-rise buildings is the moisture that is carried in and out the envelopes due to air-leakage through cracks and openings as a result of the air-pressure differential across the envelope. Predicting the en-velope air-pressure differential due to the combined effects of wind, stack and mechanical ventilation is still a tedious task. One objective of the research project in which WeatherSmart was further refined was to develop an analytical approach for the enve-lope’s air pressure differential design load that ap-plies to high-rise moisture calculations. The model
from this approach will then be implemented in IRC’s weather analysis tool WeatherSmart as illus-trated in Figure 1 and thereafter used to obtain the envelope air-pressure differential boundary condi-tions in hygIRC format for parametric analysis. A description of hygIRC, an advanced HAM model, may be found in Djebbar et al (2002a,b).
WYEC (NIST)
WYEC2
(CWEEDS/CWEC/ASHRAE)
Outdoor MoistureReferenceYear
Indoor MoistureReferenceYear Weather Analysis
CanadianClimatological Data
(Rainfall)
Commercial Weather Data Files
Boundary Conditions for HAM Calculations
Envelope Air-pressureDifferential
Figure 1. WeatherSmart 1.1 flow chart
Documentation explaining how other existing HAM models handle the envelope air-pressure boundary conditions when air-leakage is considered in the hygrothermal analysis and design of building envelopes is very limited. On the other hand, most of the data available in literature on envelope’s air-pressure is derived from analyses that were oriented mainly for either structural design of building enve-lopes or for quantifying air infiltration and ventila-tion in indoor spaces for IAQ and energy design of buildings. Therefore, several assumptions relevant to
Envelope Air Pressure Design Load: An Approach for Hygrothermal
Analysis of Retrofitted High-Rise Masonry Wall Assemblies
R. Djebbar, D. van Reenen & M. K. Kumaran
Institute For Research in Construction – National Research Council, Ottawa, Ontario, Canada
H. Ruan
University of Ottawa – Department of Computer Science, Ottawa, Ontario, Canada
ABSTRACT: This paper presents the analytical approach to predict envelope air-pressure differential that was newly implemented into IRC’s computer weather analysis tool for hygrothermal calculations
WeatherSmart-1.1. In addition to its original features, this tool now allows obtaining in a user-friendly way
yearly profiles of hourly envelope air-pressure differential for both low and high-rise buildings. Hourly en-velope air-pressure profiles are derived from the knowledge of both indoor and outdoor hygrothermal design loads. WeatherSmart-1.1 is being used within the frame work of a research project to assess effects of adding supplementary insulation and air-sealing retrofit on the long-term hygrothermal performance of different wall types used in Canadian high-rise buildings. Within the frame work of this research project, the paper also in-troduces how effects of moist air infiltration and exfiltration across tall building envelopes are assessed using IRC’s advanced HAM model hygIRC.
the hygrothermal analysis of high-rise building en-velopes were adopted when the air-pressure design load computer module was added in WeatherSmart. The main assumptions are discussed in this paper.
This paper first introduces how air-leakage within porous building envelopes is modeled in hygIRC. Thereafter, follows a description of the model adopted to calculate the outdoor-induced envelope air-pressure differential due to wind loads. Finally, the approach adopted to predict indoor-induced en-velope air-pressure differential is presented.
2 MODELING AIR MASS TRANSPORT WITHIN BUILDING ENVELOPES
Three main steps are systematically performed when using hygIRC for assessing the effects of air leakage on the hygrothermal performance of high-rise building envelopes. The first step consists of im-posing the design load in terms of hourly envelope air-pressure differential. The second consists of se-lecting, depending on the problem at hand, an air-leakage path and deficiency where the moist air will flow inside the envelope. This is required to address the fact that every high-rise envelope will most probably experience air leakage during its service life due to existing imperfections in the wall assem-blies. The third step consists of imposing an air per-meability characteristic for the region where the air-leakage path is simulated. The value of the pre-scribed air permeability corresponds to the simulated level of envelope airtightness.
2.1 Air flow governing equations
Airflow mass transport in building envelopes calcu-lated using hygIRC is performed by solving a subset of Navier-Stokes equations. The rates of air mass transport through existing cracks, joints and defi-ciencies derived from Equations 1 within envelopes are mainly due to the pressure gradients across the crack and the building envelope as a whole,
a P
∇ .
Field velocities are derived by using a steady state approach that assumes creeping (Stokes) flow and accounts for gravity and Darcy’s air viscous term. Air velocities are derived directly from Equations 2 knowing the pressure drop across the building en-velope and hence across the considered crack or opening where air-leakage is simulated, ∇Pa. The envelope’s total air-pressure differential is estimated in WeatherSmart using Equation 3. This approach of solving for air-mass transport is similar with what was suggested in the IEA Annex 24, Hens (1996). Once the air mass flow rates are determined, the
amounts of moisture and heat that are convected by the airflow in different parts of the envelope are cal-culated using the moisture mass and energy balance equations that are described in Karagiozis (1997a,b) and Djebbar et al (2002a,b).
( )
(
V)
0 . = ∇ ña T a r (1)( )
( )
T(
Pa ñag)
a ì u a k a V r r + ∇ − = (2) where: a k air permeability (m2) aP air pressure (Pa)
a
ñ air partial density (kg/m3)
a
ì air dynamic viscosity (Pa s)
Gravity and air dynamic viscosity are given as input in the model. Air-permeability,
a
k , is taken from
IRC’s materials hygrothermal properties database for each of the building envelope component con-sidered.
The total envelope air-pressure differential across high-rise envelopes is mainly due to the combined effect of wind and indoor air induced pressure. The indoor induced air-pressure differential is in turn a result of the combination of stack effect and the op-eration of mechanical ventilation. The total envelope air-pressure differential, a P ∇ ∇ , is estimated by Equation 3. indoor P wind P in a P -out a P a P == ==∆∆ ++∆∆ ∆ ∆ (3) With in a
P indoor air pressure (Pa) out
a
P outdoor air pressure (Pa)
a P
∆
∆ total pressure difference between across the envelope (Pa)
wind P
∆
∆ wind induced pressure difference across the envelope(Pa)
indoor P
∆
∆ indoor-air induced pressure difference across the envelope(Pa)
In the following sections, the main factors affecting an envelope’s air-pressure conditions that are ac-counted for in the newly upgraded version of WeatherSmart are presented. The calculated hourly total air-pressure differential across the envelope are included in the indoor moisture reference input files. Indoor input files include now indoor temperature and relative humidity as well as the envelope total air-pressure differential.
2.2 Input for Air-leakage Analysis
Air-leakage is a reality in all high-rise buildings. Moisture can be carried in and out of the walls due to indoor air exfiltration or outdoor air infiltration depending on the envelope air-pressure differential gradients. An air-leakage path linking the indoor air and outdoor is assumed in each of the wall assem-blies.
A schematic drawing describing the simulated air-leakage path in two example of wall assemblies that are currently addressed in on-going research project, brick veneer with steel studs (BV/SS) base case wall and one of its interior envelope retrofit option, is shown in Figures 2a and 2b.
Figure 2a: Air leakage design path for BV/SS base case wall assembly
Figure 2b: Air leakage design path for BV/SS retrofitted wall assembly
The walls are simulated with an air leakage path having a 3mm crack opening (for both base case and retrofitted walls) in the bottom interior and top exte-rior that links the inteexte-rior and exteexte-rior environments. The air-leakage paths are selected to maximize the moisture load inside the wall that may occur from wall deficiencies implying air movement from the surrounding environments. The longest possible air-flow path with the greatest opportunity for conden-sation according to Ojanen & Kumaran (1996) are therefore assumed when assessing effects of air-leakage.
The air-permeability of the air-leakage path for each base case and retrofitted wall assembly was calculated according to the typical air-tightness of walls. To asses energy and moisture performance of different retrofit options, the air-tightness of all of
the base case walls is assumed to be equal to 2.5 L/s m2 at 75 Pascal. This value of air-tightness is consistent with what is reported by Proskiw & Phil-lips (2001) for tall residential and office buildings. Another assumption that is made for the parametric analysis is the airtightness of the retrofit option walls. A 40% airtightness increase is assumed when the base walls are either air-sealed or have under-gone an interior or exterior envelope retrofit action. All of the retrofit wall options are assumed having an air-tightness of 1.5 L/s m2 at 75 Pascal. This air-tightness increase is consistent with what is reported in the literature. Measurements performed by Shaw & Reardon (1995) on several tall Canadian of-fice buildings show that a typical airtightness in-crease of 43% at 50 Pascal was achieved after the building’s envelope was retrofitted.
3 WIND INDUCED ENVELOPE AIR PRESSURE DIFFERENTIAL
The wind induced envelope air-pressure differential,
wind P
∆
∆ , is the result of the wind pressure on exter-nal surfaces and the wind effect on the indoor air pressures. The current version of hygIRC was up-graded to account for the wind effect on the indoor air pressure. The total wind induced envelope pres-sure difference across the envelope is estimated us-ing Equation 4: 2 2 a V out a ñ pi C -p C wind P == ∆ ∆ (4) p
C external wind pressure coefficient (-)
pi
C internal wind-induced pressure coefficient(-)
a
V wind speed at the height considered (m/s)
out a
ñ Outdoor air density (kg/m 3
)
3.1 Wind exterior air-pressure coefficients
An extensive literature describing how to predict the external pressure coefficients,
p
C , is available.
Most of the published data are related to structural analysis of the building envelope and are mainly de-rived from wind tunnel simulations. However a few field measurements have also provided data and more recently from CFD analysis, information has also been obtained. Values of the external wind pressure coefficients are building specific. They de-pend mainly on building shape, wind direction, building exposure due to nearby obstructions, vege-tation and a building’s terrain features. Most of the
relevant data found in the literature on these coeffi-cients are derived from rectangular buildings. They are mainly reported in terms of surface averaged
p
C ’s for four wind-orientations relative to the
building facades for all of the windward, leeward and the two side facades. For the purpose of hy-grothermal analysis rectangular buildings are as-sumed in WeatherSmart.
Two categories of buildings are to be considered when estimating the external wind pressure coeffi-cients: low and high-rise buildings. Several authors have reported small errors in estimating wind in-duced air-leakage rates in low-rise buildings when using surface averaged
p
C ’s rather than local ones.
5% was reported by Swami & Chandra (1987-1988) and 10% by Wiren (1985). On other hand, wind pressures in high-rise buildings largely vary over the building height and the location of the envelope be-ing considered on a given buildbe-ing facade. Surface averaged
p
C ’s may induce a significant error in
es-timating the amount of air-leakage in tall buildings especially for those portions of envelope located at the corners.
WeatherSmart-1.1 adopts a curve fit model, re-sulting from an ASHRAE research project, as sug-gested by Swami & Chandra (1987), to predict the local external pressure coefficients of rectangular tall buildings is in. The model was derived from data obtained from wind tunnel simulations performed by Akins et al (1976-1979) on a few tall buildings having different building side and aspect ratios. The model predicts local
p
C ’s as a function of the wind
to the envelope angle, building side and aspect ra-tios, and the location of the envelope on the building surface. An example of local
p
C ’s obtained using
Swami & Chandra model is given in Figure 3. This example is for a 10-storey building with side and as-pect ratios that are equal, i.e., a cubic building. The envelopes considered are all located at the corner of the building façade.
A harmonic trigonometric function developed by Walker and Wilson (1994) is also implemented in WeatherSmart-1.1 to predict surface averaged exte-rior wind pressure coefficients,
p
C , for both low and high-rise buildings, as described in Figure 4. Values of the four
p
C s used for tall buildings are
those suggested in Part 4 of the 1995 Canadian Na-tional Building Code (NBC) for flat roofed isolated and rectangular tall buildings. The values of the four
p
C s used for low-rise buildings correspond to
sin-gle-detached rectangular buildings suggested by Walker & Wilson (1994). This function requires knowledge of the surface averaged external wind pressure coefficients for four wind-orientations, windward, leeward and the two side walls as de-scribed in the Appendix.
-2.0 -1.5 -1.0 -0.5 0.0 0.5 1.0 1.5 0 45 90 135 180 225 270 315 360
Wind direction (degrees)
Local CP (-)
Top Corner Mid-height Corner Ground Level Corner
Figure 3: Local external wind pressure coefficients for three envelope elevations -1.0 -0.8 -0.6 -0.4 -0.2 0.0 0.2 0.4 0.6 0.8 1.0 0 45 90 135 180 225 270 315 360
Wind direction (degrees)
Surface averaged Cp (-)
High-Rise Building Low-Rise Building
Figure 4: Surface averaged external wind pressure coefficients for low and tall buildings
3.2 Wind induced indoor air-pressure
Wind effects on the indoor air pressure is mainly depending on the envelope air-tightness and nature of the distribution of openings in the building. De-fault value assumed in WeatherSmart for internal wind induced pressure coefficient
pi
C in high-rise building is equal to - 0.26. This value, suggested by Kato et al (1997), is a result of a full-scale meas-urement of wind-induced internal pressures in a 29-story building. The authors confirmed that this value of
pi
C was found constant over the building’s height. This value is at a mid-range between
3 . 0 −− == pi
C that is suggested in Part 4 of the 1995 NBC, and
pi
airflow around buildings of the 2001 ASHRAE Handbook of Fundamentals for openings uniformly distributed in all four walls of the building.
3.3 Wind speed at a specific height
Several models are available on how to predict the effective wind speed at a particular height. The wind speed,
a
V , at the envelope height considered, H, is
calculated in WeatherSmart according to Equation 5 as suggested in Part 4 of the 1995 NBC.
(( ))
H H a V e C 10 V == (5) with b c Z H a H == e C where 10V reference wind speed determined at a height of 10m above ground in a open ex-posure terrain (measured at the nearby meteorological weather stations) (m/s)
H
e
C exposure factor reflecting changes in wind speed and height, and also effects of variations in the surrounding terrain and topography (non-dimensional)
H height above ground in (m)
c Z , a
and b
three constant values depending on the nature of the building wind exposure
Buildings, both commercial and residential, are as-sumed to be located in suburban and urban areas in centers of large towns. Therefore, the mid-range values of the exposure factor coefficients suggested in Part 4 of the 1995 NBC for
c
Z , a and b are
as-sumed as default. Other exposure options for build-ings are also implemented in WeatherSmart for which the values of
c
Z , a and b are provided.
4 INDOOR ENVIRONMENT INDUCED
ENVELOPE AIR PRESSURE DIFFERENTIAL
There are mainly two categories of buildings one can consider when estimating the indoor-induced envelope air-pressure differential for the purpose of carrying out long-term hygrothermal calculations. The first category of buildings are those where the indoor air pressure is continuously managed. The indoor-induced envelope air pressure differential can be set equal to the known operating pressure drop
for these buildings. In the second category of build-ings, the indoor-air pressure difference is not ma n-aged and is a function of the outdoor weather, air-tightness of exterior building envelope and the dif-ferent interior airflow resistances. These later type of building, most probably, constitute the majority of existing tall buildings.
In buildings where indoor air-pressure is not ma n-aged, the indoor induced air pressure difference across the envelope,
indoor P
∆
∆ , is a result of both the stack effect that is significant in tall buildings lo-cated in cold climates, and also to the mechanical ventilation.
Two main effects that the mechanical ventilation has on the hygrothermal performance of envelopes are accounted for in WeatherSmart. First, mechani-cal ventilation influences the levels of indoor air humidity. This aspect was addressed in the previous version of WeatherSmart-1.0, see Djebbar et al (2001a,b). Secondly, mechanical ven-tilation introduces a pressure difference across the building envelope,
mv P
∆
∆ . This later effect is ad-dressed in WeatherSmart-1.1 and is discussed in the following section.
It is extremely difficult to quantify the envelope’s indoor air pressure differential over a long period of time due to mechanical ventilation in isolation of the two other factors affecting air pressure difference, which are due to the wind and stack effects. Actu-ally, very little data exist where typical pressure dif-ferences due to only mechanical ventilation are re-ported in the literature. One of the objectives in developing WeatherSmart was to be able to assess the effect of mechanical ventilation on the long-term hygrothermal performance of different wall assem-blies. An alternative approach is to separate the ef-fects of stack pressure from the mechanically in-duced pressure. The indoor-inin-duced air pressure difference,
indoor P
∆
∆ , may be estimated by super-imposing the stack and the mechanical ventilation effects as shown in Equation 6.
mv P stack P indoor P ==∆∆ ++∆∆ ∆ ∆ (6) Where stack P ∆
∆ pressure drop across the envelope due to the stack effect (Pa)
mv P
∆
∆ indoor induced pressure drop across the envelope in the absence of outdoor wind and stack effects (due to mechanical ven-tilation) (Pa)
How the two envelop air-pressure differential components stack P ∆ ∆ and mv P ∆ ∆ are modeled in WatherSmart-1.1 is discussed in the following sec-tions.
4.1 Envelope air-pressure differential due to stack
effect
For long-term hygrothermal analysis, stack effect is a major component in the driving forces inducing air-leakage through building envelopes as illustrated in Figures 5a to 5c. Stack pressure across envelopes exists as long as there is always a temperature and humidity gradient between indoor and outdoor envi-ronment. Stack air-pressure differential in tall buildings at a specific height depends mainly on: (i) the difference between indoor and outdoor air-density due to air temperature gradients; (ii) distri-bution of the openings and cracks on the building facades, and (iii) on the airflow resistance of the ex-terior walls relative to the airflow resistance between floors, i.e. interior and exterior air-tightness of the building considered. A simple formula , Equation 7, suggested by Tamura & Wilson (1966-1967a) and one that is now recommended in Chapter 26 on ven-tilation and infiltration of the 2001 ASHRAE Hand-book of fundaments is used in WeatherSmart-1.1 to predict envelope air-pressure differential due to stack effect. s P stack P == ∆∆ ∆ ∆ γ (7) with
((
H Hn))
in a ñ out a ñ g s P ==−− −− −− ∆ ∆ where stack P ∆∆ actual pressure difference due to the gradi-ent of outdoor and indoor air temperatures
s P
∆
∆ theoretical maximum pressure difference due to the gradient of outdoor and indoor air temperatures for buildings with no in-ternal partitions or negligible inin-ternal air-flow resistance
γ ratio of the actual stack pressure to the theoretical maximum stack pressure. Also called thermal draft coefficient due to inter-floors airflow resistance
H elevation of the wall considered (m)
n
H elevation of the neutral pressure level (m)
in a
ñ indoor moist air density (kg/m 3
)
out a
ñ outdoor moist air density (kg/m 3 ) -50 0 50 100 0 2190 4380 6570 8760 Time (Hours)
Envelope air-pressure differential
(Pascals)
Wind Pressure
Mechanical Pressure
Figure 5a. Components of the total envelope air-pressure ferential. Model of a design load for envelope air-pressure dif-ferential. The envelope is oriented east and is located at the top corner of a 10-storey residential building in Toronto. 0.35 ACH supply type of mechanical ventilation is assumed.
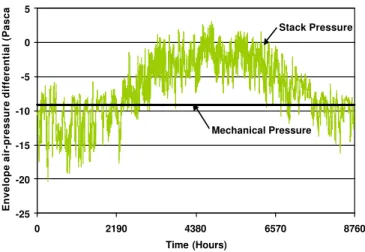
-25 -20 -15 -10 -5 0 5 0 2190 4380 6570 8760 Time (Hours)
Envelope air-pressure differential (Pascals)
Stack Pressure
Mechanical Pressure
Figure 5b. Components of the total envelope air-pressure ferential. Model of a design load for envelope air-pressure dif-ferential. The envelope is oriented east and is located at the top corner of a 10-storey residential building in Toronto. 0.35 ACH supply type of mechanical ventilation is assumed.
-80 -60 -40 -20 0 20 40 60 80 0 2190 4380 6570 8760 Time (Hours)
Envelope air-pressure differential
(Pascals)
Figure 5c. Total envelope air pressure differential. Model of a design load for envelope air-pressure differential. The envelope is oriented east and is located at the top corner of a 10-storey residential building in Toronto. 0.35 ACH supply type of me-chanical ventilation is assumed.
Outdoor and indoor air densities
out ñ and
in ñ are
functions of local barometric pressure, temperature and humidity ratio. They are calculated assuming ideal gas law relationships, as described in Equa-tion 8. The outdoor and indoor absolute
tempera-tures,
out T and
in
T , and the relative humidity
out
φ and
in
φ used to estimate the moist air densities are obtained from the indoor and outdoor environ-ment condition input files, i.e., the indoor and out-door moisture reference years, see Figure 1.
((
W))
ñ ++ == 1 1 ν (8) with p 28.964 W T R (1++1.6078 ) == ν == w p -p w p W 0.62198 ; p T, s w, p w p == φ whereν moist air specific volume (m3/ kg (dry air))
W humidity ratio/ moisture content kg (water vapour)/kg (dry air)
p total moist air mixture barometric pressure
(Pa)
w
p partial pressure of water vapour (Pa)
s w,
p partial pressure of water vapour at saturation (Pa)
R universal gas constant for dry air (8.314 J/ mol K)
φ relative humidity (-)
T absolute indoor or outdoor (K)
The water vapour pressure at saturation, pw,s, is calculated according to the correlation in Chapter 6 of the 1997 ASHRAE Handbook of Fundamentals on Psychrometrics. The indoor and outdoor absolute temperatures
out T and
in
T are also used to estimate
s w,
p .
The neutral pressure level,
n
H , is the elevation at
which inside and outside pressures across the enve-lope are equal. Location of
n
H is specific to each
building depending on the opening distribution on the whole building facades and building internal compartimentation. Measurements reported by Ta-mura & Wilson (1966-1967a) on a few tall buildings indicated that the neutral pressure elevation level ranged from 0.3 to 0.7 of total building height. Therefore, the neutral pressure level is assumed per default in WeatherSmart to be at mid-height of buildings.
The thermal draft coefficient, γ, represents the ratio of actual to theoretical pressure difference. Actual pressure difference depends on the resis-tances to flow of both exterior and interior separa-tions, such as partisepara-tions, floor constructions and walls and shafts. Values of γ are also building
spe-cific. Tamura & Wilson (1967) reported that these ratios ranged between 0.82 to 0.91 when the ventila-tion system was turned off, and for the same build-ings γ ranged between 0.63 to 0.82 when the venti-lation system was operating. As when, there was a good equilibrium between exhaust and supply ven-tilation. When calculating the envelope total air-pressure differential γis assumed equal to 0.86 per default when mechanical ventilation is not consid-ered and 0.72 when mechanical ventilation is ac-counted for.
Using these assumptions an example of a yearly profile of hourly envelope air-pressure differential calculated with WeatherSmart-1.1 for Toronto Moisture reference year 1972 (Djebbar et al 2001b) is given in Figures 5a-5c. For this example the me-chanical ventilation is considered operating. The in-door air-humidity corresponding to a two-bedroom type of indoor air-humidity class moisture, i.e., in-door moisture generation of 12 L/day with 0.35ACH mechanical ventilation and a room corresponding to 100m3.
4.2 Envelope air-pressure differential due to
mechanical ventilation
There are mainly three types of mechanical ventila-tion systems that are used: extract, supply and bal-anced ventilation. Extract ventilation systems re-move air from the indoor space generating positive pressure drops towards the interior. The envelope air-pressure differential,
mv P
∆
∆ , is positive in this case according to hygIRC convention for the signs of pressure drop, see Equation 3. Supply ventilation systems carry outdoor air inside the space causing a pressure drop across the envelope towards the exte-rior,
mv P
∆
∆ generated is negative in this case. Bal-anced ventilation combines extract and supply sys-tems using different air duct networks inside buildings. Balanced mechanical ventilation optimi s-tically does not change the pressure across the en-velopes. However, sometimes a slight imbalance may be introduced intentionally or non-intentionally causing either a positive or negative pressure drop across the envelope.
mv P
∆
∆ is not considered in WeatherSmart-1.1 when balanced mechanical ven-tilation is addressed. The difference in the envelope air-pressure generated by the three types of me-chanical ventilation could be very significant espe-cially for very air-tight envelopes, as shown in Fi g-ure 6. The example reported on Figg-ure 6 is for tall office buildings.
-80 -60 -40 -20 0 20 40 60 80 100 0 2190 4380 6570 8760 Time (Hours)
Envelope air-pressure differential (Pa)
Exhaust Ventilation Balanced Ventilation
Supply Ventilation
Figure 6. Model of a design load for envelope air-pressure dif-ferential when assessing effect of the type of mechanical ve n-tilation. The envelope is oriented east and is located at the top corner of a 10-storey residential building in Toronto. Leakage
coefficient=0.15 L/s m2 Pa0.65. Ventilation rate of 0.35 ACH
mechanical are assumed for supply and exhaust types of me-chanical ventilation. Controlled indoor air humidity type of building is used for indoor hygrothermal loads.
Very few data are available that correlate the en-velope air-pressure differential to the operating me-chanical ventilation. As a first order of approxima-tion, Liddament (1986) suggested the use of the traditional exponential flow equation for estimating the envelope air-pressure differential due to me-chanical ventilation as given in Equation 9. The en-velope air-pressure differential is a function of amount of the ventilation rate carried in or out of the indoor space by mechanical means. The flow coeffi-cient,
t
k , and exponent, n , in Equation 9 are those
determined by whole building pressurization/de-pressurization type of testing. Airflow rate and the flow coefficient and exponent should correspond to the same zone of testing for which testing has been performed.
(( ))
e S t k mv Q n mv P == ∆ ∆ (9) where tk total building leakage coefficient (also called flow coefficient) (m3/s m2 Pan)
n flow exponent (non-dimensional)
e
S surface area of the exterior envelope consid-ered (m2)
mv
Q airflow rate carried in or out of the building (m3/s)
Values of
t
k and n are buildings specific reflecting
the air-tightness of the exterior envelope being con-sidered. Proskiw & Phillips (2001) have gathered published data on air-tightness characteristics of large buildings from different countries including Canada. The authors reported the normalized
leak-age rate at an envelope air-pressure differential of 75 Pa (NLR75) for different types of buildings
in-cluding both residential and non-residential high-rise buildings. The mean NLR75 values given by the
authors are reported in the second column of Ta-ble 1. These mean values of total leakage coeffi-cients,
t
k , obtained from overall air-leakage tests in
Canada on whole buildings with the total envelope area used for calculation are implemented in WeatherSmart-1.1 as default values. Values of the total mean leakage coefficients reported in the third column of Table 1 are calculated by assuming a flow exponent n of 0.65. This value of the flow exponent is consistent with what is suggested by Ta-mura and Shaw (1976) for tall office buildings and equivalent to 0.67 that is suggested by Walker and Wilson (1998) for typical residential buildings.
Table 1. Airtightness values based on building type (reported by Proskiw and Phillips 2001, from testing of Canadian tall buildings
Building type Mean NLR75
(L/s m2) t k (L/s m2 Pa0.65) Residential 3.19 0.193 Office 2.48 0.15 Schools 1.48 0.089 Commercial 1.35 0.082 Institutional 0.86 0.052
The flow exponent, n , is assumed the same in WeatherSmart for both types of buildings, residen-tial and non-residenresiden-tial buildings. The flow expo-nent is assumed equal to 0.65.
Shaw & Jones (1979) have reported very small deviations when estimating air-leakage rates in one school building when performing both pressuriza-tion and sucpressuriza-tion types of air-leakage testing. Hence as a first degree of approximation,
t
k and n are
kept the same when simulating either extract or sup-ply type of mechanical ventilation systems, for both commercial and residential types of buildings.
Values of the ventilation airflow rates,
mv Q , used in Equation 9 are assumed in WeatherSmart to be equal to the required levels of ventilation rate for in-door air quality. In other words, in the absence of natural ventilation due to stack and wind effects, the minimum ventilation rates for IAQ requirements are assumed to be provided by mechanical ventilation devices. Table 2 of the ASHRAE standard 62 on “Ventilation for Acceptable Indoor Air Quality” provides ventilation rates for a wide range of build-ing types. For the purpose of carrybuild-ing out hy-grothermal analysis, a ventilation rate corresponding to 0.35 ACH is assumed for both residential and commercial buildings as suggested by the 2001
ASHRAE standard 62 for living areas in residential facilities.
5 SUMMARY
An analytical model to predict an envelope’s air-pressure differential was developed as a result of an extensive review of published literature. This model constitutes an upgrade of the previous approach that was used as boundary conditions in hygIRC simula-tions. An approach on how to predict the three main components of the total envelope air-pressure, wind, stack and mechanical ventilation induced pressures was developed and the main details for high-rise building applications are presented in this paper. This approach allows assessing several parameters that affect the hygrothermal performance of wall as-semblies such as the height and location of the wall assembly on the building facade, type of ventilation used whether it is supply, balanced or exhaust type of ventilation.
This approach has allowed adapting IRC’s hy-grothemal model, hygIRC, to deal specifically with envelope air-pressure differential of high-rise buildings. For example, wind induced air-pressure differential can now be estimated by accounting for the location of the envelope on the building façade. Local external wind pressure coefficients are used rather than surface averaged values. This is impor-tant when height effects on the hygrothermal per-formance of envelopes are taken into consideration. Wind effects on the interior air-pressures are also now accounted for. Correction is made when esti-mating the total wind induced air-pressure differen-tial. The building shape and geometry also affect the magnitude of pressure coefficients and is an impor-tant parameter when estimating the wind induced pressure on the envelope. Usually residential apart-ment buildings have a more rectangular shape whereas commercial office buildings have a more square geometry. The newly implemented model for pressure coefficients accounts for the nature of the building side and aspect ratios. The model for stack pressure calculation was also upgraded to correct for the indoor airflow resistance due to building internal compartmentation. The theoretical maximum stack pressure that is usually estimated assuming no inter-nal airflow is actually reduced due to the interinter-nal airflow resistance inside buildings. An approach for estimating the envelope air-pressure due to the dif-ferent type of typically used mechanical ventilation systems was also developed. This approach is used when the effect of the type of ventilation on the hy-grothermal performance of the walls is assessed.
This general approach to predict the three comp o-nents of envelope air-pressure is currently imple-mented in the recent version of IRC’s weather analysis tool WeatherSmart 1.1. WeatherSmart-1.1 now allows conversion of, in a user-friendly way, multi-decades of commercial weather data into ap-propriate indoor and outdoor (i) thermal, (ii) mois-ture and (iii) envelope air-pressure differential loads for long-term moisture calculations. The outputs from WeatherSmart 1.1 include hourly envelope air-pressure differential and are part of hygIRC’s indoor input files.
ACKNOWLEDGEMENTS
The authors would like to thank C.Y. Shaw and J.T. Reardon from IRC/NRC for their input. This work was partially funded by Canada Mortgage and Housing Corporation (CMHC), Natural Resources Canada (NRCan) and Public Works and Govern-ment Services Canada (PWGSC) but the views ex-pressed here those of NRC and the participants, CMHC, NRCan and PWGSC accepts no responsi-bility for them.
REFERENCES
Akins, R.E. & Cermak, J.E. 1976.“Wind pressures on build-ings”, Fluid Mechanics and wind engineering program, Colorado State university, IRN13606347, 1976.
Akins, R.E., Peterka, J.A. & Cermak J.E. 1979. “Averaged pressure coefficients for rectangular buildings”, Proc, Fifth International Conference, Fort Collins, CC. Pergamon Press, NY, pp 369-380, 1979
Djebbar, R., van Reenen, D. & Kumaran, M.K. 2001a. “Indoor and Outdoor weather Analysis Tool for Hygrothermal Modelling”, 8th Conference on Building Science and Technology, Toronto, Ontario, Feb, 2001), pp.139-157, 2001
Djebbar, R., van Reenen. D., & Kumaran M. K., 2001.b. “En-vironmental boundary conditions for long-term
hygrother-mal calculations”, Proc. 8th International conference on
building envelopes, Clearwater Beach, Florida, USA, Dec 2001.
Djebbar, R., Kumaran, M.K., Van Reenen, D. & Tariku, F. 2002a. Hygrothermal Modeling of Building Envelope Ret-rofit Measures in Multi-Unit Residential and Commercial Office Buildings, Client Final Report, pp. 187, 2002 (B-1110.3)
Djebbar, R., Kumaran, M.K., Van Reenen, D. & Tariku, F. 2002b, "Use of hygrothermal numerical modeling to iden-tify optimal retrofit options for high-rise buildings,"12th International Heat Transfer Conference (Grenoble, France, 2002-08-18), pp. 165-170, Sep, 2002 (NRCC-46032) Hens, H. 1996. Final Report, Volume 1, Task 1: Modeling.
In-ternational Energy Agency, Energy Conservation in Build-ings and Community Systems Program, Annex 24 Heat, Air and Moisture Transfer in Insulated Envelope Parts (HAM-TIE). Laboratorium Bouwfysica, K.U.-Leuven, Belgium.
Karagiozis, A. N. 1997a. “Porous media transport in building systems”. Canadian CFD Society Conference, Victoria, BC, pp 7-21 to 7-25
Karagiozis, A.N. 1997b. “Analysis of the hygrothermal be-haviour of residential high-rise building components”. IRC/NRC Client report number A-3052.4
Kato, N., Niihori, Y., Kurita, T. & Ohkuma, T. 1997 .“Full-scale measurement of wind-induced internal pressures in a high-rise building”, Journal of wind Engineering and In-dustrial Aerodynamics, Vol 69 – 71, pp. 619-630
Liddament, M. W. “Air infiltration calculation techniques- An applications guide”, IEA- Annex V, Air Infiltration and Ventilation Centre, Bracknell, Great Britain, June 1986. Magee, R. J., MacDonald. R. A & Shaw C. Y., 1999.
“Meas-urement of overall and component leakages at the Brooke Claxton Building”. Rept. NRCC/Institute for Research in Construction, Ottawa, Ontario, March 1999.
Ojanen, T. & Kumaran, M.K. 1996. “Effect of exfiltration on the hygrothermal behaviour of a residential wall assembly”, Journal of Thermal Insulation and building Envelopes, 19, pp. 215-227, 1996
Proskiw, G. & Phillips, B. 2001. “Airtightness characteristics
of large buildings”, Proc of the 8th Conference on Building
Science and Technology, pp 257-270, Feb 22-23, Toronto, Ontario, 2001.
Shaw, C.Y & Jones, L. 1979. “Air-tightness and air infiltration of school buildings”, ASHRAE transactions, Vol. 85, Part 1, 1979, pp. 85-95.
Shaw, C. Y & Reardon J.T. 1995. “Changes in airtightness lev-els of six office buildings”, ASTM STP 1255, pp. 47-57, 1995.
Swami, M.V & Chandra, S. 1987. “Procedures for calculating natural ventilation airflow rates in buildings”, ASHRAE Final Report FSEC-CR-163-86, ASHRAE Research Project 448-RP, March 1987.
Swami, M.V & Chandra, S. 1988. “Correlations for pressure distribution on buildings and calculation of natural-ventilation airflow”, ASHRAE Transactions (94) 1, pp 243-266, 1988.
Tamura, G.T & Wilson A. G. 1966. “Pressure differences for a nine-story building as a result of chimney effect and venti-lation system operation”, ASHRAE Transactions 72(1):180, pp-180-189, 1966.
Tamura, G.T & Wilson A. G. 1967a “Pressure differences caused by chimney effect in three high buildings”. ASHRAE Transactions 73(2), pp II.1.1 – II.1.10,
Tamura, G.T. & C.Y. Shaw. 1976b. “Studies on exterior wall airtightness and air infiltration of tall buildings. ASHRAE Transactions 82(1): 122. 1976
User’s Guide – National Building Code. 1995. Structural Commentaries (Part 4), pp 9-42 Canadian Commission on Building and Fire Codes. National Research Council of Canada.
Walker, I.S & Wilson, D.J. 1994. “Practical methods for
im-proving estimates of natural ventilation rates”. 15th AIVC
Conference, Bruxton, Great Britain 27-30 September, pp 517-525,.
Walker, I.S & Wilson, D.J. 1998. “Field validation of algebraic equations for stack and wind driven air infiltration calcula-tions”, Journal of HVAC&R Research, Vol. 4, No. 2, April 1998
APPENDIX
Walker and Wilson (1994) model to predict surface averaged external wind pressure coefficients (
p
C ) function of the angle
between the normal of the envelope and the wind direction
(θ): (( )) (( )) (( )) (( )) (( )) (( )) (( (( )))) (( )) (( )) (( )) (( )) (( )) (( )) −− ++ ++ ++ ++ −− ++ ++ == θ θ θ θ θ sin 4 3 2 2 sin 4 3 4 3 cos 2 1 4 1 2 cos 2 1 2 1 p C p C p C p C p C p C p C p C p C where
θ angle measured clockwise between the wind
direc-tion and the normal of the wall
(( ))
1p
C surface averaged
p
C when the wind is at 0°, i.e.,
the p
C on the windward wall
(( ))
2p
C surface averaged
p
C when the wind is at 180°, i.e.,
the p
C on the leeward wall
(( ))
3p
C surface averaged
p
C when the wind is at 90°, i.e.,
the p
C on the side wall with wind blowing from the
left
(( ))
4p
C surface averaged
p
C when the wind is at 270°, i.e.,
the p
C on the side wall with wind blowing from