Publisher’s version / Version de l'éditeur:
Optoelectronics, Photonics, and Imaging (Opto Canada 2002), 2002
READ THESE TERMS AND CONDITIONS CAREFULLY BEFORE USING THIS WEBSITE. https://nrc-publications.canada.ca/eng/copyright
Vous avez des questions? Nous pouvons vous aider. Pour communiquer directement avec un auteur, consultez la
première page de la revue dans laquelle son article a été publié afin de trouver ses coordonnées. Si vous n’arrivez pas à les repérer, communiquez avec nous à [email protected].
Questions? Contact the NRC Publications Archive team at
[email protected]. If you wish to email the authors directly, please see the first page of the publication for their contact information.
NRC Publications Archive
Archives des publications du CNRC
This publication could be one of several versions: author’s original, accepted manuscript or the publisher’s version. / La version de cette publication peut être l’une des suivantes : la version prépublication de l’auteur, la version acceptée du manuscrit ou la version de l’éditeur.
Access and use of this website and the material on it are subject to the Terms and Conditions set forth at
Tracking Targets on the International Space Station using a Laser
Scanner
Deslauriers, A.; Samson, C.; Blais, François
https://publications-cnrc.canada.ca/fra/droits
L’accès à ce site Web et l’utilisation de son contenu sont assujettis aux conditions présentées dans le site LISEZ CES CONDITIONS ATTENTIVEMENT AVANT D’UTILISER CE SITE WEB.
NRC Publications Record / Notice d'Archives des publications de CNRC:
https://nrc-publications.canada.ca/eng/view/object/?id=951cb002-e248-4f6b-9e2d-323b0d448437 https://publications-cnrc.canada.ca/fra/voir/objet/?id=951cb002-e248-4f6b-9e2d-323b0d448437National Research Council Canada Institute for Information Technology Conseil national de recherches Canada Institut de technologie de l’information
Tracking targets on the International Space Station
using a laser scanner.
Deslauriers, A., Samson, C., Christie, I., and Blais, F.
May 2002
* SPIE Proceedings, Optoelectronics, Photonics, and Imaging (Opto Canada 2002), Ottawa, On. May 9-10, 2002. NRC 44923.
Copyright 2002 by
National Research Council of Canada
Permission is granted to quote short excerpts and to reproduce figures and tables from this report, provided that the source of such material is fully acknowledged.
CA02-505
Tracking Targets on the International Space Station using a Laser Scanner
A. Deslauriers, C. Samson, I. Christie (Neptec Design Group, 302 Legget Drive, Kanata, ON, Canada K2K 1Y5), and F. Blais (National Research Council of CanadaOttawa, ON, Canada K1A 0R6)
1. Introduction
The Neptec Design Group has developed the Laser Camera System (LCS), a new 3D laser scanner for space applications, based on an autosynchronized principle from the National Research Council of Canada (NRC). The LCS operates both in imaging and target centroid acquisition modes. In imaging mode, the LCS raster scans objects and can produce 2D and 3D maps of their surface features. In centroid acquisition mode, the LCS determines the position of discrete target points on an object.
The LCS was tested in August 2001 during mission STS-105 of the space shuttle Discovery to the International Space Station1. From a fixed location in the shuttle payload bay, the LCS 1500 nm eye-safe infrared laser was pre-programmed to draw Lissajous patterns on Inconel (black dots on a white background) and retro-reflective disc targets affixed on the Multi-Purpose Logistics Module (MPLM). The LCS acquired centroid data for two and a half hours during the MPLM demating operation to demonstrate its ability to track both types of targets when they are
stationary and moving.
2. Centroid Analysis Technique
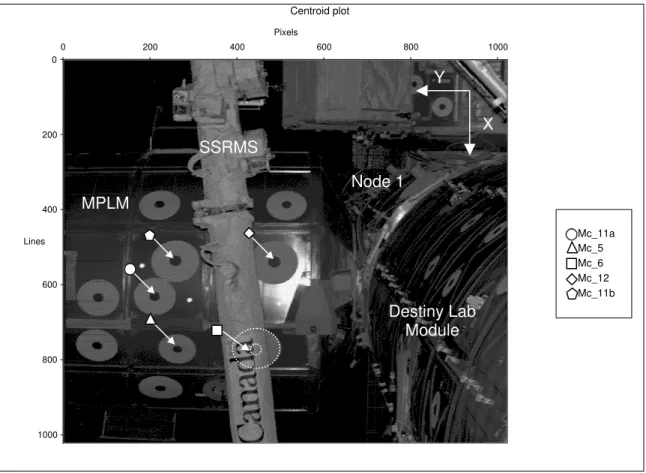
For post-flight data analysis, a Centroid Plotting Spreadsheet Analysis Tool (CPSAT) was developed to determine the times and locations of the Lissajous patterns throughout the flight. The CPSAT overlays centroids on a 2D image of the field-of-view (FOV) of the Laser Camera. The tool loads a FOV bitmap, taken by the LCS in imaging mode, converts scanning mirror angle centroid data into image pixels and lines, and superimposes the centroid data on the bitmap.
CPSAT was used to generate Figure 1 where the initial location of the Lissajous patterns is indicated by a dot with an arrow pointing to the intended physical target. By comparing the initial scan locations to the target locations measured from the FOV image, a misalignment between preset and actual target locations was identified. The misalignment was calculated to be approximately 2.0° in the X direction and 1.6° in the Y direction.
Also apparent in Figure 1, the Space Station Remote Manipulator System (SSRMS), also known as Canadarm2, is obscuring one of the intended inconel targets and three intended retro-reflective targets.
3. Centroid Statistics
During the flight the operator of the LCS, using the FOV image of the scene shown in Figure 1, was able to manually acquire certain targets to support the acquisition of centroid data. Due to the time-critical nature of space operations and the SSRMS blockage of 4 targets, valid centroid data was collected for 1 retro-reflective target and 3 Inconel targets.
The MPLM remained static for the first portion of testing prior to the demate so the period between 18:12:43 and 18:14:39 (duration of 1minute 55 sec) was selected to generate static target tracking statistics for selected target windows. This time period contains about 65 measured centroids for each target. The Lissajous patterns for Inconel targets used integration times of 900µs while retro-reflective targets used 20µs due to the much higher signal returned from retro-reflective targets. The 900µs integration time for Inconel targets meant that the standard 256 point scan would cause the laser to scan slower than the requirements for eye-safety. To meet eye-safety requirements, the number of sample points was reduced to 128 for the Inconel targets.
Centroid plot 0 200 400 600 800 1000 0 200 400 600 800 1000 Pixels Lines Mc_11a Mc_5 Mc_6 Mc_12 Mc_11b Y X MPLM SSRMS Destiny Lab Module Node 1
Figure 1. Initial scan locations and their intended targets (Inconel targets only)
Table 1. Centroid Tracking Statistics
Name Target Type Target Diameter [mm] # of Sample points in scan Integration
Time [µs] X MirrorStd. Dev [milliRad] Y Mirror Std. Dev [milliRad] Range Std. Dev [Pixel] Las_1 Retro-reflective 50.8 256 20 0.069 0.146 0.021 Mc_11A Inconel 139.7 128 900 0.997 1.300 0.009 Mc_12 Inconel 165.1 128 900 0.473 0.793 0.019 Mc_11b Inconel 158.7 128 900 0.225 0.266 0.010
The data show that there may be a significant improvement in centroid X-mirror and Y-mirror accuracy when using retro-reflective targets instead of Inconel: the X-mirror standard deviation is equal to half the Y-mirror standard deviation for retro-reflective targets, whereas the X- and Y-mirror standard deviations are approximately equal for Inconel targets. The improvement is likely the result of the higher resolution Lissajous pattern (256 points vs. 128 pts), its smaller diameter, and more sharply defined target borders due to the shorter integration time coupled with the higher signal return from retro-reflective targets.
In the range co-ordinate, the Inconel targets exhibit half the noise of retro-reflective targets. This may be explained by a larger number of range measurements being included in the Inconel centroiding algorithm due to the number of measurements on the white target background compared to the number of measured peaks detected on a retro target itself.
4. Laser Camera Data Comparison to RMS Data
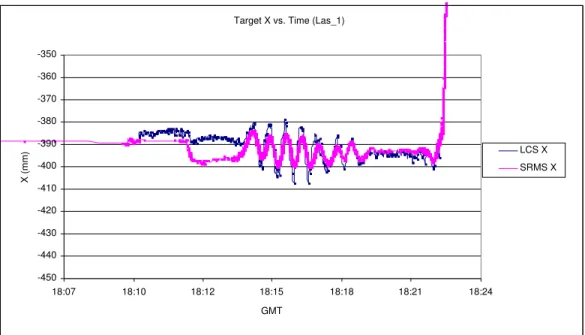
The Shuttle Remote Manipulator System (SRMS) was used to demate the MPLM from the ISS for return to earth in the shuttle’s cargo bay. The LCS was measuring target centroid data during this operation and continuously tracking the moving retro-reflective target Las_1 throughout the demate. Tracking of this target ceased when the target eventually left the Field-of-View of the LCS. During post-flight analysis, the RMS data was used in conjunction with existing ground surveys of the ISS modules to calculate the location of target Las_1. The calculated target location was then compared to the location measured by the LCS (Figure 2). Since the data are measured using two independent reference frames, with only general knowledge of the relationship between those frames, the initial offsets between the data points have been manually subtracted. There is also a discrepancy between the GMT recorded by the LCS and the GMT contained in the RMS data of about 2 minutes, 18 seconds that has been corrected.
The fit between the LCS and SRMS data in Figure 2 is excellent. The LCS has tracked the translational oscillations of the SRMS in the X direction, which are only a few millimetres in amplitude, as the RMS grappled the MPLM and translated it in the positive Y direction shown in Figure 1.
Target X vs. Time (Las_1)
-450 -440 -430 -420 -410 -400 -390 -380 -370 -360 -350 18:07 18:10 18:12 18:15 18:18 18:21 18:24 GMT X (mm) LCS X SRMS X
Figure 2. Las_1 target location co-plot in the X direction
5. Concluding Remarks
During mission STS-105, the LCS demonstrated the capability to track retro-reflective and Inconel targets when they are both stationary and moving. Comparison with an independent data set, the SRMS data, confirms that the LCS can track targets more than 10 m away with millimetre accuracy.
References
1. C. Samson, A. Deslauriers, C. English, G. Pepper, I. Christie, and F. Blais. “Imaging and Tracking Elements of the International Space Station using a 3D Autosynchronized Laser Scanner,” Proceedings of SPIE’s 16th Annual International Symposium on Aerospace/Defense Sensing, Simulations, and Controls, 2002.