HAL Id: hal-02324439
https://hal.archives-ouvertes.fr/hal-02324439
Submitted on 26 Jun 2020
HAL is a multi-disciplinary open access
archive for the deposit and dissemination of
sci-entific research documents, whether they are
pub-lished or not. The documents may come from
teaching and research institutions in France or
abroad, or from public or private research centers.
L’archive ouverte pluridisciplinaire HAL, est
destinée au dépôt et à la diffusion de documents
scientifiques de niveau recherche, publiés ou non,
émanant des établissements d’enseignement et de
recherche français ou étrangers, des laboratoires
publics ou privés.
physical Research. Planets, Wiley-Blackwell, 2019, 124 (9), pp.2430-2459. �10.1029/2018JE005872�.
�hal-02324439�
Jun Du1,2 , Wenzhe Fa1,3,4 , Mark A. Wieczorek2 , Minggang Xie3 , Yuzhen Cai1 ,
and Meng-Hua Zhu3,4
1Institute of Remote Sensing and Geographical Information System, School of Earth and Space Sciences, Peking
University, Beijing, China,2Université Côte d'Azur, Observatoire de la Côte d'Azur, CNRS, Laboratoire Lagrange, Nice,
France,3State Key Laboratory of Lunar and Planetary Sciences, Macau University of Science and Technology, Macau, China,4CAS Center for Excellence in Comparative Planetology, Hefei, China
Abstract
Partially buried craters on the Moon are those craters whose distal ejecta are covered by lava flows and where the crater rim crest still protrudes above the mare plain. Based on the difference in rim heights between a partially buried crater and an unburied crater, previous studies estimated thethicknesses of the lunar mare basalts. However, these studies did not consider the erosion of the crater rim height, which can result in an overestimate in the derived thickness. By using recent high-resolution topographic data, we report a basalt thickness estimation method based on numerically modeling the topographic degradation of partially buried craters. We identified 661 buried craters over the lunar surface, and their spatial distribution suggests a preferential occurrence along the mare-highland boundaries. An elevation model of fresh lunar craters was derived, and the topographic diffusion equation was used to model crater degradation. By modeling the formation, degradation, and flooding of partially buried craters, basalt thicknesses were estimated for 41 mare craters whose rims are completely exposed. The resulting mare basalt thicknesses vary from 33 to 455 m, with a median value of 105 m that is 95 m smaller than that derived when not considering crater degradation. The estimated eruption rate of lunar mare basalts is found to have peaked at 3.4 Ga and then decreased with time, indicating a progressive cooling of the lunar interior. As a by-product from the crater degradation model, our results suggest that the topographic diffusivity of lunar craters increases with diameter.
Plain Language Summary
The thickness of mare basalts that partially cover a lunar crater can be estimated from the crater shape. To simplify this problem, previous studies used the shape of a fresh lunar crater, which had been well-characterized beforehand. In reality, however, the lunar crater degrades with time, which results in a more complicated, time-dependent crater shape. In this study, a crater degradation model is used to better estimate mare basalt thicknesses. Our results show that the mare basalt thickness could be overestimated by a factor of two when crater degradation is not considered. Our results constrain the volcanic eruption rate with time and imply that the crater degradation rate scales with crater size.1. Introduction
Impact cratering and volcanism are the two major processes shaping the surface of the Moon. Impact crater-ing created large topographic relief on the lunar surface, whereas volcanic products filled in the topographic lows and produced new surfaces. Impact cratering and volcanism also act on each other as well. On the one hand, impact cratering produced stress conditions in the crust that favor the ascent of the magma (Michaut & Pinel, 2018). On the other hand, lavas might either partially or completely bury a previously formed impact crater depending on the thickness of the flow and the height of the crater rim. As a result, the observed lunar surface morphology and size-frequency distribution of lunar craters have been evolving due to the combined effect of crater formation and mare emplacement.
The lunar maria are composed of iron-rich basalts that were originally generated by partially melting the mantle, then driven by excess pressure at or below the crust-mantle boundary to propagate upward through dikes, and finally extruded out to form larger-scale, effusive plains over the lunar surface (e.g., Head, 1976; Head & Wilson, 2017; Wilson & Head, 1981, 2017). Radiometric measurements of lunar samples and crater Key Points:
• Crater degradation theory and a new shape model of fresh craters are applied to estimate the thickness of lunar mare basalts
• The median thickness of sampled mare basalts is 105 m, roughly half as thick as those obtained when not considering crater degradation • The eruption rate of mare basalts
decreased with time, and the topographic diffusivity of lunar craters increases with crater diameter Supporting Information: • Supporting Information S1 • Table S1 Correspondence to: J. Du, jundu@pku.edu.cn Citation:
Du, J., Fa, W., Wieczorek, M. A., Xie, M., Cai, Y., & Zhu, M.-H. (2019). Thickness of lunar mare basalts: New results based on modeling the degradation of partially buried craters.
Journal of Geophysical Research: Planets, 124
2018JE005872
Received 8 NOV 2018 Accepted 19 AUG 2019
Accepted article online 27 AUG 2019
Author Contributions
Funding Acquisition: Wenzhe Fa, Mark A. Wieczorek
Methodology: Jun Du, Wenzhe Fa, Mark A. Wieczorek, Minggang Xie, Meng-Hua Zhu
Validation: Jun Du, Wenzhe Fa, Mark A. Wieczorek, Minggang Xie, Yuzhen Cai
Supervision: Wenzhe Fa, Mark A. Wieczorek
Writing - review & editing: Jun Du, Wenzhe Fa, Mark A. Wieczorek
©2019. American Geophysical Union. All Rights Reserved.
Published online 13 SEP 2019 https://doi.org/ 10.1029/
from place to place, from several meters to several kilometers.
In this study, we focus on using the morphology of impact craters that are partially buried by lava flows, in order to estimate the thickness of lavas that were emplaced after the crater formed. On the Moon, the con-tinuous ejecta blanket of a normal, unflooded crater usually extends about one crater radius from the crater rim (Moore et al., 1974). A partially buried crater forms when a lava flow covers the distal low-elevation ejecta, leaving the high-elevation rim crest visible (e.g., Baldwin, 1970; Eggleton, 1961; Marshall, 1963). Note that craters could also be infilled or buried by ejecta from nearby craters (Xie & Zhu, 2016), but craters par-tially buried by ejecta deposits will not be considered in this study. The mare basalt thickness surrounding a partially buried crater can be calculated if two quantities are known: the total rim height as defined by the elevation difference between the rim crest and preflooding background surface, and the exposed rim height with respect to the present-day surroundings (De Hon, 1974). The resulting thickness estimate can be either the total basalt thickness if the partially buried crater formed initially on the highlands, or the thickness of the upper basaltic layers if the partially buried crater formed on the maria. In practice, the exposed rim height was easily measurable, whereas the total rim height was estimated based on the observed morphology of fresh craters. Previous studies used scaling relations between crater rim height and diame-ter of fresh lunar cradiame-ters (e.g., Baldwin, 1949, 1963; Pike, 1967, 1972, 1977) to estimate the total rim height and hence the basalt thickness. Using early topography data (e.g., Lunar Topographic Orthophotomap/LTO and Lunar Astronautical Chart/LAC), mare basalts near partially buried craters in the western (45◦S–45◦N; 90◦W–10◦E) and eastern (30◦S–30◦N; 0–100◦E) maria were estimated to be 400 and 200 to 400 m thick on average, respectively (De Hon, 1979; De Hon & Waskom, 1976).
However, craters on the Moon suffer from continual meteoroid bombardment and other mass-wasting pro-cesses. As a result, with increasing time, the crater diameter should increase and the rim height should decrease due to the downslope movement of rim and ejecta materials. If the initial rim height were used to determine the basalt thickness, then the basalt thickness would be overestimated if the crater erosion were significant. To account for crater degradation, Hörz (1978) randomly selected 82 highland craters with dif-ferent degradation states and measured their rim heights. As the obtained median rim height is only 58% of that for fresh lunar craters (Pike, 1977), Hörz (1978) then simply reduced all the basalt thickness estimates in De Hon and Waskom (1976) and De Hon (1979) by a factor of two. The resulting, revised median mare basalt thickness on the lunar nearside was found to be smaller than 300 m. Nevertheless, the classification of ages and degradation states for the lunar highland craters in Hörz (1978) was largely qualitative. Based on the morphologic characteristics of the inner wall, rim crest, and ejecta deposits, several criteria were proposed to categorize lunar craters into different degradation states in a qualitative way (e.g., Baldwin, 1949; Basilevsky, 1976; Pohn & Offield, 1970). Crater degradation is mainly caused by diffusive and nondif-fusive processes. Micrometeoroid bombardment, thermal expansion and contraction, and seismic shaking have been modeled as diffusive processes, whereas landslides that occur when the surface slope reaches a critical value and emplacement of ejecta from adjacent craters are considered as nondiffusive processes (Melosh, 2011; Fassett & Thomson, 2014). Modeling efforts have typically used the classical diffusion equation (e.g., Craddock & Howard, 2000; Culling, 1960, 1963; Richardson, 2009; Soderblom, 1970), and the most recent efforts have made use of high-quality topography data sets of the Moon (e.g., Fassett & Thomson, 2014; Xie & Zhu, 2016).
In this study, we developed an improved method for mare basalt thickness estimation based on the elevation profile of partially buried impact craters. By applying topographic diffusion theory, the evolution of a par-tially buried crater can be modeled through time, both before and after the emplacement of the mare basalts. The modeled final elevation profile depends on the initial crater topographic profile, the basalt thickness, the time durations between crater formation, flooding and the present, and the topographic diffusivity. By comparing the observed profile with a series of modeled profiles, the mare basalt thickness can be estimated at the location of the partially buried crater. Our study improves upon previous works in several ways. First, the previous databases of partially buried craters were constructed several decades ago (e.g., De Hon, 1979; De Hon & Waskom, 1976), and new remote sensing data with unprecedented spatial resolution and qual-ity have since been acquired. Second, crater degradation modeling has been improved through the years (e.g., Fassett & Thomson, 2014), and high precision digital elevation models allow us to better character-ize the morphology of both fresh and degraded impact craters. Third, depending on whether the partially buried crater formed on highland or mare materials (as determined from remote sensing data), this tech-nique may provide not only the thickness of the uppermost basaltic units that embayed the crater but also the total thickness of basalts that erupted in the region. Fourth, based on the best fitting parameters from the degradation model, we are able to investigate how the topographic diffusivity varies with both time and crater size.
The structure of this paper is organized as follows. First, we summarize prior methods that have been used to estimate the thicknesses of the mare basalts on the Moon (section 2). Second, we present all the remote sensing data sets and the derived data products that will be employed in this study, including their reso-lution, coverage, and precision (section 3). Third, the identification criteria and a detailed classification of buried craters are presented, and the statistical characteristics of the buried crater population are analyzed (section 4). Next, the mare basalt thickness estimation method is described, including the topographic dif-fusion model, the initial profile of fresh craters, and the numerical inversion scheme (section 5). After that, the estimated mare basalt thicknesses are presented and analyzed, which includes a detailed case study and the global results (section 6). Then, the obtained mare basalt thicknesses are compared with those derived using other techniques, the cumulative basalt volume and time-dependent eruption rate of the mare basalts are calculated, and as a by-product, the scale dependence of the crater degradation process is discussed (section 7). Finally, we conclude by discussing several remaining issues, as well as the outlooks for other applications of the crater degradation model (section 8).
2. Methods to Estimate Mare Basalt Thicknesses
Mare basalt thicknesses have been investigated by many studies, which can be divided into four general classes: direct measurements using elevation differences of lava flow fronts and layering features in crater walls (e.g., Robinson et al., 2012; Schaber, 1973; Stickle et al., 2016), subsurface sounding radar using a spaceborne or ground penetrating radar (e.g., Oshigami et al., 2014; Phillips et al., 1973; Xiao et al., 2015), geophysical techniques based on seismology and gravity (e.g., Cooper et al., 1974; Gong et al., 2016; Talwani et al., 1973), and investigations of impact craters, including partially buried craters, modification of the crater size-frequency distribution, and the composition of crater ejecta (e.g., De Hon, 1974; Hiesinger et al., 2002; Thomson et al., 2009). Each of these methods measures a different “thickness” (total thickness, thickness of the last flow, or thickness since a crater formed), and has different spatial and temporal resolutions. As a result, the global volume of mare basalts is still poorly constrained.
The most straightforward technique for estimating basalt thicknesses is the direct measurement of the height of a lava flow front and layering structures in lava tube skylights and crater inner walls. This method usually gives the thicknesses of younger lava flows close to the lunar surface. Using the shadow length measure-ment technique with Apollo 14–17 metric photographs and Lunar Orbiter (LO) images, the individual lava flows in Mare Imbrium were estimated to be 1–96 m in thickness (Gifford & El-Baz, 1981; Schaber, 1973). Three lava tube skylights have been spotted in Marius Hills, Mare Tranquillitatis, and Mare Ingenii using the Lunar Reconnaissance Orbiter Camera/Narrow Angle Camera (LROC/NAC) images. Their steep inner walls consist of five to eight layers that were found to be 3–14 m in thickness based on shadow length mea-surements (Robinson et al., 2012). Layering structures were also found in the crater walls of 13 fresh lunar craters. The flow thicknesses at these impact sites were estimated to be 48–400 m based on the LROC/Wide Angle Camera (WAC) digital terrain model (DTM) and LROC/NAC images (Stickle et al., 2016). However,
(SELENE/LRS) data, one to five basaltic layers were detected with thicknesses of 73–460 m in several near-side maria (Ishiyama et al., 2013; Kobayashi et al., 2012; Ono et al., 2009; Oshigami et al., 2009, 2012, 2014). The Chang'E-3 Lunar Penetrating Radar also performed subsurface sounding experiments along its sur-vey track (near 44.12◦N, 19.51◦W), and the 60-MHz observations revealed multiple layering structures in the mare basalts. Zhang et al. (2015) found three basalt layers with thicknesses of 25, 130, and 195 m, and Xiao et al. (2015) identified four basalt layers with thicknesses of 42, 80, 100, and 120 m. We note that the estimated mare basalt thickness from radar observations depends on the poorly constrained dielectric per-mittivity (Ishiyama et al., 2013) and that signal artifacts produced by the radar itself make it difficult to detect deep-seated reflectors (Li et al., 2018).
Geophysical techniques based on gravity and seismology data have also been used to investigate basalt thick-nesses. These methods depend on the density contrast between mare and highland materials, and therefore can provide the total basalt thickness. Using the seismic refraction data collected at the Apollo 17 landing site, the total basalt thickness near the Taurus-Littrow valley was estimated to be 1.4 km (Cooper et al., 1974). With newly acquired gravity data from the Gravity Recovery and Interior Laboratory (GRAIL) mis-sion, the total basalt thickness on the western nearside hemisphere (19◦S–45◦N, 68◦W–8◦W) was estimated to be 740 m on average (Gong et al., 2016). Though the seismic estimate is applicable for a small region near the Apollo 17 landing site, the gravity inversions provide average thicknesses over circular regions with radii between 240 and 600 km (Gong et al., 2016). It should be noted that results based on geophysi-cal techniques sometimes depend on poorly constrained properties such as the density and porosity of the subsurface materials.
Impact craters excavate materials from depths of about one tenth of their diameter and thus provide a win-dow on the composition of materials below the surface (Croft, 1980; Melosh, 1989). For craters in the maria, the presence (or not) of anorthositic highland materials in the ejecta blanket constrains the total thickness of mare basalts at the impact site. For example, based on the FeO abundances derived from the Clementine Ultraviolet/Visible (UVVIS) images, the total basalt thicknesses in parts of Mare Imbrium and Mare Humo-rum were estimated to be respectively 1.5–2 km and 150–500 m (Budney & Lucey, 1998; Thomson et al., 2009). Mare basaltic flooding can also affect the size-frequency distribution of craters found on a geologic unit. During the emplacement of lava flows, some portion of the smallest craters are completely buried. The existence of such a discontinuity in the crater size-frequency distribution can be used to estimate the flow thickness (Neukum & Horn, 1976). This method returns the thickness of the uppermost, youngest lava flows. For several nearside mare regions, modifications of the crater size-frequency distributions have been identified, and the basalt thicknesses therein were estimated to be 20 to 220 m (Hiesinger et al., 2002). We need to stress that the basalt thickness estimated from impact craters also invokes a better, quantitative understanding of the crater ejecta emplacement and topographic degradation mechanisms.
3. Data Sets
Multiple remote sensing data sets are used in this study, and generally they can be categorized into four classes: optical images, topographic data, surface composition, and radar sounding observations. The first three types of data are used to identify partially buried craters over the lunar surface. The topographic data are used to extract the radial profiles of fresh craters and partially buried craters for initial crater profile mod-eling and basalt thickness estimation, respectively. The compositional data are used to determine the target
materials (mare/highland) over which a partially buried crater formed, and to derive the dielectric permit-tivity for the estimation of the actual depth of subsurface reflectors in radar images. The radar sounding data are used to compare with the mare basalt thickness estimates from partially buried craters.
The final global LROC/WAC mosaics with a spatial resolution of 100 m/pixel are used in our study, which have been photometrically corrected with favorable solar incidence angles of 55—75◦for morphology recog-nition (Robinson et al., 2010; Speyerer et al., 2011). Previous studies suggested that at least 10 pixels are needed to identify a small lunar crater unambiguously (e.g., Fa et al., 2014; Fassett, 2016; Robbins et al., 2014), and therefore, we restrict our analysis to craters larger than 1 km in diameter.
Recent, widely used lunar topographic data sets include the LRO/Lunar Orbiter Laser Altimeter (LOLA) dig-ital elevation model (DEM; Smith et al., 2010) and the SELENE/Terrain Camera (TC) stereo-image-derived digital terrain model (Haruyama et al., 2012). With a vertical accuracy of 1 m and covering the entire lunar surface, the LOLA DEM has a geodetically accurate global control network, and the gridded data products were produced with a nominal spatial resolution of 29.6 m at the lunar equator (Smith et al., 2010). The SELENE/TC DTM has a vertical accuracy of 10 m, covers the nonpolar region (<60◦N/S), and has a higher spatial resolution of 10 m (Haruyama et al., 2012). To combine the advantages of these two data sets, a SELENE-LRO merged digital elevation model (SLDEM) was generated by coregistering the TC DTM to the LOLA geodetic framework (Barker et al., 2016). The resulting data set covers latitudes between 60◦N/S with a spatial resolution of 59 m and a vertical accuracy of 3–4 m (Barker et al., 2016). In this study, the SLDEM was used as the elevation data for latitudes equatorward of 60◦, and the LOLA DEM with a spatial resolution of 60 m was used for higher latitudes.
The elevation data used by De Hon in his series of studies come from three sources (De Hon, 1979). As the first choice, he used the Lunar Topographic Orthophotomap to calculate rim heights where the Apollo 15–17 mapping photographs were available. This data product consists of contours with an interval of 100 m and has an elevation uncertainty of 30–115 m (Defense Mapping Agency Topographic Center, 1973). In regions beyond those pictured by the Apollo mapping cameras, the author used the Lunar Astronautical Chart derived from Earth-based telescopic photography or measured the shadow lengths in the Lunar Orbiter frames to extract rim heights. The Lunar Astronautical Chart has a sparser contour interval of 300 m (Aero-nautical Chart Information Center, 1973), and both derived elevations have an uncertainty of 100 m (De Hon, 1979). It should be noted that the above elevation uncertainties of the LTO, LAC, and LO data are nom-inal values and that the resulting, measured morphometric parameters could have an average uncertainty as large as 700 m in regions with significant relief (see Table 1 in Pike, 1974). In comparison with these early topographic data sets used by De Hon, the newly acquired SLDEM and LOLA data have much better spatial resolution (2–5 times higher), coverage (globally covered), and accuracy (8–40 times higher). Therefore, the basalt thickness estimates given by our study should be considered to supercede those obtained by De Hon's pioneering studies (e.g., De Hon, 1979; De Hon & Waskom, 1976).
Using multispectral data collected by the SELENE/Multiband Imager (MI; Ohtake et al., 2008) and the Clementine/UVVIS (Eliason et al., 1999), FeO and TiO2abundance maps can be calculated. The
uncer-tainties of the FeO abundance are 0.8 wt.% for the MI and 1.0 wt.% for the UVVIS data sets, whereas the uncertainties for TiO2are, respectively, 0.4 wt.% and 0.9 wt.% (Lucey et al., 2000; Otake et al., 2012). The recently released MI mineral abundance mosaics cover the lunar surface between 50◦N/S with a spatial res-olution as high as 60 m/pixel and include photometric corrections using surface topography (Lemelin et al., 2016). The UVVIS composition maps have a lower spatial resolution of 200 m/pixel and are not topograph-ically corrected, but they have better coverage at latitudes higher than 50◦in comparison to the MI maps (Eliason et al., 1999). Therefore, in this study we will use the MI abundance maps for regions equatorward of 50◦latitude and the UVVIS composition maps at higher latitudes.
The SELENE LRS operated at a center frequency of 5 MHz with a bandwidth of 2 MHz, resulting in a 75-m range resolution in vacuum. After surface clutter reduction with synthetic aperture radar (SAR) processing techniques, the final released data have an along-track resolution of 600 m (Kobayashi et al., 2012). The LRS data provide the received backscattered echo as a function of time delay. The data formats include the one-dimensional A-scope plot (where the radar echo strength at a given location is plotted against time delay), and the two-dimensional SAR-processed image (where the radar echo strength is plotted with the along-track distance and the time delay). To convert apparent depth, which is the product of half the time
Figure 1. Example of a partially buried crater Brayley (D=14.6km) and a normal, unburied crater Rosse (D=11.9km). LROC/WAC reflectance, SELENE/MI-derived TiO2content, and SLDEM elevation maps for Brayley (a–c) and Rosse (d–f) are shown in the top, middle, and bottom rows, respectively. The right column plots selected individual radial profiles (AB and CD) of reflectance (g), and the azimuthally averaged radial profiles of TiO2content (h) and elevation (i), for Brayley (solid black lines) and Rosse (solid red lines). In (a–f), the red stars denote the location of crater centers. In (b), (c), (e), and (f), the solid black lines give the boundaries where the azimuthally averaged radial profiles were extracted. In (a–c), the white and black arrows indicate the boundaries of the crater ejecta. In (c) and (f), the white boxes are areas excluded when calculating elevation profiles. In (g–i), the black and red arrows point to the manually identified ejecta boundaries for Brayley and Rosse, respectively, and the solid blue lines denote the crater radius and the predicted continuous ejecta radius for unburied crater ejecta. All the y axes in the profile plots refer to the case of Brayley, and for Rosse, the reflectance and TiO2content profiles have been shifted arbitrarily for clarity. All the profiles are plotted with the radial distance normalized by crater radius, and the elevation profile is plotted with the vertical elevation normalized by crater diameter. The rim crest elevation of Brayley was set to be 0, and the crater profile of Rosse was shifted vertically to have the same rim crest elevation as Brayley.
delay and the speed of light in vacuum, to actual depth, the vertical profile of dielectric permittivity (often assumed to be constant) for the studied region is required.
Two derived data products are also used in this study to aid our understanding of the geological context of partially buried craters. A mare basemap derived from the monochromatic and color ratio images from the LROC/WAC and Clementine/UVVIS data sets provides the locations of regions flooded by mare basalts (Nelson et al., 2014). The boundaries of individual basaltic units defined by the LROC/WAC and Clemen-tine/UVVIS data products are also used to determine the surface unit that embayed the partially buried crater (Hiesinger et al., 2006, 2011; Morota et al., 2009, 2011; Pasckert et al., 2018). The absolute model age of each unit was derived from the crater-counting results (Hiesinger et al., 2006, 2011; Morota et al., 2009, 2011; Pasckert et al., 2018).
4. Craters Buried by Mare Basalts
4.1. Identification of Buried CratersPartially buried craters are impact craters that have been partially covered by lava flows, and whose crater rim is at least partially protruding above the surrounding lavas (De Hon, 1974). By this definition, two criteria are proposed for the identification of a partially buried crater: (1) the transition between crater ejecta and postimpact lava flows should be abrupt and well defined, and (2) the extent of the exposed proximal ejecta should be smaller than one crater radius. The first criterion is a result of the fact that ejecta deposits grade smoothly from continuous to discontinuous deposits. Lava flows that embay the crater simply truncate the preexisting ejecta. The second criterion is a result of the fact that continuous ejecta of unburied lunar craters usually extend about one crater radius from the crater rim (Moore et al., 1974).
Evidences for these two diagnostic characteristics can be found easily in the reflectance, composition, and elevation maps of impact craters. As an example, in Figure 1, the partially buried crater Brayley (20.89◦N, 36.93◦W; D = 14.6 km) and the unburied crater Rosse (17.95◦S, 34.99◦E; D = 11.9 km) are selected here for a detailed comparison. Both craters are simple craters with a bowl shape and a similar size. The ejecta boundary of Brayley is seen to have an abrupt boundary in the reflectance, TiO2content, and elevation
data (arrows in Figures 1a–1c). In contrast, the crater ejecta of Rosse gradually degrade to the background terrain, and the ejecta boundary is not well defined (Figures 1d–1f). The ejecta radii of Brayley (black) and Rosse (red) were obtained by using the abrupt changes in the reflectance, TiO2content, and elevation radial profiles (Figures 1g–1i). For the crater Brayley, the radial profiles reach the background level at about 1.4 times the crater radius (black arrows), whereas for the crater Rosse, the ejecta boundaries (red arrows) are difficult to determine but are with no doubt larger than those of Brayley.
Because the crater diameters of Brayley and Rosse are similar, a comparison of the exposed rim heights derived from the elevation profiles can provide additional evidence on the burial of Brayley's ejecta by lava flows. In this study, the azimuthally averaged radial profile of the crater is used to calculate its rim height, which is defined as the elevation difference between the rim crest and the background terrain as averaged within 2.5–3 crater radii from the crater center. The exposed rim height of Brayley is estimated to be 415 m, in comparison with 512 m for Rosse. Since Brayley is about 2.7 km larger and also appears morphologically younger (shaper rim crest and more prominent streaks of fresh boulders in the crater inner wall) than Rosse, the most likely explanation for the smaller exposed rim height of Brayley is the emplacement of lava flows exterior to the crater rim.
4.2. Database and Classification of Buried Craters
We constructed a database of buried impact craters (Figure 2), making use of the LROC/WAC basemap and the ArcGIS platform with the Crater Helper Tools toolkit (Nava, 2011). In order to obtain the center and diameter of the crater, the crater rim needs to be determined first. The crater rim can be seen as an exposed crater rim (Figure 1a), a wrinkle ridge (Figure S1e) or a topographic depression boundary (Figure S1f). If the crater rim is intact and continuous, then three control points that are ∼120◦apart along the rim were selected manually to define a circle that was used to determine the center and diameter of the crater. When less than 10% of the crater rim can be seen, then the determination of the crater center and diameter is prob-lematic: we did not include this type of crater in our study, which may result in an underestimate of the total number of partially buried craters. In total, we identified 661 partially and completely buried craters on the lunar surface, all located within mare deposits or along mare margins. The diameter, longitude,
Figure 2. Distribution of buried craters with completely exposed rims (light red, N=262), partially exposed rims (blue,
N=360), and completely buried rims (green, N=39). The lunar maria basemap (gray) is from Nelson et al. (2014), and the basaltic unit boundaries (white) are from a compilation of previous studies (Hiesinger et al., 2006, 2011; Morota et al., 2009, 2011; Pasckert et al., 2018). The size of the circles increases with increasing crater diameter.
latitude, classification, percentage of the rim that is buried, and composition of the rim/ejecta are given in the supporting information.
We divided the identified buried craters into three classes based on the observed morphology of the crater rim: completely exposed, partially exposed, and completely buried (Table 1). Craters with rims completely or partially exposed can be classified into two subclasses based on their locations. If the entire exposed ejecta are surrounded by lava flows, then the crater is classified as being located in the mare, whereas if part of the exposed ejecta are contiguous with the surrounding highland terrain, then the crater is classified as being located on the mare-highland boundary. We note that craters located in the maria could have formed on the highland crust and later were flooded by basalts, such that the exposed crater rim and ejecta have a highland composition (see section 5.4).
In an idealized case, a crater would form on a perfectly flat surface, the rim crest height would be the same everywhere, and any mare basalts that flooded the region would be uniform in thickness. There are several factors that complicate such an idealized scenario. First, the impact crater could form on a sloping surface and the lavas would only embay that portion of the crater at the lowest elevations. This is likely what occurred for partially buried craters that form along the mare-highland boundaries. In these cases (Figure S1a), the
Table 1
Classification of Buried Impact Craters (N=661)
Class Location Description Number
Rim completely exposed Mare (Figure 1a) Rim and proximal ejecta completely exposed, distal ejecta buried 74 Mare-highland boundary (Figure S1a) Mare side: rim and proximal ejecta completely exposed, distal ejecta buried; 188
Highland side: rim and ejecta completely exposed
Rim partially exposed Mare (Figure S1b) Rim and proximal ejecta partially exposed, distal ejecta buried 112 Mare-highland boundary Mare side: rim and proximal ejecta partially exposed (N=239; Figure S1c) 248
or completely buried (N=9; Figure S1d), distal ejecta buried; Highland side: rim and ejecta completely exposed
Rim completely buried Mare Rim and ejecta completely buried, characterized by a wrinkle ridge (Figure 39
crater rim and ejecta can be divided into highland and mare parts: the crater ejecta of the highland part are not buried by lava flows, whereas the crater ejecta of the mare part are. Though these craters are included in our database, they will not be analyzed later as a result of this complication.
In a more complex scenario, a part of the crater rim could be breached by the exterior lavas in several places, leaving a crater rim that is discontinuous (Figures S1b–S1d). The formation of such a partially buried crater could arise as a result of several asymmetric processes. The crater rim height is not everywhere constant, either as a result of the initial formation processes or by later erosional processes (such as small craters that formed on the rim). Alternatively, the basalt thickness might not be uniform everywhere, with the thicknesses being higher on the side of the crater rim that was breached.
To extend our database, we also searched for craters that are completely buried by lava flows. This type of crater is usually characterized by a concentric wrinkle ridge over the crater rim (Figure S1e) or a subtle topographic low in the crater interior as a result of thermal contraction of the cooling lava flow (Figure S1f). The mare basalt thickness around a completely buried crater is difficult to estimate. On the one hand, the mare basalt thickness needs to be greater than the crater rim height. On the other hand, this crater rim height could have been degraded between the times of crater formation and lava infill. Therefore, although we include these entirely buried craters in our database, we will not use them later when estimating mare basalt thicknesses. We note that completely buried craters can also sometimes be identified in the Bouguer gravity anomaly maps (e.g., Evans et al., 2016, 2018; Sood et al., 2017; Zhang et al., 2018).
De Hon and Waskom (1976) and De Hon (1979) constructed a global partially buried crater database that included 342 partially buried craters in the nearside eastern (30◦S–30◦N; 0–100◦E) and western (45◦S–45◦N; 90◦W–10◦E) maria, of which the crater rim is either completely or partially exposed as defined by our clas-sification. It is challenging to directly compare their database with ours, because there is a misregistration between the two databases in the coordinate systems used. By comparing the provided crater center coordi-nates for several of the largest and thus least ambiguous partially buried craters (e.g., Flamsteed P: D = 108.9 km), this misregistration can be up to 10 km. Nevertheless, our database is expected to be more accurate and more complete than previous ones, because of our use of more recent remote sensing data sets with considerably higher accuracy and resolution.
4.3. Spatial Distribution and Statistics of Buried Craters
The most prominent feature seen in the spatial distribution of buried craters is their preferential occurrence along the mare-highland boundaries (Figure 2). This distribution pattern is to be expected, since the mare basalts at the edge of the mare are expected to be thinner than elsewhere. Though the thicker flows in the mare centers can entirely flood craters of a given size, the thinner flows at the margins can only partially flood the crater. This interpretation is supported by the identification of ghost craters in Bouguer gravity anomaly maps in the central portions of the maria (e.g., Evans et al., 2016, 2018; Sood et al., 2017; Zhang et al., 2018). We also note that the smallest buried craters are distributed uniformly across the mare, whereas larger ones are concentrated along the mare-highland boundaries. Our interpretation of this observation is that the larger craters were completely buried in the central mare where the basalt thicknesses are the greatest. Many of the smaller craters, in contrast, are younger and formed during the main phase of mare volcanism. Many of these craters thus formed on top of preexisting lava flows. The thickness of the flows that buried these craters was thus only a fraction of the total thickness of lavas in the region. With thinner flows embaying the crater, the probability that the rim crest would remain unburied would be higher. Histograms of the different classes of buried craters as a function of diameter are shown in Figure 3a. The diameters of all the partially and completely buried craters range from 1.5 to 130 km, of which craters with rims completely exposed in the maria range from 1.8 to 45.3 km. In general, the peak in the histogram is skewed toward smaller craters. This is in part because there are in general more smaller than larger craters, but also because the older and larger craters that formed before the main phase of mare volcanism have been completely buried. Analyzing the craters by class, the median crater diameter is found to increase from craters with rims completely buried (3.7 km), to those with rims partially exposed (9.3 km), and to those with rims completely exposed (11.6 km). This observation is easy to explain: for a given thickness of lava flow, smaller craters with lower rim heights are easier to completely bury than larger craters with greater rim heights. In terms of location, the median diameter of partially and completely buried craters on maria (6.6 km) is smaller than that along mare-highland boundaries (12.9 km). As noted previously, we interpret
Figure 3. (a) Size-frequency distributions of the different classes of buried craters. (b) Percentage of the rim buried by mare basalts for craters that formed in the mare (red) and craters that formed along the mare-highland boundary (blue). In (b), the scale of the vertical axis is discontinuous, and the total numbers of craters with rims completely exposed or completely buried are plotted in the leftmost and rightmost bins, respectively.
this observation as being a result of the mare basalts being thicker in the center of the mare than those along their edges, therefore older, larger craters inside the maria are completely buried.
For all of the partially buried craters in our database, we have estimated the percentage of the crater rim crest circumference that was buried by lava flows (Figure 3b). The median percentage of rim burial of mare craters (24%) is larger than that of mare-highland boundary craters (7%). This is simply because the crater rim is never buried on the highland side of the mare-highland boundary. This figure also shows that we did not include any craters where more than 90% and less than 100% of the rim has been buried. Although we did find some short exposed crater rims that might indicate the presence of partially buried craters with rim exposure smaller than 10%, we are not confident to determine the crater center and diameter because no other indicators of the crater rim (e.g., wrinkle ridges or a topographic depression) were found that can help to outline the crater.
5. Mare Basalt Thickness Estimation
5.1. Method OverviewWe develop a method for determining the thickness of mare basalts that partially bury a crater. This method uses an initial crater topographic profile, and crater degradation is accounted for by use of a diffusive topo-graphic degradation model. Topotopo-graphic degradation occurs both before and after the emplacement of the mare basalts. Model parameters include the initial diameter of the crater (Dinit), the time at which the crater formed (tc), the time when the mare basalts were emplaced (tb), the thicknesses of the basalts exterior and interior to the crater rim (Textand Tint), and diffusion parameters that determine the rate of the topographic
degradation between crater formation and lava emplacement (𝜅c) and after lava emplacement (𝜅b). Model
parameters are then determined by minimizing the root-mean-square difference (𝜎) between the modeled final topographic profile (Hfinal) and the observed profile (Hobs):
𝜎 = √ √ √ √∑N i=1 [ Hfinal (
Dinit, Text, Tint, 𝜅ctc, 𝜅btb, z0;i
)
−Hobs(i)
]2
∕N (1)
where z0is a vertical offset between the modeled final and the observed profiles, and i is the ith of N points along the profile. Calculation of Hfinaland extraction of Hobsare discussed in section 5.4. Though we can also solve for the thickness of mare basalts that erupted interior to a crater's rim, this will not be discussed further.
Before estimating the basalt thickness exterior to the crater rim, we first calculate the FeO content of the crater rim. This step determines the composition of the surface on which the crater formed (i.e., mare or highland), which is necessary because the initial crater profile for fresh craters is slightly different in the highlands and maria (see Text S2.3 in the supporting information). Next, we mask out atypical features such as nearby craters, wrinkle ridges, and sinuous rilles. After this is done, we then produce the azimuthally averaged radial topographic profiles for the observed partially buried craters.
Given an initial crater profile (see section 5.2), we next make use of a topographic degradation model to determine how the profile varies with time. Micrometeoroid bombardment is thought to be one of the major processes that degrade craters. It can be modeled as a diffusive process, where ejecta that are newly excavated by small craters trigger downslope movement under the influence of gravity. Other processes, such as seismic shaking, can also be modeled as a diffusive process. We thus make use of the standard diffusion equation to model the evolution of surface topography (Culling, 1960):
𝜕H
𝜕t =𝜅∇2H (2)
where H is the elevation of the studied crater, t is time, and𝜅 is the effective diffusivity of all combined degradation mechanisms. We note that this approach neglects nondiffusive processes, such as burial by thick impact ejecta deposits, the formation of large craters on top of the crater being modeled, and landslides (see Richardson, 2009). Regardless, given that we mask out most regions affected by these processes when constructing the radial topographic profile, the neglect of nondiffusive processes should not affect our results in any significant manner. The above equation can be solved analytically in a cylindrical coordinate system, and the solution can be expressed as the sum of a series of Bessel functions (Xie & Zhu, 2016).
To obtain the final modeled profile, we need two steps of crater degradation. Before the eruption of the mare basalts, the initial condition is the topographic profile of the newly formed, fresh crater. After the basalt emplacement, the initial condition is the topographic profile of the crater that was just flooded by mare basalts, and then the present-day profile can be solved. Once the observed profile and a series of modeled profiles are acquired, the basalt thickness can be estimated by finding those parameters that minimize the difference between the modeled and observed profiles.
5.2. Shape of Fresh Craters
Before solving the topographic diffusion equation, we require an initial condition for the topographic profile of a fresh impact crater. Previous studies of crater degradation investigated simple mare craters (0.8 ≤ D ≤ 5km; Fassett & Thomson, 2014) and complex highland craters (20 ≤ D ≤ 166 km; Xie & Zhu, 2016), whereas our partially buried craters cover a diameter range of 1.5 to 130 km and formed on both mare and highland crust. Therefore, we need to develop a more complete series of initial crater topographic profiles for fresh impact craters. Since the crater morphology depends on crater diameter and target properties (Melosh, 1989), six types of initial crater profiles were produced in this study, including simple (1 ≤ D ≤ 15 km), transitional (15< D ≤ 20 km), and complex (D > 20 km) craters, each over the maria and highlands. For consistency with our crater degradation model, all crater profiles will be based on azimuthal averages of the observed topography.
In optical images of the Moon, rays emanating from young craters for several crater radii can be seen that result from fresh crater ejecta and secondary craters. Craters with optical rays are considered to be young (<1 Gyr; Werner & Medvedev, 2010) and these optical rays fade with time due to micrometeoroid bombard-ment and space weathering processes (Hawke et al., 2004). In a recent global search for rayed craters (Werner & Medvedev, 2010), 1,211 craters larger than 1 km in diameter were identified, from which we extracted their topographic profiles. First, craters that formed on tilted background terrain, crater/basin rim, and wrinkle ridges were removed from the database. Then, atypical features around each crater were further excluded to eliminate large-scale topography variations on the background.
In total, 57 optical rayed craters were finally selected (Figure S2), with crater diameters ranging from 1.7 to 96 km for mare craters, and from 1.4 to 139 km for highland craters. For simple craters, the morphologies are known to be diameter independent, and we rescaled the height by the crater diameter and the radial distance by the crater radius (Fassett & Thomson, 2014). As in Fassett and Thomson (2014), cubic functions were used to fit the observed profiles. For transitional and complex craters, we first derived the diameter dependence of six morphometric parameters (central peak height, central peak radius, crater floor radius, crater depth, rim height, and continuous ejecta radius). Using these key parameters, the topography of the crater was modeled as a piece-wise function using exponential functions. The detailed procedures are given in the supporting information (Text S2), and the initial crater profiles (Figure 4) can be obtained using the formulas and coefficients in Tables A1 and A2.
When estimating the basalt thickness exterior to the crater rim, the variation of the crater rim height with crater diameter and degradation state is our primary concern. Our parameterization of crater shape shows
Figure 4. Radial elevation profiles for fresh lunar craters that formed on the mare (a) and highland (b). The radial distance is normalized by crater radius, and the elevation is normalized by crater diameter. The red curves denote simple craters, the black curves are transitional craters, and the blue curves represent complex craters. The plotted initial crater diameters were carefully selected to present the results for clarity and are labeled for several curves.
that the rim height increases from 37 m to 1.4 km and from 35 m to 1.9 km for mare and highland craters with diameters of 1–100 km, respectively. For simple fresh craters, the rim height of mare craters is always slightly larger than that of highland craters (37 m vs. 35 m at 1 km, and 555 m vs. 518 m at 15 km). For transitional and complex fresh craters, the rim height of mare craters decreases with respect to highland craters with increasing diameter, becoming smaller than highland craters at 17 km (Figures S3a and S4a). As a comparison with a previous study, we note that our rim heights and those of Fassett and Thomson (2014) differ by less than 3 m for simple mare craters. When compared with the rim heights for complex highland craters in Xie and Zhu (2016) where the rim height-crater diameter relation was taken from Pike (1977), the difference first varies from 0 to 178 m with diameters of 1 to 33 km, and then increases from 0 to 705 m with diameters of 33 to 139 km. The discrepancy with the later study might arise from the following factors. First, the geologic context of highland craters is more complicated than that of mare craters, and different studies might apply different strategies to determine the background elevation and hence the rim height. Second, the topography data used and the fresh craters selected are also different. We selected 22 highland craters in the SLDEM and LOLA data and made use of azimuthally averaged profiles to calculate the rim height, which is defined as the elevation difference between rim crest and background surface (averaged from 2.5 to 3 crater radii). Pike (1977) chose 38 mare and highland craters in the Lunar Topographic Orthophotomap to derive the rim height, which is defined as the mean elevation at the crater rim minus that at the exterior rim flank foot. A more detailed comparison of crater topographic profiles between the two studies is found in Text S2.5 of the supporting information.
Regardless of any differences with previous studies, our derived morphometric parameters of fresh impact craters and the resulting initial crater profiles represent a distinct improvement. Our results are the first to consider not only the size dependence of crater morphology (simple, transitional, and complex) but also the target type (mare and highland). Our results are based on the freshest impact craters and should be more accurate than many previous investigations as we used newly acquired, high-quality elevation data sets and excluded surrounding atypical features. Lastly, we imposed the fitting functions at the simple-transitional, and transitional-complex boundaries to be continuous so that there are no abrupt changes in morphometric parameters at 15- and 20-km diameters.
It should be noted that even though we selected fresh craters with simple geologic contexts to investigate the initial crater rim height/diameter relation, natural variability of this quantity should be expected for any given crater diameter. Such variability could be the result of different impact conditions (including impact velocity and impact angle), as well as different target properties (such as porosity). This variability is quanti-fied in Table A3, where we provide the root-mean-square deviation of the measured initial rim height with respect to the predicted initial rim height as a function of crater diameter. We note that the natural variabil-ity is similar for both mare and highland craters, so we combine them into one larger data set for analysis. In particular, for simple, transitional, and complex (smaller than 50 km in diameter) craters, the natural variabilities of the initial rim height are less than 73, 125, and 271 m, respectively.
5.3. Effect of Crater Degradation on Rim Height
Given an initial crater profile, we model the crater degradation process and estimate the reduction in the rim height. As a consequence of crater degradation, the rim crest moves both downward and outward (Figure S9). In an elevation profile, this process can be seen as the rim crest at an initial position (D0, h0) moving
to (D0+ ΔD, h0− Δh), where D0and h0are initial crater diameter and rim height, and ΔD and Δh are the
increase in crater diameter and the decrease in rim height due to the erosion process. Previous studies (e.g., De Hon & Waskom, 1976; De Hon, 1979), however, used the current crater diameter (D0+ ΔD) to estimate the initial rim height. Since the current rim diameter will always be larger than the initial rim diameter, this approach will overestimate the initial height of the crater rim.
We note that the manner by which the rim height degrades with time will be discontinuous at the simple-transitional transition at 15 km. In particular, as shown in Figures S3 and S4, the rim height to crater diameter ratio is constant for all simple craters, but this ratio decreases for craters with larger diameters. In addition to this, the formulas of the crater topographic profiles interior and exterior to the crater rim also change across this morphologic transition, as we used two different connecting functions for the crater inner wall and ejecta in the simple and transitional crater regimes (Table A1). The resulting discontinuous change in slopes to each side of the rim has a strong effect on how simple and transitional/complex craters degrade. It is for this reason that we will demonstrate the degradation of simple and larger craters separately. The effect of topographic degradation on the crater rim height (Δh) is shown in Figure 5. In the upper two panels, we plot the reduction in rim height as a function of time over the past 3.9 billion years using a diffusivity of 5.5 m2/Myr (Fassett & Thomson, 2014). Results for representative crater diameters of 5, 10, 15,
20, 50, and 100 km are plotted, and we emphasize that these diameters correspond to the initial diameter (and not the final eroded diameter). For simple craters, the reduction in rim height is nearly independent of diameter. After 3.9 billion years of erosion, the rim height reduction is about 45 m for a mare crater, and 41 m for a highland crater. For transitional and complex craters, the amount of rim erosion is largest for the smallest craters, and smallest for the largest craters. Small craters simply erode faster than large craters, in part because the surface slopes decrease with increasing diameter. For mare craters, the rim erosion is about 40 m for a 20-km-diameter crater and 31 m for a 50-km-diameter crater. For highland craters, these values are larger by about 20 % and 16%.
In the lowermost panel of Figure 5, we demonstrate how the rim erosion depends upon the assumed diffu-sivity. For this plot, we considered values of 5, 10, 25, 50, and 100 m2/Myr, and then plotted the rim erosion
associated with a simple 10-km-diameter mare crater. The result shows that if this crater formed at 3.9 Ga, then the reduction in rim height could range from 43 to 184 m with an increasing diffusivity. We note that the erosion of a crater depends only upon the product of the diffusivity and time and that these two parameters are hence not independent.
Previous basalt thickness estimates that did not consider crater degradation lie between 200 and 400 m (De Hon & Waskom, 1976; De Hon, 1979). For a diffusivity of 5.5 m2/Myr, our results show that the rim height
could be reduced by up to 45 m for a 3.9-Gyr-old, 10-km-diameter mare crater (Figure 5a). However, the amount of rim erosion increases substantially with increasing diffusivity. For a diffusivity of 100 m2/Myr,
Figure 5c shows that the rim height reduction could be 184 m, which is comparable to the basalt thicknesses that were previously estimated by De Hon and Waskom (1976) and De Hon (1979).
5.4. Estimation of Mare Basalt Thicknesses
The first step in estimating the initial topographic profile of a partially buried crater is to determine whether the crater formed on a mare or highland target. The composition of the rim and proximal ejecta of the identified crater is used to determine the composition of the target. The FeO content of mare materials is typically greater than 18 wt.%, whereas that of the highland crust is typically less than about 10 wt.% (Heiken et al., 1991). We use the intermediate value of 14 wt.% to discriminate between the two target compositions. Next, we need to extract the azimuthally averaged radial elevation profiles of the partially buried craters. The elevation data were first extracted within a circular region that extends three crater radii from the crater cen-ter. Then, we excluded atypical topographic features such as small young impact craters, rilles, and faults. Finally, we defined a maximum radial range for each profile by looking for any abrupt changes in slope that might result from either a nonflat initial surface or postimpact modification processes. Only the elevations with radial distances smaller than this maximum range are compared with the modeled profiles when esti-mating the basalt thickness. Among the 74 mare craters with rims completely exposed to be studied, 11 of
Figure 5. Predicted absolute rim height reduction during the degradation process. In (a) and (b), the diffusivity was set to 5.5 m2/Myr and the results are plotted for several mare and highland craters with different diameters in simple (a) and transitional/complex regimes (b). In (c), results are plotted for a 10-km-diameter mare crater for several different diffusivities.
them have maximum radial ranges smaller than two crater radii. In this study, the radial profiles of craters smaller than 18 km in diameter were binned with a width of 100 m, whereas for craters larger than 18 km in diameter, the radial profiles were binned within 300 equally spaced annuli.
In our simulations, we used the products of diffusivity and time between crater formation and basalt emplacement Kc =𝜅ctcand after basalt emplacement Kb =𝜅btbas model parameters. This is because the
product of the two completely determines the topographic degradation, and we have few constraints on either the ages or diffusivities. For simplicity, and with no impact on our determination of the thickness of the basalts exterior to the crater, we assume that any basalts interior to the crater rim were emplaced at the same time as those exterior to the rim.
Our estimation method quantifies the misfit between the observed and modeled profiles as a function of six model parameters (see equation (1)). The initial crater diameter (Dinit) must be smaller than the final
diameter (Df), and we investigated a range from 0.6Dfto Dfwith a step size of 0.1 km. The exterior basalt
thickness (Text) must be less than the initial rim height (hr), so we investigated values from 0 to hrwith
a step size of 1 m. The interior basalt thickness needs to be less than the depth of the crater floor below the rim crest (dcf), and we investigated values up until this value with an interval of 1 m. The topographic
profile of a partially buried crater was initially shifted to a vertical position where the background (2.5 to 3 crater radii) elevation is 0, and later the vertical offset parameter z0was allowed to vary from the lowest
elevation (hr–dcf) to the highest elevation (hr) along the profile with a step size of 1 m. The upper limit of the product of diffusivity and time after crater formation (Kmax =Kc+Kb) is more difficult to constrain a priori. Nevertheless, it was suggested that the diffusivity could be expressed as the product of the diffusivity at a reference scale (e.g., 1 km) and the crater diameter to the power of about 1 (Xie et al., 2017). In our simulations, Kmaxfor crater formation was assumed to be equal to 5.5 × 3,900 × Dfm2, where 5.5 m2/Myr
is a reference diffusivity for a 1-km crater (Fassett & Thomson, 2014) and 3,900 Myr is an upper limit for the crater age in our study (Stöffler & Ryder, 2001). We used a step size of 500 m2for the diffusivity-time
product. After performing our simulations, we checked to ensure that our chosen maximum value for the product did not correspond to the best fitting value and that the maximum value was sufficient to obtain an error bar for the diffusivity-time product.
Two of the outputs from the basalt thickness estimation model are the products of diffusivity and time before (Kc = 𝜅ctc) and after (Kb = 𝜅btb) the emplacement of mare basalts. If an age for the mare basalts can be obtained, such as from crater counting, then it would be possible to determine the absolute value of the topographic diffusivity. In particular, the average diffusivity since the eruption of the basalts is given by 𝜅b=Kb∕tb. Furthermore, if we assume that the diffusivity was constant at all time (𝜅c=𝜅b), then we can
estimate when the crater formed (tc= (Kc+Kb)∕𝜅b).
When performing the numerical inversion for the best fitting parameters and uncertainties, one would ideally like to perform a global exhaustive search of the parameter space. Given the number of free param-eters and their extensive ranges, however, this task would have been computationally prohibitive. In order to reduce the computation time, a global optimization algorithm using the sequence quadratic poly-nomial technique (Schittkowski, 1986) was used to search for the best fitting model parameters in the six-dimensional parameter space. This method uses a series of quadratic polynomial functions to approx-imate the nonlinear objective function, and the global optimal solution is found by searching along the direction with the largest gradient in the model parameter space. In this study, the Global Optimization Toolbox in MATLAB (MathWorks Inc, 2017) was used to solve this optimization problem.
We tested the applicability of this optimization algorithm in two different ways. First, we conducted a for-ward simulation of a 3-Gyr-old, 10-km-diameter mare crater that was embayed by basalt flow with an assumed thickness of 43 m, and then ran the global optimization toolbox to search for the basalt thickness. The result shows that the obtained basalt thickness differs only by 1 m with respect to the true value. Sec-ond, we varied the number of starting points used to initialize the optimization in the toolbox where each starting point consists of initial guesses for the six parameters in equation (1). We increased the number of starting points from 20 to 100 and set the initial values to be uniformly distributed in the parameter space. We found that, although different starting points gave slightly different results, the final results were all within the uncertainties obtained from our numerical inversion, as described below. Therefore, we can conclude that this global optimization toolbox converges adequately to the global minimum.
Figure 6. Elevation map (a) and radial elevation profiles at different points in time (b and c) for the crater Seleucus (D=45.3km). In (a), the red star denotes the crater center, the black solid circle shows the boundary within which the azimuthally averaged radial profile was extracted, and the white boxes show the regions excluded from the elevation data. In (b) and (c), the red, green, blue, magenta, and black curves represent the initial crater profile, the profile just before mare flooding, the profile just after mare flooding, the final present-day profile, and the observed profile. Panel (c) shows a zoom-in around the crater rim, which corresponds to the black box in (b).
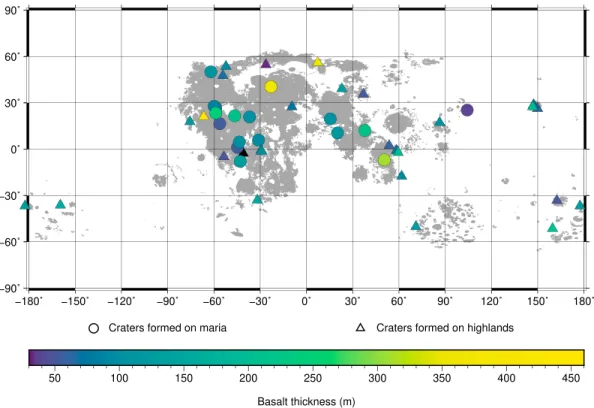
Figure 7. Basalt thickness estimates from craters with rims completely exposed on the maria. Craters that formed on maria and highlands are denoted by filled circles and triangles, respectively. The lunar maria basemap (gray) is from Nelson et al. (2014), and the basaltic unit boundaries (white) are from a compilation of previous studies (Hiesinger et al., 2006, 2011; Morota et al., 2009, 2011; Pasckert et al., 2018).
The largest source of uncertainty in our numerical inversions is by far related to the natural variability of the rim height of the initial fresh crater. We first quantified this by performing three inversions: one using the nominal initial topographic profile for fresh craters, and two using initial topographic profiles where the rim height was modified by the ±𝜎 natural variability as quantified in section 5.2 and Table A3. The best fitting model parameters for these three cases were obtained using the procedure described above. Not surprisingly, the thickness of the mare basalts exterior to the crater for the two modified initial crater profiles differs with respect to that for the nominal profile by the uncertainty in the initial rim height. After obtaining the best fitting parameters for the three initial topographic profiles, for each case we next used a simplified one-dimensional search to determine the uncertainties of the six model parameters. With the model parameters set to the best fitting values, the misfit was calculated by varying a single parameter. The 1𝜎 limits of this parameter were then defined as those values that could fit the observations to within a maximum allowable misfit. This maximum allowable misfit was defined as the global minimum found by the optimization toolbox plus the average standard error of the observed elevation profile. The standard error here is an estimate of how uncertain the mean elevation of the observed profile is at each radial distance, and the average standard error of the entire elevation profile of the selected 41 partially buried craters (see section 6) ranges from 1 to 6 m with a mean value of 3 m. We note that this technique for determining the limits of the parameters does not consider correlations with the other five parameters: quantifying such correlations by computing the full six-dimensional misfit function would be computationally demanding. Finally, we define the 1𝜎 limits for each parameter as the maximum and minimum 1 𝜎 limits of the three inversions using the three separate initial crater profiles.
6. Mare Basalt Thickness Estimation Results
Before presenting the best fitting results, we first describe the details of a single representative inversion for the crater Seleucus (21.08◦N, 66.67◦W; D = 45.3 km; Figure 6a). This crater has a rim that is completely exposed and is located on the western margin of Oceanus Procellarum, and it was selected because it is one of the most degraded and best fitting craters in our crater database. Based on the best fit model parameters
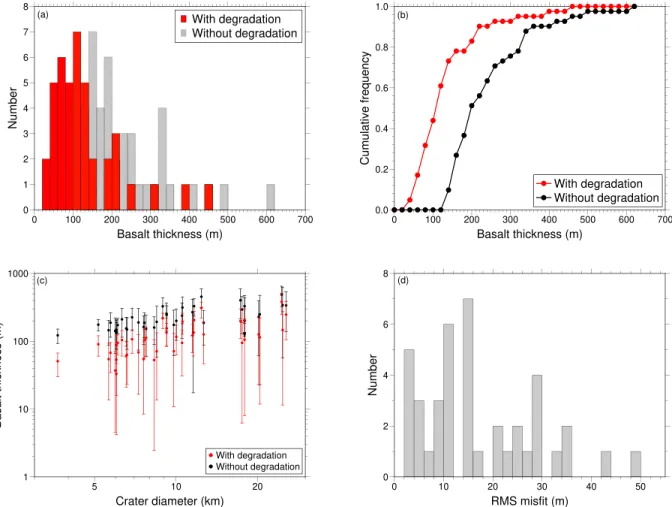
Figure 8. Histograms (a) and cumulative distributions (b) of basalt thicknesses with (red) and without (black) considering crater degradation. Basalt thicknesses as a function of crater diameter with (red) and without (black) considering the crater degradation process (c). Histogram of the root-mean-square (RMS) misfits between the modeled and observed profiles (d). The downward pointing arrow at 17.9 km in (c) indicates that the lower limit is 1 m.
determined by the crater degradation model, the history of Seleucus can be described as follows (Figures 6b and 7c). First, the crater formed on a highland target given that the FeO content of the exposed crater rim and proximal ejecta is about 12 wt.%. The initial crater diameter was 45.2 km with a rim height of 1,168 m (red), and given the crater size, it should have formed with a central peak. Between the times of crater formation and mare flooding, the crater rim height degraded by 73 m to 1,095 m (green). Then, mare basalts with a thickness of 455 ± 264 m erupted outside the crater rim partially flooding the crater ejecta, and mare basalts erupted inside the crater interior nearly completely burying the central peak. The crater profile then continued to erode to the present state, obtaining a rim height of 960 m with respect to the preflooding background. Thus, from crater formation to the present time, the rim was reduced in height by about 208 m. If rim erosion was not considered, the mare basalt thickness would be estimated to be 663 m, which is considerably larger than when considering crater degradation.
In this study, basalt thicknesses were estimated around 74 mare craters with rims completely exposed. Some of these craters either fit the observations poorly or had large uncertainties. Thus, we first discarded craters that had atypically high misfits (larger than 50 m). We then removed from further consideration craters where the 1𝜎 lower limit in the basalt thickness was equal to 0. In the end, we were left with 41 craters that were considered for further analyses, among which 16 formed on mare basement (circles) and 25 formed on highland basement (triangles; Figure 7). The crater diameters vary from 3.7 to 45.3 km, and the obtained basalt thicknesses range from a minimum of 33 m to a maximum of 455 m (Figures 8a–8c and Table A4). There is no clear pattern of the derived basalt thicknesses when plotted in map form. This is to be expected because two adjacent partially buried craters could have formed at different times and could have been embayed by different thicknesses of basaltic flows.
Figure 9. SELENE TC optical image (a) and SELENE MI-derived TiO2abundance map (b) near crater Bobillier (D=6.9km). In (b), the basalt thickness
estimated from the crater degradation model surrounding the crater Bobillier is labeled in red, and those based on crater excavation depths are given in black (Ishiyama et al., 2013). Basaltic units are outlined in black and are labeled by the unit names and ages from Hiesinger et al. (2011). The ground track where SELENE LRS data (Data ID: LRS_SAR05KM_C_25N_016214E, LRS_SAR05KM_C_20N_016273E, and LRS_SAR05KM_C_15N_016329E) were obtained is denoted by the north-south dashed line. In (c), the calculated basalt thicknesses from the radar data are presented using a range of porosities from 0% to 45% where 0 porosity is denoted by the leftmost black line. SELENE TC = Selenological and Engineering Explorer Terrain Camera; MI = Multi-band Imager; LRS = Lunar Radar Sounder.
Figure 8c shows that there is a positive correlation between the estimated basalt thickness and crater diam-eter. This is simply because the crater rim height, which is the maximum thickness that can be retrieved from our method, increases with crater diameter (Pike, 1977). For the studied partially buried craters, the root-mean-square misfits (Figure 8d) between the best fitting and observed profiles are smaller than 50 m, with an average of 17 m. The initial crater diameter is found to be on average 95% of the observed value. The uncertainty in the basalt thickness is on average 67 m. The thicknesses of basalts in the interiors of 36 craters were also estimated, and these are 1,073 m on average (note that the crater floor is much deeper than the preflooding background).
If crater degradation was not included, these thicknesses would be considerably larger, ranging from 122 to 613 m. To be comparable with our obtained results, these results are based on the initial rim height-crater diameter ratio derived in this study instead of Pike (1977), and the initial rim height was estimated from the observed, present-day crater diameter. In this case, the median and average basalt thicknesses are 200 and 238 m, in comparison to the values of 105 and 130 m obtained when considering crater degradation. The ∼100-m overestimate in the average basalt thickness when neglecting degradation is therefore about 25–50% of the average value (200–400 m) that was previously estimated by De Hon and Waskom (1976) and De Hon (1979).
7. Discussion
7.1. Comparisons With Other Techniques
In this section, we compare our estimated mare basalt thicknesses with other techniques, including crater excavation depths, radar sounding observations, lava flow front measurements, and gravity constraints. In southern Mare Serenitatis, a partially buried crater named Bobillier (19.61◦N, 15.44◦E; D = 6.9 km) was identified (Figure 9a). For this crater, the TiO2content of the western and southern crater ejecta (>5 wt.%)
is distinctly higher than that of the surface lava flow flooding the distal ejecta (3–4 wt.%; Figure 9b). Our simulation shows that the mare basalt emplaced on Bobillier's ejecta is 107 ± 41 m in thickness, which we interpret as corresponding to the thickness of the unit S13 (Hiesinger et al., 2011) in this image. Coinci-dently, in the same basaltic unit S13 five craters (black boxes) were identified by Ishiyama et al. (2013) with different TiO2contents (Figure 9b) in their ejecta. These craters penetrated through the surface unit and