Publisher’s version / Version de l'éditeur:
Vous avez des questions? Nous pouvons vous aider. Pour communiquer directement avec un auteur, consultez la première page de la revue dans laquelle son article a été publié afin de trouver ses coordonnées. Si vous n’arrivez pas à les repérer, communiquez avec nous à PublicationsArchive-ArchivesPublications@nrc-cnrc.gc.ca.
Questions? Contact the NRC Publications Archive team at
PublicationsArchive-ArchivesPublications@nrc-cnrc.gc.ca. If you wish to email the authors directly, please see the first page of the publication for their contact information.
https://publications-cnrc.canada.ca/fra/droits
L’accès à ce site Web et l’utilisation de son contenu sont assujettis aux conditions présentées dans le site LISEZ CES CONDITIONS ATTENTIVEMENT AVANT D’UTILISER CE SITE WEB.
Internal Report (National Research Council of Canada. Institute for Research in Construction), 1998-03-01
READ THESE TERMS AND CONDITIONS CAREFULLY BEFORE USING THIS WEBSITE.
https://nrc-publications.canada.ca/eng/copyright
NRC Publications Archive Record / Notice des Archives des publications du CNRC :
https://nrc-publications.canada.ca/eng/view/object/?id=770bed80-ec9d-46e1-8823-78a001cde2fb https://publications-cnrc.canada.ca/fra/voir/objet/?id=770bed80-ec9d-46e1-8823-78a001cde2fb
NRC Publications Archive
Archives des publications du CNRC
For the publisher’s version, please access the DOI link below./ Pour consulter la version de l’éditeur, utilisez le lien DOI ci-dessous.
https://doi.org/10.4224/20331503
Access and use of this website and the material on it are subject to the Terms and Conditions set forth at
Investigating the Cause of Blistering in SBS Polymer Modified-Bitumen Roofing Membranes
National Roofing Contractors Association (USA); National Research Council of Canada
: ,. , , , ,
NATIONAL
ROOFING
r , , . , ,.-. , , .. .CONTRACTORS
ASSOClAnON
a m , Canada KIAOR6INVESTIGATING THE CAUSE OF BLISTERING IN
SBS POLYMER MODIFIED-BITUMEN
ROOFING MEMBRANES
j fl$i;*r,.):,,j. rc:t.. ,.,,-..
. , ~ ,<
J ,-.17 t.. ;. I:, ,,! t (5 1-\j
:~;l.;:;f .., r ':j r ,,.A Joint-Research Project undertaken
by
the
National Roofing Contractors Association (USA)
and the
National Research Council of Canada
Institute for Research in Construction
TABLE OF CONTENTS TABLE OF CONTENTS LlST OF TABLES LlST OF FIGURES . . . . 1 SUMMARY
2 OBJECTIVES AND SCOPE 3 EXPERIMENTAL
3.1 Materials
3.2 Mechanical Testing of Membrane Samples 3.3 GCIMS Analysis of Gas Samples
3.3.1 Water Content
3.3.2 Volatile Organic Compounds 3.4 Characterization of the Mopping Asphalt
3.4.1 Mopping Asphalt Type
3.4.2 Thickness of Mopping Asphalt
3.5 Characterization of the Membrane - Mopping Asphalt lnterface 3.5.1 Contact Compatibility
3.6 Characterization of the Modified bituminous Membrane
3.6.1 Blending of Polymer Matrix in the Modified bituminous Membrane 3.6.2 Polymer Content in the Modified bituminous Membrane
4. RESULTS
4.1 Mechanical Testing of Membrane Samples 4.2 GCIMS Analysis of Gas Samples
4.2.1 Water Content
4.2.2 Volatile Organic Compounds 4.3 Characterization of Mopping Asphalt
4.3.1 Mopping Asphalt Type
4.3.2 Thickness of Mopping Asphalt
4.4 Characterization of the Bitumen - Mopping Asphalt lnterface 4.4.1 Contact Compatibility
4.4.2 Visual Examination
4.5 Characterization of the Modified bituminous Membrane
4.5.1 Blending of Polymer Matrix in the Modified bituminous Membrane 4.5.2 Polymer Content in the Modified bituminous Membrane
5. DISCUSSION
5.1 Mechanical Testing of Membrane Samples 5.2 GCIMS Analysis of Gas Samples
5.3 Properties of the Roofing Systems 5.3.1 Mopping Asphalt
5.3.2 Modified bituminous Membrane 5.3.3 Membrane / Mopping lnterface
6 CONCLUSIONS 7 REFERENCES NRC-IRCINRCA page i ..-. . .
c
: a .. , i: ..-
LlST OF TABLES
Table Description
3.1 Summary of samples received
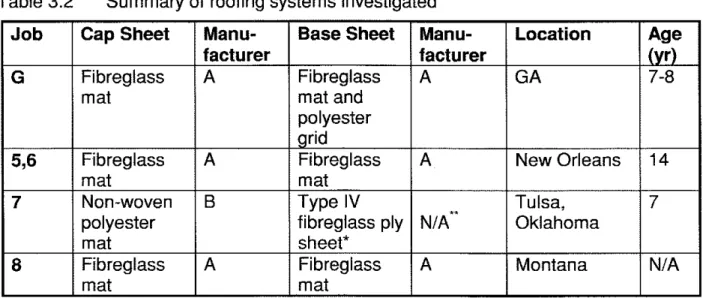
3.2 Summary of roofing systems investigated
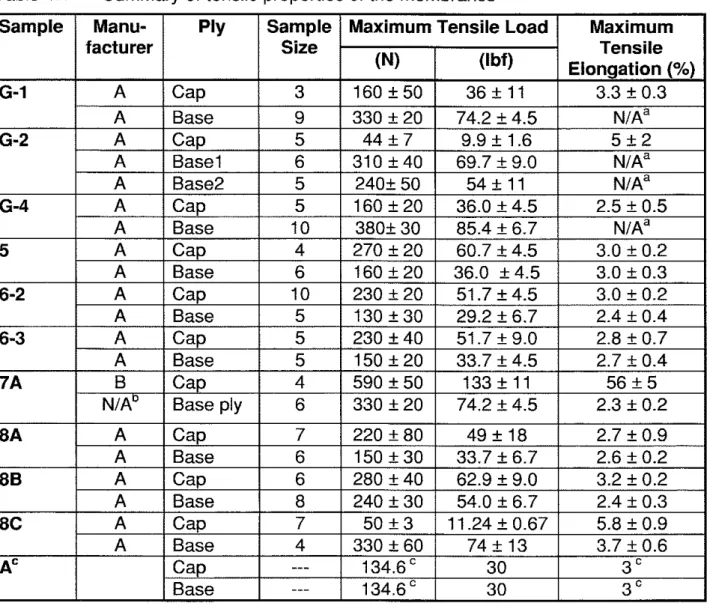
4.1 Summary of tensile properties of the membranes
4.2 The softening points and presumed types of the mopping asphalts
4.3 Polymer content in modified- bitumen membranes
Figure
3.1
LlST OF FIGURES
Description
Dimensions of the tensile specimen
Typical cross-section of a roofing membrane observed under a light microscope (membrane 7 0 at a blister)
Typical tensile force-displacement curves of (a) membrane G (b) membranes 5 and 6 (c) membrane 7 and (d) membrane 8
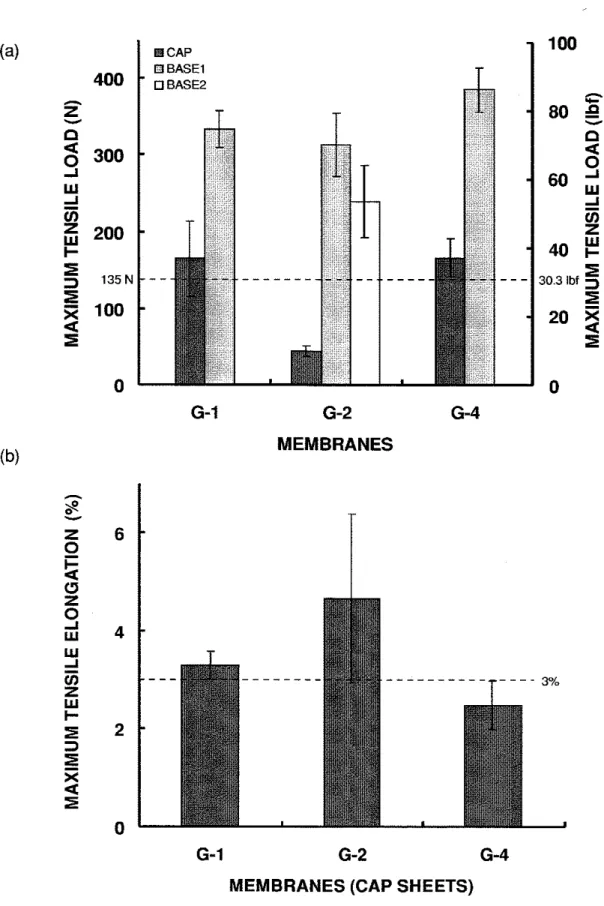
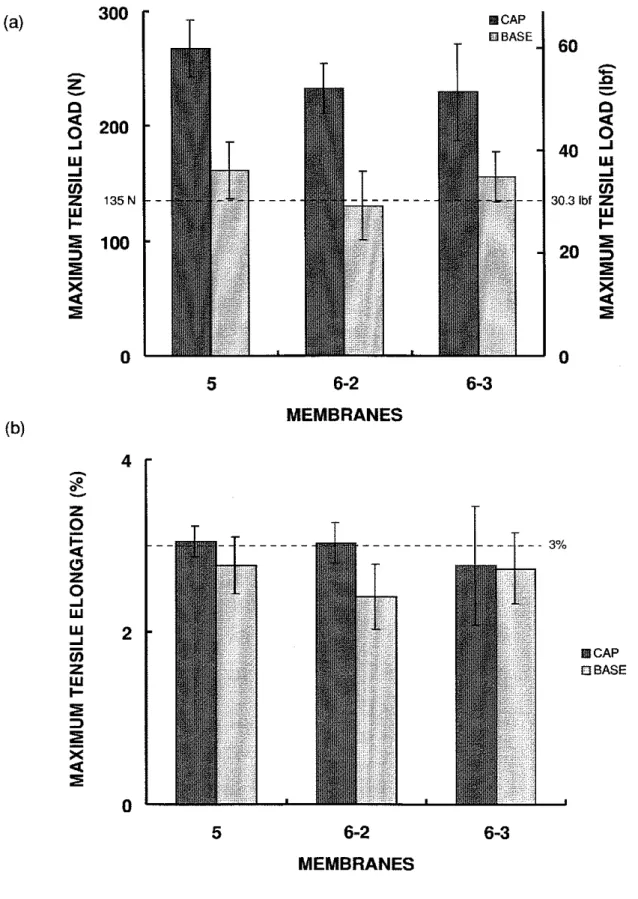
~ a x i m u m tensile (a) load and (b) elongation of membrane G Maximum tensile (a) load and (b) elongation of membranes 5 and 6
Maximum tensile (a) load and (b) elongation of membranes 7
and 8
Water concentration in gas within roofing blisters
Quantity of mopping asphalt in different roofing systems Example of failure at cap sheet I mopping interface (a) cap sheet (b) base sheet (membrane G-1)
Example of discontinuity in mopping (membrane 5-1) Example of uncoated spots (membrane 7 8 )
UV fluorescent micrograph showing bitumen dispersion in membrane G (a) cap sheet and (b) base sheet
UV fluorescent micrograph showing bitumen dispersion in membrane 5 (a) cap sheet and (b) base sheet
UV fluorescent micrograph showing bitumen dispersion in membrane 6 (a) cap sheet and (b) base sheet
UV fluorescent micrograph showing bitumen dispersion in cap sheet of (a) membrane 7 and (b) membrane 8
UV fluorescent micrograph showing bitumen dispersion in a new modified bituminous membrane
Page
3
Page
4
Blistering in SBS Polymer Modified bituminous Roofing
Membrane Systems
1. SUMMARY
The cause of blistering in modified bituminous roofing membrane systems was investigated. Membrane samples were removed from several existing modified bituminous roofs containing blisters. Their mechanical behaviour was characterized by tensile tests. Gas content within the blisters were collected in canisters in the field and their chemical composition was determined quantitatively by Gas Chromatography /
Mass Spectroscopy (GUMS).
Mechanical testing indicates that blister formation does not seem to depend on the strength of the modified bituminous membrane. Also, the existence of blisters did not reduce the strength of the membrane, at least not where the blister remained intact. GC/MS revealed that the gas within the blisters was composed mainly of air and water vapour, with a negligible amount of volatile organic compounds. The relative humidity of the blister gas ranged from 30 to 75%. These findings indicated that the mechanism of blister formation and growth in modified bituminous roofs is possibly the same as that in built-up roofing where water vapour promotes blister growth by exerting cyclic pumping action to the blister following the diurnal changes in temperature.
The physical properties of the membranes and the mopping asphalt were also studied. The polymer content in the modified bituminous membranes was determined by infrared spectroscopy to be 6 to 11 weight percent. The blending between the polymer and the asphalt was found to be uniform in most cases as examined by ultra- violet florescent microscopy. Both polymer content and blending were not significantly affected by a combination of aging, weathering and stresses. The softening points of the mopping asphalts exceeded the upper limit of Type IV asphalt in most cases. The high values may be due to aging of the asphalts. The quantity of mopping asphalt was determined to be 1 to 2 mm (0.04 to 0.08 in.) or 1 to 2 kg/m2 (20.5 to 41 lbt100 ft2) from examination of polished cross-sections of the membranes using an optical microscope. The high values indicated that the application temperatures might have been too low and hence the viscosity of the asphalts too high in many cases. These factors could promote mopping skips. Visual examination of the membrane surfaces inside the blisters revealed three types of failure surfaces: cap sheet I mopping interface (membranes G and 8), discontinuities in mopping (membranes 5 and 6) and uncoated spot (membrane 7). They were due to mopping at improper viscosity and poor wetting between the mopping asphalt and the membranes.
2. OBJECTIVES AND SCOPE
The objective of this project is to investigate the cause of blistering in polymer- modified bituminous roofing membrane systems. Membrane samples were removed from several existing modified bituminous roofs containing blisters. Their mechanical behaviour was characterized by tensile tests. Gas content within the blisters were collected in canisters in the field by NRCA and their chemical composition was determined quantitatively by Gas Chromatography 1 Mass Spectroscopy (GCIMS).
The physical properties of both the membranes and the mopping asphalt were also studied. The polymer content in the modified bituminous was determined quantitatively by infrared spectroscopy while the blending between the polymer and the asphalt was examined by ultra-violet florescent microscopy. The mopping asphalt was characterized by its softening point and the mopping thickness was determined from polished cross-sections of the membranes using an optical microscope. The contact compatibility between the mopping asphalt and the modified bituminous membrane was also investigated. In addition, visual examination of the membrane surfaces inside the blisters gave important information about their formation and growth.
3. EXPERIMENTAL
3.1 Materials
A total of 16 modified bituminous roofing membrane samples and 13 canisters containing blister gases were received. They are summarized in Table 3.1. The roofing membranes were directly removed from the roofing systems containing blisters in five different locations. The gas samples were collected in evacuated canisters by puncturing the blisters in the field. All the samples were collected by NRCA representatives and sent to the IRC laboratory.
3.2 Mechanical Testing of Membrane Samples
All samples consisted of a cap sheet and a base sheet, except G-2, which has an extra layer of base sheet; and membrane 7, which has ply sheets instead of a base sheet. The machine direction was not marked on the samples and could not be determined. A summary of the roofing systems investigated in this project is shown in Table 3.2.
A pneumatic die press was used to cut the membrane into dumbbell-shaped specimens with a constant width of 25 mm (1 in.) in the gauge section (The dimensions of the specimen are shown in Figure 3.1). Individual layers of membrane were separated carefully with the help of a chisel. The tensile properties of the modified bituminous membrane samples were determined according to ASTM D 51 47-95 [I].
Table 3.1 Summary of samples received
since they were similar
X = present Action: T =test State: B = blistered
Table 3.2 Summary of roofing systems investigated
* No styrene-butadiene-styrene (SBS) modified bituminous layers ** NIA = not available
-
25mm( 1 in)
37.5 mm -'
.* I.
75 m 37.5mm
'
(I s in) (5 in) (1 5 in)
Figure 3.1 Dimensions of the tensile specimen
The specimens were tested using an lnstron 4502 Automated Materials Testing System. The gauge length of the specimen and the grip separation were 75 mm (3 in.). The specimens were tested at a constant crosshead speed of 50 mmlmin (2 in./min) using a load cell of 1 -kN (225-lbf) capacity. The load and elongation data were recorded by a data acquisition system. The testing laboratory was kept at a constant temperature of 23 ? 2 "C (73.4 k 3.6 OF) and a relative humidity (RH) of 50 ? 5%.
The thickness of the individual membranes varied greatly because of the large variability in the thickness of the mopping asphalt. Since the asphalt is weak compared to the reinforcement, it was not expected that the mopping asphalt on the surface of the specimen will affect the strength significantly. Nevertheless, preliminary tests were performed and the results agreed with our prediction. Therefore, the mopping asphalt on the surface of the specimen was not removed.
3.3 G U M S Analysis of Gas Samples 3.3.1 Water Content
The water vapour content of the gas within a blister was analyzed using a GCIMS system. The setup included a Hewlett-Packard Gas Chromatograph Model 5890 equipped with a low-polarity DB-5MS column and an upgraded Mass Selective Detector (MSD) Model 5970. The GC first separates the gas sample into different components in its 60-m X-0.25 mm (197-ft by 0.01-in.) capillary column, which were then detected according to their atomic mass by the connecting MSD.
Aliquots of blister gas were sampled from the canisters using a 250-pL airtight Hamilton syringe equipped with a shut-off valve that provided a locking mechanism. As some of the canisters were at pressures below ambient, the following procedure was applied to prevent infiltration of ambient air and moisture into the syringe:
The needle was inserted into the canister's septum and a nominal 250 pL was sampled. The content was then locked out by closing the valve. The needle was withdrawn from the septum and the syringe content compressed to approximately 60% of the initial volume. The valve was opened and the excess content expelled. The plunger was then moved until only 100 pL of specimen, brought up to ambient pressure, was left and this amount was injected into the GC column. At least two runs were performed for each canister sample.
RH standards were prepared by dissolving large amounts of inorganic salts in distilled water in 30-mL glass vials with Teflon-lined septum screw caps to obtain their saturated solutions. Six inorganic salts with tabulated RH values in the literature were selected to cover a range of 32 to 92% RH. The standards were kept at room temperature in the laboratory for at least 48 hours, and the presence of excess solid in equilibrium with the saturated aqueous solution was confirmed before analysis. A minimum of 3 runs was performed for each standard.
The GSIMS system was run for Mle = 10 to 50 to collect total ion chromatographs (TIC). Subsequently, using single ion extraction (SIEx), the ions corresponding to nitrogen, oxygen and water fragments were extracted and their peak ion counts determined. To counteract the instabilities and remove variations in the detector sensitivity, the water ion counts were normalized with the oxygen counts. The machine was first calibrated using the RH standards and then the RH of each blister gas samples determined.
The initial pressures of the canisters were measured using a vacuum gauge when the gas samples arrived at the laboratory. Some of the canisters containing blister gases were not completely filled and had pressures as low as -16 kPa (-2.3 psi). It was found that the empty canisters had pressures ranging from -90 to -95 kPa (-13.0 to -13.8 psi). The supplier of these canisters was contacted about this pressure variation but the company did not have any information about the initial pressure of their canisters. As a result, an initial pressure of -95 kPa (-13.8 psi) was used in the calculations. The RH results in this report have been adjusted to account for these dilutions in the canisters.
Since RH values are temperature dependent and the temperature in the field at the time of sampling was most likely different from that of our laboratory, adjustment in the RH values was necessary. Using a psychrometric chart [2], the results were adjusted to reflect the field conditions.
3.3.2 Volatile Organic Compounds
The volatile organic compounds (VOCs) of the gas within a blister were also analyzed using a GCIMS system. The content of each canister was transferred to a sorption tube by "sweeping" via a long, small diameter needle (gauge 22) inserted through the septum and connected to a suction pump placed downstream from the tube. The transfer was aided by a stream of make-up air delivered to the canister through a needle of smaller gauge from a high-pressure cylinder of compressed Ultra- Zero Air (Matheson Gas). To ensure complete transfer of the content, each canister was flushed with 3 L (0.79 gal.) of air, which was equivalent of over 10 air exchanges.
The tube was desorbed on an Envirochem desorber with a stream of helium at approximately 225 OC (437 OF) and was preconcentrated on two internal traps of progressively smaller diameter before going into the GCIMS. When the VOCs were released from the sorption tube, the stream was split: 4% of the VOCs stream was directed to a flame ionization detector (FID) for monitoring while the rest was concentrated on trap # I . When trap #I was heated, the released VOC stream was again split: 4% of the VOCs stream was directed to the FID for total VOC (TVOC) content determination while the rest was passed to the GCIMS for analysis and identification. The GC oven, which was kept at -50°C (-58°F) during the desorber-to- column transfer, was then heated at a rate of 10 "Clmin (1 8 "Flmin) to 220 "C (428 OF) and held there for 2 min.
The peaks on the GCIMS TICS were identified and the areas integrated with specific parameters. Peak identification was confirmed by SlEx and, whenever possible, retention time matching with a collection of laboratory spectra of known species. The analysis was facilitated by a proprietary Hewlett-Packard peak-matching algorithm and a reference library from NlST containing 75,000 compounds.
For the purpose of comparison, small strips of roofing membranes were cut and placed in Teflon-lined septum capped vials. Both cap and base sheets of membrane samples G-3, 5, 7 and 8 were tested simultaneously. The vials were incubated at 30 "C (86 OF) for at least 24 h. A 1-ml aliquot of the head space from each vial was sampled by an airtight syringe and deposited in a sorption tube. The content of the tubes was analyzed using the same GCIMS procedure as the VOCs determination.
3.4 Characterization of the Mopping Asphali
3.4.1 Mopping Asphalt Type
Mopping asphalt is often categorized by its rheological properties such as softening point. The softening points of the mopping asphalts used in these samples were determined by ASTM D36-95 (the ring-and-ball test) [3].
Individual membranes with mopping asphalt adhering to them were put into a freezer at -40 "C (-40 OF) overnight. When the sample became cold and brittle, the mopping asphalt was removed from the membrane as much as possible with a chisel. Approximately 50 g was collected from each roofing sample and stored in a tin can.
The capped tin can was heated up, either in an oven (for temperatures less than 250 "C (482 OF) ) or on a hot plate (when a higher temperature was required), until the mopping asphalt was liquid enough for pouring. Care was taken to minimize the heating time since prolonged re-heating of asphalt may affect its rheological properties. A slight excess of the liquid asphalt was poured into two brass rings sitting on a piece of paper coated with silicone for release. The samples were allowed to cool at room temperature. When the specimens had cooled, the excess asphalt was cut away cleanly with a slightly heated knife so that each disk was flush and level with the top of its ring.
The brass rings containing the specimens were placed on the ring-and-ball apparatus. With the help of a ball-centering guide, a steel ball was placed in the centre of each disk using a pair of forceps. The apparatus was put in a glycerine bath. The whole assembly was heated on a hot plate at a rate of 5
+
0.5 "Cimin (9+
0.9 "Flmin). The temperature at the instant when the asphalt surrounding the ball touched the bottom plate of the assembly was recorded as the softening point. If the difference between the two results was greater than 1 "C (1.8 OF), another run was performed for confirmation.3.4.2 Thickness of Mopping Asphalt
A rectangular specimen approximately 25 by 10 mm (1 by 0.4 in.) in size was randomly selected and cut from each membrane. The granules on the cap sheet and the remains of the insulation facer on the base sheet were removed. The cross-section of the specimen was secured with a double-sided tape to a disposable, mounting cup, which was then filled with mounting cement. After the cement block, containing the embedded specimen had solidified at room temperature, it was put into a freezer overnight at -40 "C (-40 OF).
To facilitate metallographical grinding and polishing of the cross-section, the cold cement block was put on top of a pool of liquid nitrogen in a cold vessel. It was secured in a holder so that the distance between the specimen and the surface of the liquid nitrogen can be adjusted easily to obtain different cooling temperature. The temperature of the block was estimated to be in the range of - 6 0 to -80 "C (-76 to -1 12 OF). When the specimen became very brittle, the block was taken out of the cold vessel and wet abraded quickly on a grinding wheel for about 30 s. It was then returned to the liquid nitrogen vessel, until it was brittle enough for further grinding. The grindingicooling process was repeated several times with progressively finer sandpaper (#400, #600 and #1200). Finally, the block was metallographically polished with progressively finer alumina powder (9.5, 0.3 and 0.05 pm) using the same coolingipolishing cycle until a mirror-like surface was obtained.
The metallographically polished cross-section was examined using an optical microscope (Nikon Optiphot-2) equipped with an image analysis system (Clemex
Vision). The cross-sections were magnified about 440X and were captured by a digital camera and stored on a computer. (A typical image is shown in Figure 3.2). The thickness of the mopping asphalt was measured on screen digitally across the cross- section at an interval of 500 pm. The average and the standard deviation were computed. In addition, the thickness of the mopping asphalt at the lap was determined for membrane samples with a cap sheet lap.
aacks caused by freezing during polishing process
Figure 3.2 Typical cross-section of a roofing membrane observed under a light microscope (membrane 7D at a blister)
3.5
Characterization of the Membrane - Mopping Asphalt Interface3.5.1 Contact Compatibility
The contact compatibility between the mopping asphalt and the modified bituminous membrane was evaluated with ASTM D1370-84 [4]. This test was originally designed for evaluating the contact compatibility between the saturant and coating asphalt used in the manufacture of prepared roofing.
Mopping asphalt was removed from the membranes as described in Section 3.4. About 50 g of asphalt was collected for each membrane and was stored in a tin can. The membranes were wiped with trichloroethylene to remove the remaining traces of mopping asphalt.
A square with side of 55 mm (2.2 in.) long was cut from the flattest part of the cleaned membrane. A preliminary dusting of talc (oven dried at 110 "C (230 OF)) was applied by covering the specimen with talc and removing the excess, non-adherent dust by inverting the specimen and carefully dropping it from approximately 25 mm (1 in.) onto the open end of a 250-ml beaker. The final dusting was made by applying talc through a 45-ym (#325) sieve, held above the specimen, by gently tapping the sieve until a smooth, uniform film of talc weighing 0.60
+
0.06 g (a surface density of 0.02 g/cm2+
10%) was applied. Note that the talc density used was 5 times as high as that recommended by the ASTM standard (a surface density of 0.004 g/cm2+
10%). This was required because preliminary trials of the test showed that a substantial amount of organic substances was released from the modified bituminous square during heating which tended to "soak up" the talc. This interfered with the observation and measurement of the oily ring formed since the talc was not visible as a white background. Using the most severely affected membrane as a reference, the minimum surface density of talc required to obtain a reasonably good background was determined to be 0.6 g/cm2.The mopping asphalt was heated in a tin can on a hot plate. When it became liquid, a fine wire, 1.0 mm (0.04 in.) in diameter, was dipped into the molten asphalt. After the excess molten asphalt was drained off, drops were allowed to fall on the talc- covered specimen from a height of about 50 mm (2 in.) to form substantially spherical drops 3.0
+
0.5 mm (118+
1/64 in.) in diameter. At least two drops were applied to each specimen. The same procedure was applied to a set of talc covered tin caps sewing as control. The specimens and the controls were placed into an oven.Preliminary tests showed that the oven temperature recommended by ASTM standard (50 "C or 122 OF) was not suitable for our mopping asphalts because of the relatively high softening points. The author of this test has used an oven temperature about equal to the mid-point of the softening point range of the tested asphalts [5]. Trial runs have also indicated that the asphalt drops flow and flatten on the membrane at temperature close to their softening points. It was therefore decided to place the prepared specimens in ovens maintained at the softening points of the mopping asphalts for 72 h. After cooling, the specimens were examined for any oily ring formed around the periphery of the drop. The width of the oily ring, the distance from the line of contact of talc and drop to the outer limit of the oily ring, was recorded.
3.6 Characterization of the Modified bituminous Membrane
3.6.1 Blending of Polymer Matrix in the Modified bituminous Membrane
A strip, approximately 25 by 150 mm (1 by 6 in.), was cut from each modified bituminous sheet. It was then loaded in an lnstron universal-testing machine equipped with an environmental chamber, which was maintained at -70 "C (-94 O F ) using liquid
nitrogen. After the strip was cooled, it was loaded in tension. A utility knife was then used to cut sharply into the edge of the stressed strip to induce a fast fracture. This created a relatively flat fracture surface, which was examined using ultra-violet (UV) fluorescent microscopy. An optical microscope (Nikon Optiphot4) equipped with a UV lamp was used for this examination.
3.6.2 Polymer Content in the Modified bituminous Membrane
The polymer content in the modified bituminous membranes was determined by infrared (IR) spectroscopy. Small pieces were cut from each roofing membrane. The granules on the cap sheet and the remains of the insulation facer on the base sheet were removed. Approximately 1.2 to 1.5 g of the sample was dissolved in a 25-ml volumetric flask using reagent grade carbon disulphide (CS2). To ensure that all soluble matters were dissolved, the solution was allowed to stand for at least one hour before the analysis. Standard solutions were prepared by dissolving 0.1 1 to 0.14 g of Kraton (SBS block copolymer by Shell) in 25 ml of CS2. At least two runs were performed for each specimen and the standard except for sample 7G.
An 800 Nicolet Fourier Transform Infrared Spectrometer (FTIR) equipped with a TGS detector was used to perform the analysis. The solution was placed in a sodium chloride (NaCI) liquid cell (0.5 cm in pathlength) and was scanned to obtain an IR spectrum. The following collection parameters were used: scans, 32; resolution, 4 cm-'; mirror velocity setting, 30 (0.16 cmls); and a Happ-Ganzel apodization. A background spectrum from the empty cell was obtained, on the basis of which the ratio of the sample spectrum was calculated. All spectra were converted to absorbance units and baseline-corrected using the Omnic automatic baseline correction routine. The corrected peak-height and peak-area of the band centred around 698 cm-' were measured. The extinction coefficient at 698 cm-' was determined for the samples and the standard. The extinction coefficient of the sample was compared to that of the standard to determine the percentage of weight of polymer in the sample.
Note that there was a considerable amount of insoluble matters such as reinforcement and filler materials left at the bottom of the volumetric flask. Although these matters did not interfere with the spectrum, they affected the weight percent results by acting as a diluent and hence required correction. In order to quantify the insoluble matters, the liquid phase in the volumetric flask was carefully decanted and the residue transferred to a beaker. The solid matters were washed with fresh CS2 and the liquid fraction was again decanted. This process was repeated until a clear solution was obtained. The residue, free of bitumen at this point, was dried to constant weight in an oven. The polymer content was corrected according to this amount of residue.
4. RESULTS
4.1 Mechanical Testing of Membrane Samples
Typical tensile force-displacement curves of the membranes are shown in Figure 4.1. For ease of comparison, the scales were made the same for both cap and base sheets of each membrane.
The cap sheet of membrane G proved to be brittle, except sample G-2, which yielded and stretched (Figure 4.la). It reached a low maximum load without exhibiting a distinctive peak. The base sheet stretched extensively. It was elastic, ductile and superior in strength and elongation when compared to the cap sheet. For the 14-year- old membranes (samples 5 and 6), the force increased linearly with displacement, reached a maximum, and decreased with further tension (Figure 4.1 b). The base sheet was slightly more ductile, but weaker, than the cap sheet. The cap sheet of membrane 7 went through elastic deformation, followed by plastic deformation, before failing with an abrupt drop in load (Figure 4.1~). On the other hand, brittle fracture was observed in its ply sheet. Both cap and base sheets of membrane 8 behaved in an elastic-ductile manner (Figure 4.ld). Sample 8C yielded like sample G-2.
The maximum tensile load was taken as the peak on the curve while the maximum tensile elongation was defined as the difference in grip separation from the initial point to the maximum tensile load. The maximum tensile loads and elongations of the membrane samples are plotted in Figures 4.2 - 4 and summarized in Table 4.1. Each data point is the average of at least three specimens and the error bars represent plus or minus one standard deviation. The dotted lines in Figures 4.2 and 4.3 indicate the load or elongation values of the new membranes as listed by the manufacturer. No dotted lines were drawn in Figure 4.4 because of the lack of information on the new membranes.
For the 7-year-old membranes (membrane G), the maximum tensile load of the base sheets was about twice that of the cap sheets (Figure 4.2a). All of these weathered membranes were at least as strong as the new ones (135 N or 30.3 lbf) except the cap sheet of G-2, which only retained about 30% of its original maximum load. The maximum tensile elongation of the cap sheets ranged from 2 to 6% (Figure 4.2b); with G-2 having the largest scatter. All cap sheets retained the same elongation as that listed by the manufacturer. Note that the base sheets necked and stretched extensively under tension. The final failure occurred in the grips, hence the maximum tensile elongation values were invalid and therefore not reported.
For the 14-year-old membranes (5 and 6), the maximum tensile load of the cap sheets was higher than that of the base sheets (Figure 4.3a). All of the membranes were at least as strong as the new ones. The maximum tensile load of the cap sheets were about 70% to 100% higher than the manufacturer's value. All of the membranes retained the same maximum tensile elongation as the new membranes except the base sheet of 6-2, which was slightly lower (Figure 4.3b).
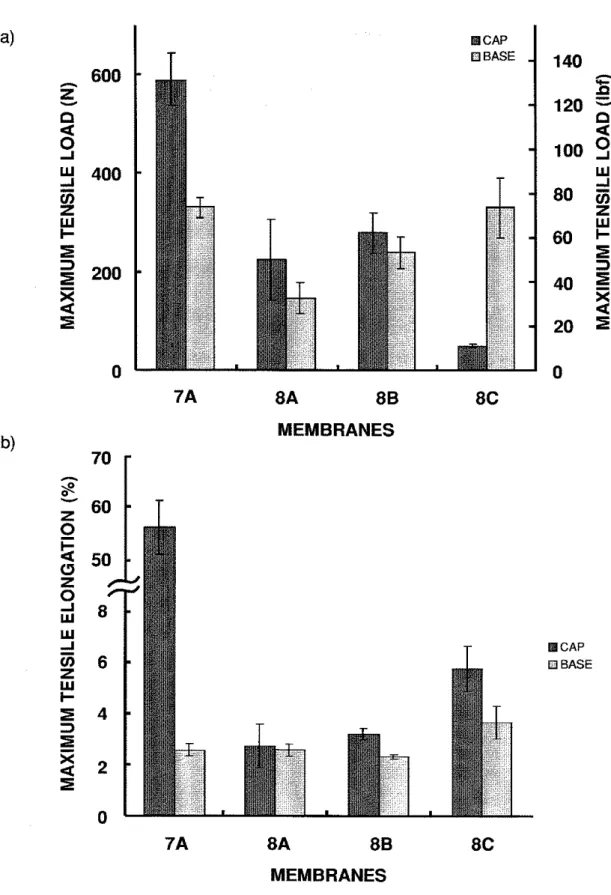
For the 7-year-old membrane from the Tulsa job (membrane 7), the maximum tensile load sustained by the polyester-reinforced cap sheet was close to 600 N (135 ibf) while the maximum tensile elongation was about 55% (Figure 4.4). These
values are the highest among all the membranes tested. The fibreglass ply sheet used in this system was relatively strong compared to other glassfibre-reinforced base sheets.
For the membranes from the Montana job (membrane 8), the maximum tensile load and elongation of the cap sheets were similar to those of the base sheets at around 200 N (45 Ibf) and 3%, respectively, for sample 8A and 8B (Figure 4.4).
However, the maximum tensile load of the cap sheet of membrane 8C was much lower than that of its base sheet. The cap sheet of 8C was 75% weaker than the other two samples from the same membrane (8A and 8B). On the other hand, the maximum tensile elongation was almost double that of samples 8A and 8B.
Table 4.1 Summary of tensile properties of the membranes
a NIA - not applicable since final failure occurred in grips b
N/A - not applicable, manufacturer not known manufacturer's specification sheets
(a) DISPLACEMENT (in) 0 0.5 1 .O 1.5 2.0 400 CAP DISPLACEMENT (mm) DISPLACEMENT (In) DISPLACEMENT (mm)
Figure 4.1 Typical tensile force-displacement curves of (a)
DISPLACEMENT (in) ,.-.,..,,..
.-..
JILE FORCE DISPLACEMENT (mm) DISPLACEMENT (in) 0 2 4 8 8 DISPLACEMENT (mm)G-I G-2 G-4 MEMBRANES
d
U)z
40I
30.3 lbf =)z
203
I
G-1 G-2 G-4MEMBRANES (CAP SHEETS)
Figure 4.2 Maximum tensile (a) load and (b) elongation of membrane G
6-2 MEMBRANES 0
8
-I 40 wd
V) 30.3 ibf ZE
6-2 MEMBRANES .CAP U BASEMEMBRANES
HCAP BASE
7A 8A 8 8 8C
MEMBRANES
Figure 4.4 Maximum tensile (a) load and (b) elongation of membranes 7 and 8
4.2 GC/MS Analysis of Gas Samples 4.2.1 Water Content
The RH values at 25 "C (77 OF) of the gas within roofing blisters are shown in Figure 4.5. Each data point was the average of at least two runs and the error bars indicate
+lo%
relative error estimated for this GCIMS setup. The RH (before adjustment for temperature) of the blister gas ranged from30
to38%
RH for all samples, except86,
which had a RH of 71%. The consistency of the results of gas samplesG-1,
G-2 and G-3 (obtained from the same blister) showed that the precision of the method was reasonable.The mean daily temperature on the day of sampling was obtained from the web site of National Climate Data Centre. Adjustment was made to account for the difference between the temperature in the field during sampling and in the laboratory. Since the actual sampling dates are not available for samples G and
8,
only the RH values for samples 5, 6 and 7 were corrected (noted by asterisks in Figure 4.5).G-1 G-2 G-3 5-I*
5-2*
6-2* 7A* 8 8BLISTERS
* adjusted for temperature
4.2.2 Volatile Organic Compounds
The FID signal of the canistered blister gases was so low that in most cases the integrator failed to integrate the TVOC signal. The threshold value of the integrator was set at 512 counts of peak height, corresponding to VOCs concentration of only
.
0.008 mg/m3 above the background. Traces of acetone, hexane, benzene, sulphur dioxide and some hydrocarbons with less than 10 carbon atoms were found in the blister gas. However, the amount and composition are not significantly different from those of the make-up air. Similar results were obtained for the head space of the vials containing strips of the roofing membranes.4.3 Characterization of Mopping Asphalt
4.3.1 Mopping Asphalt Type
The softening points of the mopping asphalts are summarized in Table 4.2. According to ASTM D312-95a [6], the softening points of Type Ill and Type IV asphalts are 85 to 96 "C (185 to 205 OF) and 99 to 107 "C (210 to 225 OF), respectively. The asphalt type is also included in Table 4.2.
Table 4.2 Softening points and presumed types of the mopping asphalts
'Type Ill was specified by a client's representative
4.3.2 Thickness of Mopping Asphalt
Asphalt Type IV IV IV Ill* IV Sample G
5
6 7 8The quantity of mopping asphalt in different roofing systems studied is shown in Figure 4.6. Membrane G has a mopping thickness of about 1.5 mm (0.06 in.) or a mopping weight of 1.5 kg/m2 (30.7 lb/100 ft2), taking the specific gravity of the asphalt as 1.02. While the mopping thickness at the cap sheet lap on G-1 was the same as that in the field, the mopping thickness at the lap on G-2 was almost three times that in the field. For the 14-year-old samples (5 and 6-3), the mopping thickness of sample 5 was about the same as that of membrane G but that of membrane 6 was significantly lower, below 1.0 mm (0.04 in.) or 1 kg/m2 (20.5 lb1100
ft2).
For membrane 7, the mopping thickness ranged from 0.5 to 1.2 mm (0.02 to 0.05 in.). The mopping thickness at the blister area was slightly less than that at the intact area on the same membrane 7D. The thickness of the control sample 7G was not significantly different from that of membrane 70. Membrane 8 has the highest variation in mopping thickness: the intact sample 8C has the highest mopping thickness of 2.0 mm (0.8 in.) or 2 kg/m2 (41.0 lb1100 ft2), which is 10 times that of sample 88 which contained blisters.NRC-IRCINRCA page 19 Softening Point ("C) 11 7.0
+
0.5 153.8 ? 0.5 154.8 If: 0.5 93.8 L 0.5 112.5+0.5 ("F) 242.6+
0.9 308.8 ? 0.9 31 0.6+
0.9 200.8 5 0.9 234.5+
0.9G-1 G-1 G-2 G-2 G-4 5-1 5-2 6-2 7D 7D 7G 8B 8C
lap lap blister intact
BLISTERS
Figure 4.6 Quantity of mopping asphalt in different roofing systems
4.4 Characterization of the Bitumen - Mopping Asphalt Interface 4.4.1 Contact Compatibility
The spread of the drops of mopping asphalt applied on the membrane was similar to that applied on the talced tin. For membranes G, 7 and 8, spherical drops of mopping asphalt flattened out to form round and slightly raised disks. However, the drops on membrane 5 and 6 remained substantially spherical throughout the 3-day test. The contact angle formed was close to 100" with the membrane and there was little tendency to spread out.
Oily rings developed around the mopping asphalt drops of sample 8, both on the membrane and the talced tin cap. Under the optical microscope, the average widths of the rings were determined to be 0.45 mm (0.018 in.) and 0.35 mm (0.014 in.) on the membrane and the control, respectively. No oily ring was formed around the rest of the specimens and controls.
4.4.2 Visual Examination
Visual examination of the membrane inside the blisters revealed mopping asphalt of variable thickness existed between the cap and the base sheets. The characteristics of the asphalt such as its texture, marks and patterns formed on the membrane, uniformity of application and cracks or discontinuities in the mopping were carefully examined. These surfaces can be divided into three categories:
(a) cap sheet /mopping interface
The mopping asphalt bonded well on the base sheet. There were narrow gaps in the mopping asphalt, which separated it into small regions, analogous to cracks in mud on a dry field. The cap sheet was clean, shiny and covered with vein-like patterns (Figure 4.7). Samples G and 8 and part of sample 5 fell into this category.
(b) discontinuity in mopping
Mopping asphalt adhered on both cap and base sheets in random patches (Figure 4.8). The adhesion was weak. The asphalt patches were hard and tough. Narrow gaps were found at the boundary of neighbouring patches and wide gaps between large patches. For the areas without mopping, the membrane appeared clean, shiny and was covered with a vein-like pattern. Samples 5 and 6 fell into this category. (c) uncoated spot
This type of blisters existed as "stars". They were observed in many areas on sample 7 (Figure 4.9). The central portion of the star was a void with clean and shiny surface. The asphalt around the star was dull. Asphalt "legs" extended from the centre towards the edge, bridging the two membranes. The pattern matched on both cap and base sheets so that the membranes were well bonded around the star and weakly held at the legs. Sample 7 fell into this category.
WRINKLES
CRACKS
Figure 4.7 Example of failure at cap sheet 1 mopping interface (a) cap sheet (b) base sheet (membrane G-1)
VEIN-LIKE ' PATERN
Figure 4.8 Example of discontinuity in mopping (membrane 5-1)
LEG
STAR PAWEI
Figure 4.9 Example of uncoated spots (membrane 7B)
4.5 Characterization of the Modified bituminous Membrane
4.5.1 Blending of Polymer Matrix in the Modified bituminous Membrane
The segregation of the polymer and the bitumen was observed using UV fluorescent microscopy. Under UV, the asphaltene-rich phase appeared as a dark, dispersed region while the SBS polymer existed as the deep yellow, continuous phase. Typical micrographs of the modified bituminous membranes are shown in Figures 4.10 to 14. The SBS polymer appeared as light grey instead of deep yellow in these black and white pictures.
In membrane G-4, the bitumen usually existed as small dark particles (-20 - 40 ym) dispersed uniformly in the light continuous phase of the polymer (Figure 4.10). There are few areas containing large pockets of bitumen, which were over 200 pm in diameter (Figure 4.10b). In general, the bitumen is well dispersed and the polymer phase is continuous.
In membrane 5, the bitumen appeared as an irregular dispersed phase while the polymer remained as the continuous phase in the cap sheet (Figure 4.1 1). The average bitumen particle was relatively large. For the base sheet, it became difficult to determine the continuous phase. The two phases were narrow, elongated and seemed to follow a certain flow pattern (Figure 4.1 1 b). In membrane 6 , the bitumen phase was elongated but remained well dispersed in the continuous polymer phase (Figure 4.12). The bitumen phase appeared to be more distorted in the cap sheet than in the base sheet.
The bitumen and polymer seemed to be well mixed in membrane 7 (Figure 4.13a). The particle size was relatively small and the distribution uniform. The phase distribution of membrane 8 (Figure 4.13b) was similar to that of membrane G-4 (Figure 4.10). The bitumen particles were generally small, occasionally with larger ones, and the polymer was the continuous phase.
The micrograph of brand-new fibreglass-reinforced SBS modified bituminous membrane obtained in our laboratory was also included for comparison (Figure 4.14). The bitumen particles ranged from 20 to 200 pm and were dispersed uniformly in the continuous polymer phase.
Figure 4.10 UV fluorescent micrograph showing bitumen dispersion in membrane G (a) cap sheet and (b) base sheet
Figure 4.1 1 UV fluorescent micrograph showing bitumen dispersion in membrane 5 (a) cap sheet and (b) base sheet
Figure 4.12 UV fluorescent micrograph showing bitumen dispersion in membrane 6
(a) cap sheet and (b) base sheet
Figure 4.13 UV fluorescent micrograph showing bitumen dispersion in cap sheets of (a) membrane 7 and (b) membrane 8
Figure UV fluorescent micrograph showing bitumen dispersion in a new bituminous membrane
modified
4.5.2 Polymer Content in the Modified bituminous Membrane
The membranes contained about 11 to 35 weight percent (wt %) of insoluble matters such as reinforcement and fillers. The average polymer (SBS, e.g. Kraton) content in the soluble portion of the modified bituminous, as determined by FTIR, ranged from 6 to 11 wt % (Table 4.3). The polymer content seems to be slightly higher in the cap sheet. However, the difference is not significant since the relative error in the polymer content is estimated to be 5%.
Table 4.3. Polymer content in modified bituminous membranes
* Ply sheet only, no SBS modified bituminous layers
Sample G-4 5 6-3 7G 8C Cap Sheet 10.3 10.5 9.9 6.7 11.0 Base Sheet 8.6 9.4 8.0 NIA* 9.6
5. DISCUSSION
5.1 Mechanical Testing of Membrane Samples
All samples from the weathered membranes G, 5 and 6 retained approximately the same elongation as the brand-new membranes. The results indicate that all these samples, except the cap sheet of G-2, also retained the original strength.
The maximum tensile force of the cap sheet of the 14-year-old membranes (5 &
6) was higher than that of the 7-year-old membrane (G). Also, the cap sheets of the 14- year-old membranes were stronger than their base sheets. The weathering process could be inducing the conversion of some of the lower molecular weight fractions in the bitumen into higher molecular weight fractions through oxidation and condensation reactions. This increase in molecular weight translates into an increase in tensile strength of the membrane.
The maximum tensile load of the cap sheets was lower than that of the base sheets for membrane G (Figure 4.2a). This seems to contradict the expectation of higher strength through weathering. However, visual examination of the fracture surfaces revealed that the reinforcements in the two sheets were different. This was confirmed by microscopic examination. The cap sheet was reinforced with a random fibreglass mat, whereas the base sheet was reinforced with both a random fibreglass mat and a continuous polyester grid. The extra reinforcement increased the maximum tensile load.
The maximum tensile load of both the cap and base sheets obtained from the intact blister (G-I) and the control sample (G-4) are the same. It seems that the blister formation was not due to non-uniform strength of the membrane at different areas and also the existence of the blister did not appear to reduce membrane strength. However, it has to be confirmed by the age of the blister. If the blisters are young, their effects on membrane strength may not yet be observable.
The maximum tensile load of the cap sheet of G-2 was significantly lower than that of G-1 and G-4 as well as the manufacturer's value (Figure 4.2a). Since the sample was obtained from a ruptured blister with a large quantity of water between the plies, it is possible that the trapped water migrated into the cap sheets through the ruptured area and weakened the interfacial bond of the reinforcement and the bitumen. The high scatter of the maximum tensile elongation of G-2 seems to support this hypothesis. The rounded shape of the force-displacement curve without a distinctive peak is also generally observed in a composite with a weakened fibre-matrix interface (Figure 4.1 a).
Like G-2, the cap sheet of 8C was significantly weaker than that of the other samples cut from the same membrane and both behaved similarly under tension as shown by the force-displacement curves. Unlike G-2, however, 8C was the control sample and no blister or water was observed. It is not clear what caused the abnormally low value.
The maximum tensile load and elongation of a variety of SBS modified bituminous roofing systems of different ages obtained from different locations have been determined. The maximum tensile load and elongation of the non-woven polyester-mat-reinforced cap sheet (sample 7) were much higher than the fibreglass-
mat-reinforced counterparts (G, 5, 6 & 8). It is interesting to note that although the mechanical performance of these roofing systems was different, blisters were observed in all of them. It appears that the strength of a membrane was not a major factor in blister formation.
5.2 GC/MS Analysis of Gas Samples
GClMS revealed that the gas in roof blisters is composed essentially of air and water vapour. For samples 5, 6 and 7, the RH ranged from 50 to 75%. These values were corrected to the field conditions using the mean daily temperature in the field at the time of sampling. These values are comparable to the results of a similar study where the composition of the blister gas sampled from existing BUR was analyzed by GCIMS
[q.
The researchers have reported water vapour concentration of 1 to 1.5 mole %. They did not indicate whether they had corrected for the temperature difference between the laboratory and the field. Our RH results translated into water vapour concentration of 1.2 to 1.7 mole %, which are comparable to their findings. Since the volume expansion of water from liquid to vapour state is very large (-1250 times), even with a minute amount of water in a small void, the vapour pressure is sufficient to force the void to grow into a blister. This is especially serious at high temperature when the bitumen becomes soft and the pressure in the blister is high. The presence of water vapour accelerates blister growth according to the same cyclic pumping action due to diurnal changes in temperature, as in blistering in BUR [8-101.The RH's of the blister contents of samples G and 8 were not corrected to the field conditions since the date and time of sampling were not available. Consequently, the RH's reported are based on laboratory temperature only. They do not necessarily represent the RH's in the blisters in the field at the time of sampling since the temperature of the roof was likely different from that in the laboratory. Therefore, it is necessary to know the temperature at the time of sampling before the results can be interpreted. If the roof temperatures during sampling were lower than the laboratory temperature, the reported RH would be underestimated since the saturation humidity is lower at field temperature. The reverse is also true if the blister content was sampled at a temperature higher than that in the laboratory. Since sample 8B was obtained most recently (with letter dated May 19, 1997) while samples G-1, 2 and 3 were obtained earlier (with letter dated Jan. 22, 1997), the temperatures during sampling can be quite different. No conclusion should be drawn for these samples.
Detailed GCIMS analysis on the blister gas revealed traces of acetone, hexane, benzene, sulphur dioxide and some hydrocarbons with less than 10 carbon atoms. The amount and composition of these trace organics are not significantly different from those of ambient air. Our results seem to confirm the findings by several researchers who studied the composition of the blister gas found in built-up roofs [7,11-121. It is possible that volatile organics were formed and released during aging. However, the roofing systems were relatively old (at least 7 years of age), any volatile organics that had formed would have likely diffused through the membranes and evaporated into the atmosphere. Similar chemical composition was obtained from the headspace of the vials containing strips of the roofing membranes. The results indicated that the VOCs
were released from the membrane and were not degradation products of the insulation. In addition the amount of the VOCs detected was too small to be responsible for the formation of blisters.
5.3
Properties of the Roofing Systems 5.3.1 Mopping AsphaltThe measured mopping thickness ranged from 0.2 to 2.0 mm (0.008 to 0.079 in.) or 0.2 to 2 kg/m2 (4.1 to 41 lb/100 ft2) using a specific gravity of 1.01-1.03 [13], with most samples having thickness between 1 to 2 mm (0.04 to 0.08 in.) or 1 to 2 kg/m2 (20.5 to 41 lb/100 ft2). The standard deviation for individual sample was scattered ranging from 5 to 50%. Cramp et a/. [14] recommended that the optimum application rate for asphalt in the fabrication of BUR be 0.73 to 0.98 kg/m2 (15 to 20 IbllOO ft2), which corresponded to an inter-ply thickness of 0.76 to 1.02 mm (0.03 to 0.04 in.). The range of our results is wider than the recommended range. Although SBS-modified membranes were being investigated here instead of BUR, the basic concept of applying a mopping remains the same - use the minimum amount of asphalt to ensure good adhesion. According to a study on BUR by Rossiter [15], the mopping thickness depends on the viscosity of the asphalt, which is governed by the temperature during application. Assuming a Type Ill asphalt and using their data on the relationship between mopping thickness and viscosity, most roof samples in this study had a viscosity of 130 to 300 mm2/s (centistokes), which exceeded the optimum range of 50 to 150 mm2/s as recommended by Rossiter. It is possible that the mopping temperature was not sufficiently high to achieve the desired viscosity. In addition, high temperature is also necessary to obtain good bonding between the SBS modified bituminous sheets. The mopping thickness was quite uniform for membrane G. The mopping thickness was consistent for three different areas (G-1, G-2 and G-4) cut from the same roof except that the mopping was almost three times as thick at the lap on G-2 than on G-1. It is possible that extra mopping was applied to secure the lap. It is interesting that although the mopping thickness of the control samples (G-4, 6-3, 7G and 8C) varied quite widely, no blisters were formed. The mopping thickness did not seem to be a major factor on the formation of blister.
The softening points of the mopping asphalts used in the roofing systems investigated exceeded the upper limit for a Type IV asphalt (99 to 107 "C or 21 0 to 225 OF), except in roofing system 7 which was a Type Ill. The client representative indicated that Type IV asphalt was used in sample G (letter dated Jan. 22, 1997). However, the results showed that the softening point of the mopping asphalt used in sample G was 10 "C (1 8 OF) higher than the upper limit of a type IV asphalt. In addition, it is unlikely that mopping asphalt with high softening points such as those in roofing systems 5 and 6 were used (-155 "C or 31 1 OF). It is likely that the high softening points were due to aging of the asphalts. The mopping asphalt was brittle and flake-like (for systems 5 and 6), which is indicative of aging. It is also possible that reheating of the asphalt in the laboratory during preparation of the specimens (since the asphalt was heated up once during roof installation) might have induced changes in both the chemical and rheological properties. A weak interfacial bond was observed between the
mopping asphalt and the membranes in samples 5 and 6, which could be due to the difficulty for the asphalt to remain sufficiently liquid during installation.
5.3.2 Modified bituminous Membrane
The bitumen phase was finely dispersed in the continuous polymer phase in membranes G-4, 7 and 8, similar in size and distribution as the brand new sample (Figure 4.14). It is possible to assume that weathering did not induce significant changes in the blending between the polymer and bitumen.
The narrow and elongated bitumen phases of membranes 5 and 6 (Figure 4.1 1 and 12) are probably the result of elongational stresses experienced by the membranes while they were on the roof. It could be due to formation of the blister, which had stretched the membranes over a long time (these membranes are 14 years old). The non-continuity of the polymer phase could be due to aging of the membrane as the low molecular fraction of the bitumen was converted slowly into higher molecular fraction due to extended period of weathering. The high molecular weight fraction (mostly asphaltene), eluted from the polymer phase, existed as a dark area in these figures. However, it was also possible that the original phase distribution was not uniform. It is unfortunate that unweathered samples of membranes 5 and 6 were not available for confirmation.
The blending between the polymer and the bitumen did not seem to be significantly affected by a combination of aging, weathering and stresses.
The SBS content in the modified bituminous of the roofing membranes ranged from 6 to 11%. No significant difference in the polymer content was observed between the cap and the base sheets. The polymer content was not affected by aging and weathering since brand new polymer modified bituminous typically contains 5 to 12% styrene-butadiene-styrene block copolymers [16].
5.3.3 Membrane 1 Mopping Interface
Since no oily rings were formed around the drops on samples G and 7 and the spread of the drops were similar on both the membrane and the tin cap, the mopping asphalt was compatible with the membrane.
For sample 8, the presence of an oily ring around the periphery of the mopping asphalt drops and the flattening of the drops seemed to point to an exudation reaction, i.e., some softer bodies exuded from the membrane and migrated to the mopping asphalt. In the preliminary experiment where the suggested talc density in the ASTM standard was used, the talc was soaked with oil all over the surface of the membrane sample, not just around the drops, after the three-day testing in the oven. The observation confirmed that oil exuded out from the membrane. However, the presence of an oily ring surrounding the drops of mopping asphalt on the talced tin cap showed that oil came from the mopping asphalt as well. Since the oily ring around the drop was wider on the membrane than on the tin cap, it was possibly a combined effect of oil exudation from both sources: the mopping asphalt and the membrane. It is therefore
inconclusive from the test results if incompatibility of the exudative type existed in membrane 8.
No oily rings were observed for sample 5 and 6. However, the high contact angle and the tendency of the drops to remain spherical could point to a severe wetting problem andlor incompatibility of the insudative type, i.e., softer bodies in the mopping asphalt were absorbed by the membrane. To investigate the extent to which these asphalt drops could remain spherical, the temperature of the oven was raised to 10°C (18°F) above their softening points. After one day, the drops on the membranes remained spherical without any tendency to spread out.
To find out if there was insudative incompatibility in membranes 5 and 6, or any migration of softer bodies from the mopping asphalt to the membrane, the chemical composition of the mopping asphalt, before and after the contact compatibility test, was analyzed. Since membranes 5 and 6 were produced by the same manufacturer and came from the same location (New Orleans), only membrane 5 was examined, as the results could apply to membrane 6 as well. Two analytical techniques were used: infrared spectroscopy (IR) and thin layer chromatography with flame ionization detection (TLC-FID). Mopping asphalt was collected and prepared as described in section 3.5.1 except that no talc was used to minimize possible complication in the chemical analysis. Three samples were examined: the raw mopping asphalt removed from the membrane, the asphalt drops applied on the tin cap and the asphalt drops applied on the membrane. Note that the first sample was raw asphalt and was not re- heated in the laboratory whereas the last two were melted before applying on the substrates and heated in the oven at its softening point for three days.
For the IR analysis, an 1 % w:v solution was prepared for each aspahlt using reagent-grade carbon disulphide (CS*). The solution was applied on a potassium bromide (KBr) pellet and scanned to obtain an IR spectrum. The three spectrums were very similar: strong C-H peak was obtained between 3000 to 2800 cm-' and some small peaks were exhibited in the range of 1800 to 1300 cm-'. No indication of softer bodies migration was found.
For the TLC-FID analysis, an 1 % w:v solution was prepared for each aspahlt using trichloroethylene. The solution was kept in a tightly sealed sample vial in the laboratory for 24 h to allow complete dissolution. The Chromarods (quartz rod coated with sintered glass and silica) were spotted with 1 pL of the asphalt solution using a 2 pL microsyringe. Three replicates were prepared for each asphalt solution and a blank tube was also included as a control. The ten rods were placed on a special rack. It was put to an oven at 85°C (185°F) for 5 mins to evaporate the solvent and then allowed to cool to room temperature in a constant humidity chamber for 10 mins. Three development tanks containing 125 mL of solvents were prepared. The rods were developed by placing them in tanks of heptane, toluene and tetrahydrofuran for appropriate time periods, in that order, with the drying and cooling process mentioned above between the developments. This process separated the asphalt into different fractions by polarity. The rods were then burned and scanned in an latroscan MK-5 TLC-FED Analyzer.
The asphalt was separated into 4 fractions: the saturates, the aromatics, the resins and the asphaltenes. Chromatograms indicated that the content of the satuarates and the aromatics was about the same in all three samples, at slightly less than 10% by weight. This indicated that the softer bodies, the saturates and the aromatics, did not migrate during the contact compatibility test.
It is necessary to point out that small amount of insoluble matters was left at the bottom of the sample vials of asphalt solution for the asphalts which had been heated in the oven (-155°C or 31 1°F) for three days. Since quantitative results were not desired, no adjustment was made for the insoluble. It is also noted in the TLC-FID chromatograms that the weight percentage of the resins was double that of the asphaltenes in the raw asphalt. However, the weight percentage of the asphaltenes tripled that of the resins in the samples which were heated in the oven for three days. This shift between the resin and the asphaltene contents indicated that the asphalts had aged in the oven during the course of the experiment, which explained the presence of insoluble matters in the asphalt solution during sample preparation.
Both analytical methods, IR and TLC-FID, did not show any significant migration (if any) of the softer bodies between the mopping asphalt and the membrane. However, it cannot be concluded that insudative incompatibility was not present in membranes 5 and 6. The combined saturates and aromatics content (about 10%) was low compared to that of a typical Type Ill asphalt (about 25 wt %) [17]. It is suspected that the softer bodies had already migrated into the membranes while on the roof.
Poor wetting of the asphalt on the membrane seem to be the major factor leading to poor adhesion in membranes 5 and 6 which was evident from Figure 4.8. The weak interfacial bond between the plies was easily overcome by the pressure of water vapour in the formation of blisters.
Visual examination of the surface of the blisters indicated three categories of failure:
(a) cap sheet / mopping interface
The blister was formed at the cap sheet / mopping asphalt interface. The asphalt and the membranes were compatible as indicated by both the positive results of the contact compatibility test and the good bonding between the mopping asphalt and the base sheet (samples G and 8). Good adhesion is therefore expected at the mopping asphalt 1 cap interface since both sheets are made of the same polymeric materials. However, the shiny bitumen surfaces and the cleanliness (no adherent asphalt) of the cap sheet pointed to lack of interfacial adhesion. Since the interfacial bonding on the base sheet was good, the temperature of the mopping asphalt should have been initially, high enough. However, it is possible that the temperature dropped rapidly during the mopping process, so that it fell below the equiviscous temperature (EVT) of the asphalt when the cap sheet was put on. As a result, poor adhesion was obtained between the mopping asphalt and the cap sheet.
(b) discontinuity in mopping
The discontinuities between the asphalt patches were likely the results of mopping skips. Interfacial failure was randomly distributed at the cap and the base
sheets, indicating the non-uniformity in the mopping process. The mopping asphalt for samples 5 and 6 was found to contain some foreign bodies (sand, fillers, aggregates or other contaminants). They did not dissolved when the asphalt was heated. The presence of these foreign bodies made the asphalt more difficult to handle and hard to obtain uniform mopping. As a result, skips were present in the mopping which were the origins of voids.
(c) uncoated spot
The "starlike" uncoated pattern was likely to be the origin of a blister (or two adjoining blisters for the twin-star pattern shown in Figure 4.9). The centre of the pattern was bare, with almost no asphalt adhering to it. The "legs" (or stalactites and stalagmites) bridged the cap and the base sheet inside the periphery of the blister. They were likely formed from the yielding and stretching of the mopping asphalt at the edge of the void during the expansion of the blister at high temperatures. This process was facilitated by the low softening point of sample 7 (93.8 "C or 200.8 OF, Type Ill asphalt). The legs marked the origin of the blister and their presence revealed the resistance of the bitumen to the prying action of the blister growth. They break only when the internal pressure of the blister exceeds the ductility of the asphalt. This type of pattern was also observed in BUR [lo]. The origin of the voids is uncertain. One possible cause is excessively cooled mopping asphalt being used during membrane application. Another possible cause was the presence of liquid parting agent at the interface of the cap and base sheets. Liquid parting agent is sometimes applied on roofing membrane to prevent sticking in the roll. The manufacturer of the membrane indicated that no liquid parting agent was used in these sheets. It is also possible that the membrane was uneven (not flat) when it was rolled out during mopping. The cap sheet bonded well to the base sheet at the flat areas but voids were left between the membranes at the raised, uneven areas. These areas may not be noticeable at the time of installation but they grow with time.