JV
14r
CEO PAY
AND
FIRM
PERFORMANCE:
DYNAMICS, ASYMMETRIES,
AND
ALTERNATIVE
PERFORMANCE
MEASURES
Paul L. Joskow
Nancy
L. RoseMassachusetts Institute of Technology
DYNAMICS, ASYMMETRIES,
AND
ALTERNATIVE
PERFORMANCE MEASURES
Paul
L.Joskow
Nancy
L.Rose
MIT
and
NBER
;/;assachusettsinstiiute
OFTECHNOLOGY
MAY
3 1995LIBRARIES
First draft:
March
1994
This
revision:December
1994
We
thank CatherineWolfram
for superb research assistance, and theMIT
Center for Energy and Environmental PolicyResearch andtheNational ScienceFoundation forfinancial support. Rose gratefullyacknowledges
fellowship support fromthe Center forAdvanced
Study inthe Behavioral Sciences.We
appreciate thecomments
of seminar participants atUCLA.
DYNAMICS,
ASYMMETRIES,
AND
ALTERNATIVE
PERFORMANCE MEASURES
Paul L.Joskow
Nancy
L. RoseDecember
1994
ABSTRACT
This study explores the
dynamic
structure of the pay-for-performance relationship inCEO
compensation and quantifies the effectof introducing a
more complex model
offirm financialperformance on the estimated performance sensitivity ofexecutive pay.
The
results suggest thatcurrent compensation respondstopastperformanceoutcomes, but that the effectdecays considerably withintwo
years. This contrasts sharply with models of infinitely persistent performance effects implicitlyassumed
inmuch
ofthe empirical compensation literature.We
findthatbothaccounting and market performance measuresinfluence compensation andthat the salary and bonus
component
of pay as well as total compensation havebecome
more
sensitive to firm financial performance over the past
two
decades. There is no evidence that boardsfailto penalizeCEOs
forpoor financial performance orrewardthem
disproportionately well for good performance. Finally, the data suggest that boardsmay
discount extreme performance outcomes--both high and low-relative to performance that lies withinsome
The
relationshipbetween
firmperformance and
executivepay
hasbeen one
ofthe
most
widely studied questions In the executivecompensation
literature.^A
substantial theoretical literaturedevelops
optimal executivecompensation
contracts that linkpay
to variations in firmperformance
as ameans
of aligning the incentives ofmanagers
(the "agents") with the interests ofshareholders (the "principals"). Thistheoretical literaturehas
spawned
numerous
empirical tests ofthe presence,form and
strength of the relationship
between
executivecompensation
and
firm financialperformance.
The
desirability of "incentive pay"based
on
firmperformance
hasbecome
so widelyaccepted
that itwas
written into recent reforms in the corporateincome
taxcode
intended toreduce
or limit overallCEO
pay. EffectiveJanuary
1,1
994,
executivecompensation
inexcess
of $1 million per yearis not deductible as anexpense
for corporateincome
taxpurposes
unless It isbased on
objectivemeasures
of
firmperformance
(sec. 162(m)).^As
atheoretical matter, the preciseform
of the optimalcompensation
contractis complicated (Rosen, 1992). In general, it will
depend
on such
factors as the preferences ofmanagers
toward
risk, the sensitivity of managerial effort tocompensation, and
the informationon
true managerialperformance
providedby
themeasures
of firmperformance
that are observable byboards
of directors. Empiricalanalyses of the pay-for-performance relationship in contrast tend to
employ
quitesimple specifications of
how
firmperformance
influencescompensation.
These
specifications vary across a
number
of dimensions, including the choice of stock' See Rosen (1992) for an overview of both
the theoretical and empirical literature onthis
subject.
^ This revision to the tax code
was
itself a response to political pressures resulting from widely-readpopular commentariesthatarguedthat
many CEOs
areovercompensated andpaidmarket
oraccounting
performance
measures,
thedegree
towhich
performance
sensitivities are
assumed
to be constant across allCEOs
and
firms or are allowed to vary withsome
set of observable factors, theassumed
functionalform
of thecompensation-performance
relationship,and
the use of absolute returns or returnsrelative to
some
referencegroup
of similar firms.There has been
little effort to standardize specifications acrossempirical studies, oreven
tocompare
results acrossalternative specification choices.^
This
paper
has
two
primary objectives. First,we
examine
how
more
complex
measures
of firmperformance
affectthe estimatedpay
forperformance
relationship.In this analysis
we
allow firmperformance
tobe
measured
by
a vector of indicators that includesboth
market
returnand
accounting
returnmeasures
of financialperformance,
allows the sensitivity ofpay
toperformance
tochange
over time,and
allows the
performance
sensitivity todepend
on
how
good
orbad
the firm's financialperformance has
been.We
believe that this richer specification of firm financialperformance
is essential given that traditionalmeasures
necessarily are noisy signalsof underlying managerial
performance.
A
broader setofmeasures
is likely to provide a better signal of managerialperformance
thandoes
a single unidimensionalperformance
measure,
and
appears
to accordmore
closely with institutionaldescriptions of the
compensation process
(seeMilgrom and
Roberts,1992,
chapter 13).Our second
objective is to explore thedynamic
structure of thepay-for-performance
relationship.A
variety of different functionalforms has
been
used
in theliterature,
embodying
quitedifferent implicitassumptions about
the persistenceof firmperformance
effectson
executive pay.At
one
extreme
are specifications thatassume
^ Gibbons and
Murphy
(1990) provide one of thefew
analyses that report results fordifferent functional forms, but even their study focuses on choosing one form (using a
minimum
least squares based criterion), rather than on interpreting the differences in the results.3
no
memory
in thecompensation
process. Currentcompensation
is influencedby
current
performance
only; past financialperformance has no
impact.At
the otherextreme
are specifications thatassume
complete
persistence: currentcompensation
is
determined
by
current financialperformance
and
all previousperformance
realizations, with all realizations
weighted
equally/Few
authorshave
acknowledged
the implication ofthese differing assumptions,
and
this paper, along withindependent
work
by
Boschen
and Smith
(1994) isamong
the first to testthem
explicitly.^Our
empirical analysis relieson
data for 1009
CEOs
in678
firms over the 1970
through 1
990
period. It leads to the following general conclusions:1
CEO
compensation
became
significantlymore
sensitiveto firmperformance
during the
1980s compared
to the1970s, even
when
those portions of executivecompensation
derivedfrom
stock optionsand
related instruments are excluded.2.
CEO
compensation
is influencedby both accounting
profitsand
shareholderreturns.
Our
resultssuggest
that boards of directors treateach
of theseperformance
measures
as a useful independent signal of managerial performance. During the1980s,
a givenpercentage
point increase inaccounting
returns yields three to fourtimes the
average
overallcompensation
increasegenerated by
thesame
percentage
* That
is, agiven return realization hasthe
same
effecton current compensation whetherit reflects the current return or the return 10 years ago.
^ Since completing our original analysis for this paper,
we
have discovered a study that independently addresses this topic (our thanks to the Financial EconomicsNetwork
for itsdissemination of working paper abstracts!).
Boschen
and Smith (1994) use a vector autoregressive approach that relates the level of current compensation (in logs; either salary and bonus or total compensation) to current and past financial performance (measured by stockmarketratesof return) andlagged compensation, and the level of financialperformance tocurrent andpastcompensation and laggedfinancialperformance. Their analysisuses3lagsin both compensation and marketrates of return. Their estimates, based ondata for 16firms
over the
1948-1990
period, yield thesame
general conclusions as our results. Pastperformance appearsto have a significant influence on current compensation, butthe effect
is not permanent. Their study also indicates changes in performance sensitivity of pay
over
the 4 decades spanned bytheir data, although the relatively small size of their cross section
point increase in
market
returns, although thisappears
tobe
due
at least partially tothe smaller variance of
accounting
returns. For our overall sample, aone
standard deviation increase inaccounting
returns leads to roughly twice thecompensation
increase of a
one
standard deviation inmarket
returns. Failing to includeboth
accounting
and
market
returnperformance
measures
in thecompensation
equationsubstantially
underestimates
the overallimpact
of financialperformance on
CEO
pay. 3. Past financialperformance,
in addition tocontemporaneous
performance, has an importantimpact on
currentCEO
compensation.
During the1980s,
thecontemporaneous compensation
effect of an increase inmarket
return is less thanforty percent of the
cumulative compensation
increase, all else equal. For accountingreturns, the
contemporaneous
effect is roughly sixty-five percent of the overallcompensation
response.The
impact
is not infinitely persistent,however,
as implicitlyassumed
inmany
previous studies.Our
findingssuggest
that neither ofthe functionalforms
most
common
in the executivecompensation
literature accurately captures the temporal structure of the pay-for-performance relationship.4.
The
data provide virtuallyno
support for the popularview
thatboards
failto penalize
CEOs
forpoor
performance
orreward
them
disproportionately well forgood
performance.
While
much
of the increased sensitivity ofpay
toperformance
inthe
1980s
appears
due
to an increase in therewards
for positiveperformance,
thisgenerallyhas
brought
theresponse
of executivepay
togood
and bad performance
intorough
symmetry.
5.
There
issome
evidence
thatboards
discountextreme
realizations ofperformance-both
highand
low-
relative toperformance
that lies withinsome
"normal"
performance
band. This could be consistent, forexample,
withtheview
thatextreme
performance
realizations are noisyoutcomes more
likely tobe
due
to eventsbeyond
the influence or control ofmanagement,
or with efforts to limit theextreme
The
paperproceeds
as follows. In section II,we
discuss the choice of anempirical specification of the pay-for-performance relationship. Section III describes
the data
and
oureconometric
model
ofCEO
compensation.
Results are presented insection IV, followed
by
a brief conclusion.II. Empirical
Models
of the Pay-for-Performance RelationshipAn
extensiveempiricalliteratureinvestigatesthesensitivityoftop executivepay
to variations in firm performance.
Rosen
(1992) provides anoverview
ofmany
of these analyses; Sloan (1993) provides additional references to the accountingliterature
on
this topic.We
have
identified fourdimensions
alongwhich
empirical analyses tend to vary.These
are: 1)The
choice ofperformance
measure
(accounting-based, stock market-based, or both); 2)
Whether
performance
sensitivities are restricted to be the
same
or are allowed to vary across firms; 3)The
functionalform
of the compensation-return specification;and
4)The
use
of absolutereturns or returns relativeto otherfirms inthe
same
industryor overall market.To
the best of ourknowledge,
the literature is uniform in imposingconstant
performance
coefficients over time^
and
estimating a constantperformance
slope over the entirerange
of thechosen performance measure.
We
describebelow
each
of thesedimensions
ofthe pay-for-performancespecificationand
sketch itsimplicationsforourinvestigation.
1).
Stock-market
v.accounting
performance: In theeconomics
and
financeliteratures,
most
studies of the pay-for-performance relationship focuson
stockmarket-based
measures
of financialperformance
(e.g..Murphy,
1985; Jensen and
Murphy,
1990;
Gibbons and
Murphy,
1990;
Barroand
Barro, 1990; and
Hubbard
and
Palia, 1994). In contrast, studies in the accounting literature typically
use
eitheraccounting-based
measures
offirmperformance,
or includebothaccounting
and
stockmarket
measures
ofperformance
in their analysis (e.g., Antleand
Smith,1986;
Lambert and
Larcker, 1987;and
Sloan, 1993).^While
the appropriate choice ofperformance
measure
is notobvious
a priori, itseems
reasonable to expect bothaccounting
and market
measures
of firm financialperformance
to influencecompensation.
Boards
must
confront the taskof extractinginformation
about
true managerialperformance from
noisy financialperformance
realizations. Both accounting
and
market
returns aredetermined
in partby
factorsbeyond
the control or influence of the firm'smanagers.
To
the extent thatthey
alsoareinfluenced
by
thequality ofmanagerial inputsand
actions,theymay
provideuseful informationon
managerialperformance.
Given
the imperfect correlationbetween
these financial
performance
measures,
the theoretical literaturesuggests
thatcontracting
on
bothmay
enhance
the firm's ability to filter the signal of truemanagerial input (e.g.,
Holmstrom,
1979). Institutional factorssupport
this conclusion, as firmsappearin practicetouse both measures.
Compensation
contractsmost
frequently linkbonuses
toaccounting
earnings (Sloan, 1993)
whilestock-based
forms
ofcompensation,
particularly options grants, tie realizedcompensation
to stockmarket
returns.We
exploremodels
that include bothaccounting
and market-based
measures
in the specification of firm
performance.
2).
Changes
inperformance
sensitivities overtime:Most
studies of executivecompensation
estimate a single return coefficient for a panel of firmsand
CEOs
overtime.
The
primary exceptions are:accounting
studies,which
tend to estimateperformance
slopeson
a firm-by-firm basis (e.g.,Lambert and
Larcker,1987
and
^ Exceptions tothis division byfield are Kaplan (1994),
who
includes both marketreturns and adummy
variable for negative accounting earnings; and Joskow, Rose and Shepard (1993) and Rose and Shepard (1994), discussed below.Sloan,
1993,
who
explorehow
the relativemarket and
accountingperformance
sensitivities vary with their signal-to-noise ratios for
each
firm);Gibbons and
Murphy
(1992),
who
findevidence
thattheperformance
sensitivity ofpay
variesover aCEO's
career;
Schaefer
(1 993),who
developstheoreticaland
empiricalsupportfor aninverserelation
between
performance
sensitivityand
firm size(measured by
dollarchanges
in
compensation on
dollarchanges
inmarket
value);and
Boschen
and
Smith (1994),who
analyzehow
the pay-for-performancerelationshipvariesover 1948-1990
fortheirsample
of16
largecompanies.
In this study,
we
explorewhether
the sensitivity of executivepay
to firmperformance has
been
constant overtime.The
rhetoric ofcorporate proxystatements
and
business press discussions ofCEO
compensation
stronglysuggest
that incentivepay
hasbecome more
visibleand
widespread
over the last20
years.Some
empiricalsupport for this
view
is providedby
thecompensation
levels equations estimatedby
Joskow,
Rose,and Shepard
(hereafter,JRS,
1993),which
suggest
thatperformance
sensitivities for unregulated industries increased steadily
between
1970
and
1990.
To
accommodate
potentialchanges
in the sensitivity of executivepay
to firmperformance,
we
estimate separateperformance
slopes for the1970s
and 1980s.^
3).
Asymmetries
inperformance
sensitivities:We
examine
avarietyofpotentialasymmetries
inthe responsiveness of executivepay
to variations infirmperformance.
Ofparticular interestistheclaim that executive
pay
packages
have
"more
upsidethan
downside
elasticity" (Crystal,1992,
p. 98). Thisargument,
which
has attracted considerable popular attention, suggests that executivecompensation
ismore
sensitive to positive
performance
realizations than to negativeperformance
realizations.
We
test for potentialasymmetries
inperformance
sensitivitiesby
®
JRS
estimated separate slope coefficients overfive-year intervals. While there appearsto be
some
additional variation within decades, the 10-year splits reported in this paper capturemuch
of the differences over time while preservingsome
parsimony in the length ofinvestigating
whether
compensation
is unusually sensitive to very poor financialperformance
(measured by
accounting losses),whether
compensation
responds
more
to
performance
gains than toperformance
losses,and
whether
compensation
responds
differentially toperformance changes
that are withinsome
"normal" range asopposed
to outside that band.4). Functional
form
and
the temporal structure of pay-for-performance: Thisis the
dimension
on
which
empirical studies exhibit the least consistency orconsensus,
even
across differentstudiesby
thesame
author.Common
specificationscorrespond
to regressions ofthe logofcompensation
on
the share price (e.g..Murphy,
1985), dollar
compensation
on
the dollarmarket
value of the firm (e.g.,Jensen and
Murphy,
1990);changes
in the log ofcompensation
on
themarket
rate of return (e.g.,Gibbons and
Murphy,
1 990);and
the log ofcompensation on
the rate of return (e.g.,JRS,
1993).Compensation
equationsmay
be estimated in levels or first differences(changes
incompensation),
inwhich
case bothcompensation
and performance
aremeasured
aschanges
in the described variables. Studies thatuse
both accountingand market-based
returnscommonly
model
changes
in the log ofcompensation
as afunction of the level of
market
returnand
thechange
in theaccounting
return.^These
alternative specifications imply quite differentdynamic
models
of thecompensation
process. Forexample,
amodel
ofchanges
in logcompensation on
thelevel of return implies
complete
persistence in theperformance
component
ofCEO
compensation.
^°A
one-timeshock
to the firm's"normal"
return generates a^See Lambert and Larcker (1 987) and Sloan (1 993)for examples.
Some
of these studiesusethe dollar
change
incompensation, ratherthanthechange
inthe log of compensation, as thedependent variable.The
resultsreported inthispaper all uselog compensation (orits firstdifference) rather than the dollar value of compensation, to limit the potentially
disproportionate influence of observations with extremely high compensation levels.
'° Models that specify compensation to be a function of market value or share price
suggestthatsuperiorfinancialperformance priortothe currentexecutive's tenure increasehis or her current compensation, all else equal.
permanent change
incompensation,
even
asretum
recedes to itsnormal
level insubsequent
years. Alternatively, amodel
ofchanges
in logcompensation
on
changes
in return implies that the relationship
between
compensation
and performance
iscontemporaneous
only.A
one-timeshock
to return generates highercompensation
only in the current period.
Most
models
that relate logcompensation
to returnscan
be nested within asimple
dynamic
model
of the relationbetween
compensation and
firmperformance
over time: t In Compensationi t = 'n
Cq
, , +J^
pj Return j, t - s "^ ^i t *^' s=0where
Cqj, is thebase
(non-performance
related)compensation
forCEO
i in yeartand
RETURN
is themarket
return ineach
year ofCEO
i'stenure (0through
t).An
increaseof X
percentage
points inRETURN
in year (t-s) increasescompensation
in year t by ftgin this model.
The
first differenceform
of thismodel
is:'nCi , - InC i ,.1 = ( InCo ^ , - InCg j, ,., ) + Po ( Returni , - Returni ^^, ) + Pi ( Returnj ,., - Returni ,.2 ) + • . . + p,., ( Returni , - Returni g ) + p, Returni
M
e j , - e ,_ ,., ) (2)If all the return coefficients are equal (Bq
=
fi,=
...=
fi,), thismodel
collapses to a specification that relateschanges
in logcompensation
to the current level of return:(3) ( InC i , - InC ,,,_, ) = ( InC i
, - InC i,,_i ) + Po Return ^ ,
M
e
i
, - e ,,_, )
In this specification, an increase of x
percentage
points inRETURN
inany
yearincreases the
CEO's
compensation
in that yearand
everysubsequent
yearby
x(Jpercent.^^
Alternatively, if current
compensation
is a function ofcontemporaneous
financial
performance
only , then (i^=
Q>2=
=
^^=
0,and
the generalmodel
collapses to a specification that relates
changes
in logcompensation
to the firstdifference in return: ( InC i , - InC i,.i ) = ( InC i , - InC i,.i ) + Po (
Retum
, , - Return i, . , )(4,M
e i t - e i.t-1 )We
explicitly testtheseextreme
specificationsby
nestingthem
within themore
general
model
ofequation (2)and
testingwhether
therestrictions impliedby
either (3)or (4) are satisfied
by
the data.Our approach
allows us todetermine
whether
thecompensation
process
includesany
"memory,"
inthat previous financialperformance
affects current
compensation
levels, as well aswhether
this effectdecays
over time.There
is littlereason
to thinkthatthecompensation-performance
relationshipmust
be
entirely
contemporaneous
or perfectly persistent,^^even though
most
studies in the'^
Note that there is a problem of
asymmetry
in this representation of the notion ofpersistence. Ifthe marketreturn is 10 percent this year and -9.09 percent next year, so that the net
compounded
returnoverthetwo
yearsiszero,compensation ineverysubsequentyearwill be .91)9percent higherthan it would have been if the return
were
identically zero in eachyear.
12
literature implicitly
have
assumed
one
ofthetwo
extremes. Ifexecutivecompensation
depends
on
both pastand
current performance, but thecompensation impact
of pastperformance
decays
over time,we
would expect
to find that the estimated {(i] arenon-zero for
some
period, but decline as firmperformance
recedes further into the past.We
assess
thedynamics
of the pay-for-performance relationship with amodel
that includes current, one-
and
two-year lags in both accountingand
market
returns.^^
4).
Absolute
v. relativeperformance
measures:
A
number
of studies explorewhether
executivecompensation responds
to absolutemeasures
offirmperformance
or to
performance
relative to that ofsome
referencegroup
of firms (e.g., Antleand
Smith,
1985;
Barroand
Barro, 1990;Gibbons
and
Murphy,
1990; Janakiraman,
Lambert and
Larcker,1992; and
Sloan, 1993).Apart
from
Gibbons and
Murphy,
however,
most
studiesconclude
that relativeperformance
evaluation (RPE)tends
toplay a
minor
role in determining executivecompensation.
That
is,compensation
responds
primarily to a firm'sown
return rather than to its return relative tosome
benchmark
group
of firms. Moreover, itappears
thatRPE,
if it operates at all, isstrongest for quite broad reference groups,
corresponding
to 1 -digit SICcode
industries or
perhaps
themarket
as a whole. Finally, the slope of thepay-for-performance
relationshipseems
to be quite robust to the inclusion or exclusion ofreturns for alternative reference
groups
(seeGibbons and
Murphy,
1990). In light of these previous results,and
to limitthedimension
oftheperformance parameter
vectorwe
estimate,we
adopt
a specification that implicitlymeasures
returnand
'^ First-difference models with
two
lagsmay
be estimated only for observations inwhich
the
CEO
has four ormore
years oftenure.We
have experimented with longer lag structures, but these lead to substantial loss in data given the averageCEO
tenure of 7 years in our fulldataset. Forthis reason,
we
restrictthe resultsreported hereto relatively short performancehistories. Because the performance impact on current compensation declines considerably over even the
two
year lagswe
consider, this restriction does notseem
unreasonable.compensation
relative to the overallmarket
(by including individual year effects in theregression model), but
do
not investigate theRPE
hypothesisany
further.'*III.
Data
and
EmpiricalMethodoloqv
We
model
CEO
compensation
as a function of firm scale, firm financialperformance,
CEO
characteristics,and
industryand market-wide
norms
in executivepay.
The
dataused
tomeasure
these variables are describedbelow.
We
next sketch the basic regression model,which
is similar tomodels
used by
JRS
(1993) toinvestigate
compensation
differentials acrossregulatedand
unregulated industriesand
by
Rose
and
Shepard
(1994) to explore the effects of firm diversificationon
compensation.
We
finallysummarize
our tests of thekey
restrictionson
theperformance
sensitivityparameters
of executivepay
that are implicit in this model.Data
Our
database
isdeveloped from
three primary sources. Informationon
CEO
compensation
and
CEO
characteristicswere
obtainedfrom
Forbes' annualCEO
compensation
survey
over1970-1990.
Informationon
firm characteristicsand
accounting profitability
come
from
COMPUSTAT,
and
fiscal year stockmarket
returns arefrom
theCenter
forResearch
on
Security Prices(CRSP)
return files.'^To
reduce
non-comparability across firms
we
exclude those in industries subject toeconomic
regulation
and those
in financial services, usingCOMPUSTAT's
primary SICcode
"*
We
also include aggregated 2-digit SIC industry fixed effects,which
implicitly controlfor industry average performance over the entire sample period (see
JRS
for a description).The
dimension ofthe performance parameter space (K) for ourchosen specification suggests theprudenceofsuppressing anexplicitinvestigation ofRPE
parameters,which
would increase the parameter vector to 2K. In our simpler specifications, K=
10; this increases quickly to K= 20
or K= 30
aswe
relax various restrictions.assignment
to deternnine industry affiliation.^^Because
some
of the specifications thatwe
present include first differences incompensation and up
to two-period lagsin
performance
variables,we
work
with a basicsample
ofCEO-years
forwhich
we
observe
at leastone
prior year ofcompensation and
three prior years ofperformance
data.
These
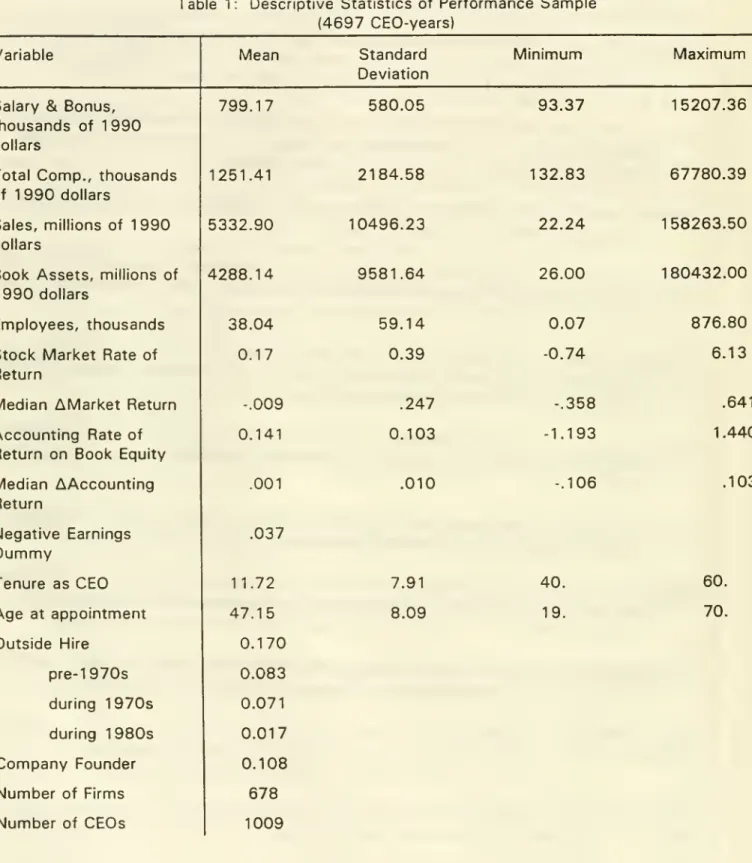
criteria yield a panel data set of4697
observationson
1009
CEOs
in678
firms. Descriptive statistics for this
sample
are reported in Table 1 . Variables aredescribed below.
Compensation
Measures:
We
reportresults fortwo measures
ofcompensation.
The
first,SALARY,
includes currentand
deferred salaryand bonus.
This generally isthe least inclusive
measure
ofcompensation
reported by Forbes,and
its definition isrelatively consistent over the entire
sample
periodwe
analyze.^^ RealSALARY,
in1990
constant dollars,grew
at anaverage
annual rate of4.0%
for our sample,and
averaged
$799,000
overall. Despite this growth,SALARY
accounts
for a decreasing share of overallcompensation
over time. Salaryand
bonus payments
averaged
82%
of total
compensation
reportedby
Forbes
for our sample,and
the ratio of salaryand
bonus
to totalcompensation
declinedby
an average of 1 .1percentage
points peryearbetween
1972
and 1990.
The
second
measure
ofcompensation,
TOTAL,
is themost
inclusivecompensation measure
reportedby
Forbes, although itscomponents
vary considerablyover time as
SEC
reporting requirementsand
Forbes's reportingformat change.
TOTAL
includes salaryand bonus,
contingentcompensation excluded from
SALARY,
the
cash
value ofcompany-provided
benefits (such ascompany-paid
life insurance,private automobiles,
and
drivers),and
realized net gainsfrom
the exercise of stockoptions, stock appreciation rights,
and
stock accrual rights.TOTAL
compensation
in^^JRS discussthe significant differences inthe compensation relationship
between
CEOs
of firms subject to economic regulation and those that are not.
'^ Forbes does not report base salary
1
990
constant
dollars averaged $1 .25 million for our sample,and
grew
at anaverage
annual rate of
5.9%
between
1972
and 1990.
While
TOTAL
is themost
inclusivemeasure
ofcompensation
we
have, itstreatment of stock options, appreciation rights,
and
accrual rights prevent itfrom
accurately
measuring
overall currentcompensation.^®
This will induce a "lumpiness"in reported
TOTAL
compensation
thatmay
limit its usefulness in our analysis,even
though
totalcompensation
(correctlymeasured)
is the theoretically appropriateconstruct
on
which
this analysis should focus.Firm Scale:
The
relationshipbetween
CEO
compensation and
firm size isone
of the
most
consistent empirical results in thecompensation
literature, withmost
studies reporting a
compensation
elasticity with respect to firmrevenues (SALES)
ofabout
.25 (Rosen, 1992).We
have experimented
with a variety of scalemeasures,
including
SALES, book
assets,and employees.
The
firms in oursample
are largeon
all three dimensions.
They
average$5.3
billion in1990
constant dollar sales,$4.3
billion in
constant
1990
dollar assets,and
38,000
employees.
Because
the estimatedpay-for-performance
relationshipappears
tobe
reasonably robust to alternativedefinitions of firm scale,
we
report results only for specifications thatuse
SALES,
thedominant measure
of firm scale in thecompensation
literature.Firm Financial Performance:
The
basic constructs thatwe
use
tomeasure
firmperformance
are stockmarket
rates of returnand
accounting rates of return.The
market
return(MKTROR)
is the annual rate of return tocommon
equity shareholders during the firm's reported fiscalyear,and
is constructedfrom
CRSP
return tapes.The
'^
As
noted inJRS
(1993), an ideal
measure
of total compensation would include the ex ante value of options grants (or similar instruments) in the yearthey areawarded
and the ex postchange
in the value of previouslyawarded
(as yet unexercised and unexpired) options each year. Itseems
impossible to construct these exactmeasures, and difficult to construct even close approximations to them, from1970
through1990
proxy statements.SEC
reportingrequirements inplacefor1993
and subsequentyears'proxystatementsshouldmake
accounting rate of return
(ACCROE)
is defined as reported earnings excludingextraordinary items divided
by
totalcommon
equity (book value),and
is constructedfrom
COMPUSTAT
data.^^Although
themeans
of thesetwo
returnmeasures
areroughly
comparable,
stockmarket
returns exhibitmuch
greater variance:Stock
market
returns for oursample
average17%,
with a standard deviation of39%.
Accounting
returnsaverage
14%,
with a standard deviation of10%.
The
two
measures
are correlated at the .18 level in our data.From
these basic constructswe
define anumber
of additionalperformance
measures
that areused
in our analysis ofasymmetric performance
sensitivities.
NEGATIVE
EARNINGS
isan
indicator variable equal toone
forobservations with
negative reported
accounting
earnings during the period.MEDIAN_^MKTROR
and
MEDIAN_^ACCROE
are variables thatdenote
the annualmedian
change
inmarket
and
accounting returns, respectively, for the fullJRS
dataset of unregulated,nonfinancial
companies.
We
use these variables to separate oursample
observationsinto
companies
thathave
close tomedian performance
changes
in a given year
and
those
whose
performance
change
is substantiallyabove
orbelow
the median.This
allows us to test
whether
performance
sensitivities aredampened
at the highor
low
extremes
ofperformance.
CEO
Characteristics:The
levels equationsmodel
logcompensation
as afunction of
CEO
characteristics as well as the variables described above.These
characteristics include the
CEO's
tenure in theCEO
position(TENURE),
his/her
age
atappointment
totheCEO
position (AGE)
, anindicator variable forwhether
theCEO was
an
appointment
from
outsidethe firmasopposed
toan
internalpromotion (OUTSIDE),
and
an indicator variable forwhether
theCEO was
thefounder
ofthefirm(FOUNDER).
^«This definition poses a problem
when
a firm's chron.caccountmg
'°=^^^%^^7,"^'^^,\^°°^value of its
common
equ.ty through zero.We
defineACCROE
to be ^'^^^;:^9jf he book ,^3
of equity is negative and therefore exclude these observations
16
These
variablesand
their empirical effectson
compensation
are described inconsiderable detail in
JRS
(1993).To
conserve
space, their coefficients are not reported in the tables below.^°A
regressionmodel
ofCEO
compensation
The
basiceconometric
specification ofthecompensation
equation followsfrom
our earlier
work
(JRS), but isexpanded
to investigate a richer specification of theperformance
variables thatmay
influence aCEO's
compensation.
The
basiccompensation
equation is specified as:ln(CEO
COMPENSATION,,,,
) = /ff, ln(SALES,, ) + yff'zPERFORMANCE;
i
^)S3CE0TEN,i, -)?4AGE,,
+ /?5OUTSIDE,,
+ /?6FOUNDER,
j ^ Oy * ^r ^ f„k, . [5]where
Idenotes
theCEO,
j
denotes
the firm, kdenotes
the primary industryidentification,
and
tdenotes
the year. Industry effects, a,^, aremeasured
at anaggregated
two-digit SICcode
level.These
incorporate theimpact
of industry-level variables, including industry-widecompensation norms,
on
executive pay.Year
effects, 6^ ,
accommodate
nonlinear (andnon-monotonic)
economy-wide
trends inrealCEO
compensation
over thesample
period.The
error term, Sjj^j ,may
includeCEO-specific effects.
Any
endogeneity
between
theseand
theindependent
variablesinthe^°These variables are incidental to our current analysis. Their estimated coefficients are
quite stable and consistent with our earlierresults.
CEO
compensation increasesveryslightlywith a
CEO's
ageatappointment and tenure.CEOs
appointed from outside are paidmore
and founders are paid less, other things equal.model
can
be treated by estimating themodel
in first-differences rather than levels,and
we
investigate both specifications in the results reported below.^'Performance
Specification:The
influence offirmperformance on
executivepay
is represented inthisequation
by
theterm
yS2'PERF0RMANCE, where
PERFORMANCE
is a vector of financial
performance
variablesand
132 is the vector of associatedparameters.
We
begin with a highly restricted model, similar to that estimated inmany
previouscompensation
studies, inwhich
RETURN
is a single variable,MKTROR,
and
p2 's a scalar parameter.We
next relax theassumption
of a singleperformance
parameter
aswe
introduce progressivelymore
flexibility into the estimatedpay-for-performance
relationship.We
expand
thedimension
of theRETURN
vector to include current accounting returns(ACCROE),
relax the restrictionon constant performance
sensitivities over time, explore the role of
memory
in the pay-for-performancerelationship,
and
finally test forasymmetries
inperformance
sensitivities.IV. Empirical Results
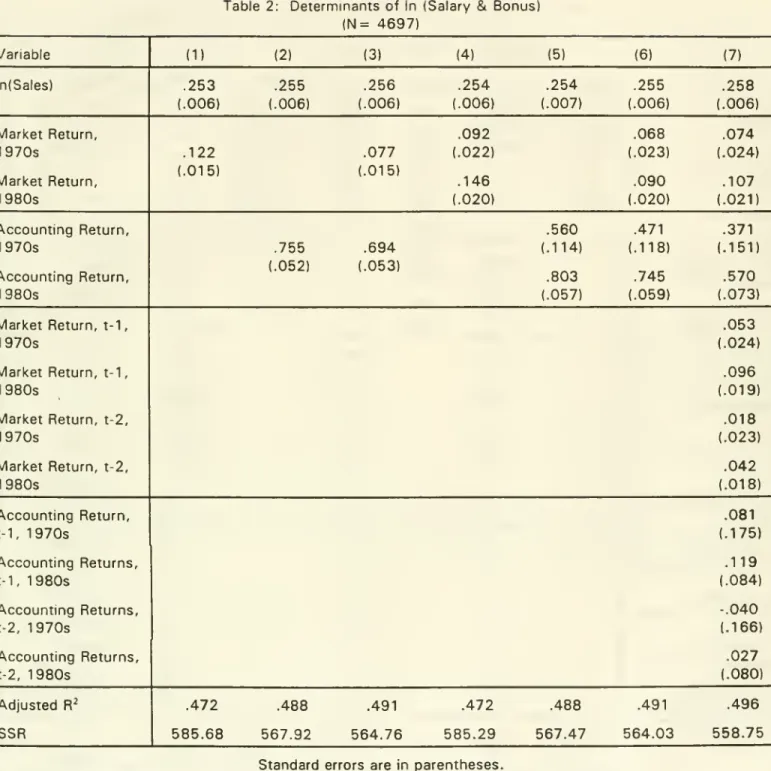
Table 2 presents results
from compensation
level equations thatuse
In(Salary&
Bonus)
as thedependent
variable.To
keep
the size of the tablesmanageable,
we
suppress
all coefficientsexcept
those for firm sizeand
theperformance measures.
Column
1 displaysresultsforthe simplest model,which
includes current stockmarket
return as the sole
performance
measure
and
restrictstheperformance
semi-elasticityto
be
thesame
for all observations.The
coefficienton market
return implies that a10
percentage
point increase in themarket
return (about one-quarter of thesample
standard deviationof
MKTROR)
increases salaryand
bonus
by
roughly 1.2%
(standarderror, .2%). This is broadly similar to results
from
previous empirical studies (see21
A
fixed-effects estimator also would be appropriate, but is not as widely used in this
literature as thefirst-differencemodel.
To
enhancethe comparability ofour results with those ofmost
earlier studies,we
therefore choose to use first-differences.Rosen, 1992).
Column
2,which
substitutes the accounting rate of return as the singleperformance measure,
impliesthata 1percentage
point increaseinaccounting
return (corresponding to
one
standard deviation increase in this variable) increases salaryand
bonus
by about
7.6%
(.5%).The
results incolumn
3 include bothaccounting
and market
returns,and
suggest
thatboth
measures
are important determinants of executive pay. In thisspecification, the
pay
sensitivity to a 1percentage
pointmovement
in return is0.8%
(0.2%)
formarket
returnsand
6.9%
(.5%) foraccounting
returns. Thus,even
when
both return
measures
are included in the regression, the semi-elasticity ofpay
isan
order of
magnitude
larger for accounting returnsthan formarket
returns. This patternis consistent with results
from
previous studies thathave
includedaccounting
rates of returnand
with the observation thatcompensation
contracts aremuch
more
likelyto
base
bonuses
on
explicit accountingperformance
targets thanon market-based
targets (e.g.,
Lambert and
Larcker, 1987).Given
theeconomic
and
statistical significance ofboth
accountingand market
returns in determiningCEO
pay,we
focus
our remaining attention
on
specifications that include bothmeasures.
Columns
4
through
6 repeat the first three specifications, but allow theperformance
slopes to differbetween
the1970s
and 1980s.
The
data clearly reject the restriction of constant slopes over time.^^ Incolumn
6,which
allowsboth
market and accounting
returnparameters
to differ overtime, theperformance
slopes increaseby
one-third to one-halfbetween
the1970s
and
the1980s.
Thissuggests
that the increasing
emphasis on
incentivepay
over thesample
period carriesthrough
to salaryand
bonus
decisionsand
is not solely a function of increaseduse
of stock options incompensation
packages.^^
The
test of constant performance slopes over the 1
970s
and 1980s
for thespecifications that include both accounting and marketreturn (column 3 v.
column
6oftable2) yields an F-statistic of 3.04, distributed as F(2,4697).
The
critical value for F(2, oo, .95)Finally,
column
7 estimates themore
generaldynamic
performance
specification,
based on
equation (1). Thiscolumn
reports resultsthat include currentand
two
lags foreach
returnmeasure."
The
resultsfrom
thismodel
ofcompensation
level strongly reject both of the simplemodels
of pay-for-performancedynamics:
pastperformance
has an influenceon
currentcompensation,
but thatinfluence is not perfectly persistent overtime.^'*
The
dynamic
pattern ofperformance
effectson
compensation
differsconsiderably
between
accountingand market performance measures.
The
estimatedoverall
impact
of accounting returnon
pay
is roughly constantbetween
thecontemporaneous-only (column
6)and
generaldynamic
(column
7) specifications, but including laggedaccounting
returns shiftsabout
20%
of the estimatedweight
to theprevious years' return
measures."
The
resultssuggest
that a10
percentage point increase inaccounting
returns during the1980s
generates
anaverage
cumulativeincrease in salary
and
bonus
equivalent to7%
ofone
year'scompensation."
In contrast, the estimated impact ofmarket
returnson
executivepay
is
substantially higher in the unrestricted
dynamic
model, relative to the"
We
chose this cutoffto conserve data and because the effect of past performance oncurrent compensation appearstodecay considerably beyond the first
two
lags. Thisreflects
ourviewofthe trade-off
between
estimating additional lags inthe performance vanabies and reducing sample size by restricting the analysis toCEOs
with increasingly long average tenures.2*
The
F-statistic for the testthat the coefficients on all lagged return measures are zero is 5 48, distributed as F(8,4641). The F-statisticforthe test that thecoefficients on current
and lagged returns are equal (but different for market and accounting returns, and different
between
the1970s
and 1980s), is 5.82, distributed as F(8,4641).The
critical valuefor
F{8,oo,.95) is 1.94.
"
For example, in the 1980s, thesum
of the coefficients in column 7 (.707) is slightlylower than the point estimate in column 6 (.742), but well within the standard error of
the
estimates (.055 for
column
6).2^ Because this increase is realized over3 years, itspresent discounted value is
somewhat
contemporaneous-only
model
ofcolumn
6.The
effect of currentmarket
returnon
current
pay
is slightly higher incolumn
7 than incolumn
6 (though withinone
standard error),
and
the laggedmarket
returnterms
more
than double
that impact. Inthe 1 980s, for
example,
a 1percentage
point increase inmarket
return generatesan
average
1.1%
(.2%) increase in currentcompensation,
1.0%
(.2%)
increase in nextyear's
compensation,
and
0.4%
(.2%) increase in the following year'scompensation.
The combined
effect isequivalentto a one-timeincrease ofroughly2.5%
in salaryand
bonus.
These
resultssuggest
that levels specifications thatassume
thepay-for-performance
relationship isonlycontemporaneous
underestimate
theimpact
ofmarket
performance
on
CEO
pay.We
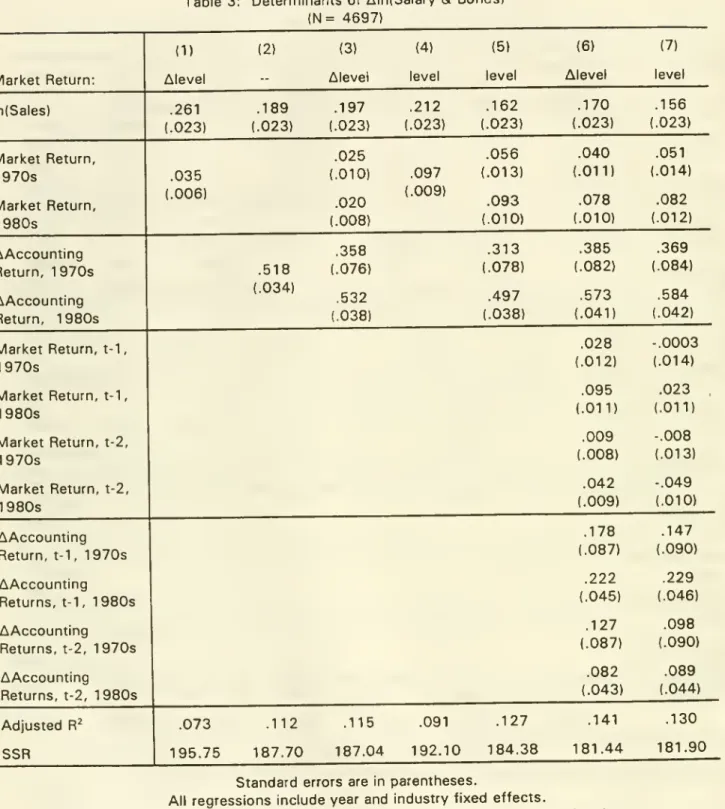
explore the intertemporal structure of thepay-for-performance
relationshipin further detail in table 3, using first-difference
models
ofcompensation.
These
regressions
model
changes
inIn(SALARY)
asa function ofchanges
in In(SALES), yearand
industry effects,and
alternative specifications of theperformance measures.
To
limit the size of the table,
we
use
changes
inaccounting
return in all specificationsthat include an
accounting
measure
of performance.We
vary the specifications toexamine
both levels ofmarket
returnand
changes
inmarket
return.Columns
1, 2,and
3 in table 3model
changes
inIn(SALARY)
as a function ofchanges
inmarket
returns.These
correspond
to simple first-difference estimates ofthe specifications reported in
columns
1 , 2,and
6of table 2.These
restricted models,based on
equation (3), implicitlyassume
no
"memory"
in thecompensation
process:a one-time
shock
to return generates a one-timeshock
tocompensation.
The
estimated coefficients are considerably smaller than
those
reported in table 2,suggesting that positive correlations
between
unobserved
CEO-specific effectsand
firm
performance
may
overstate theperformance
sensitivity ofpay
incompensation
Columns 4
and
5 of table 3model
changes
inIn(SALARY)
as a function of thelevel of
market
return.These correspond
to the restrictedmodel
of equation (4),which
assumes
thatperformance
effects are perfectly (and infinitely) persistent: a one-timeshock
to the firm'smarket
return triggers apermanent
increase in currentand
futurecompensation.
These
results implymuch
greater sensitivity of executivepay
tomarket
returns thando
thecolumn
1-3 results.The 1980s
market
returncoefficient of
.093
(.012) incolumn
5 implies that an additional 1percentage
pointsin
market
return generates an increaseof9.3%
insalaryand
bonus
inthe current yearand
in ailsubsequent
years.These
estimates arecomparable
tothose
reportedby
Gibbons
and
Murphy
(1990) for asomewhat
differentForbes sample and
slightly modified, but similar,compensation
equations.^'The
choice of functionalform
makes
a significantdifference to the fit of theserestricted equations.
A
minimum
leastsquared
errors testwould
preferthe restrictedmodel
of equation (4) to the restrictionsimposed
by
equation (3)(compare
theSSR
ofcolumns
1and
4
or ofcolumns
3and
5). Ifone
is forced tochoose between
one
of
these
two
highly simplified specifications,assuming
thatperformance
effects are perfectly persistent appears to better satisfy the data.As
in the levels equations,however,
this specification is strongly rejected in favor of themore
generaldynamic
model
of equations (1)and
(2).Column
6 of table 3 reports results for the generaldynamic
performance
structure. This
model corresponds
to first-difference estimates of the specification reported incolumn
7 of table 2,and
isbased on
the first-difference equation (2)."
The
Gibbons andMurphy
sample covers a shorter time period (1974-1986) but largersample of CEO-years than does ours (due partially to our exclusion of financial sector and
regulated firms and the elimination of the first three years of each
CEO's
tenure due to the data requirements of our lagged return structure tests). Gibbons andMurphy
do not includesales and do include various industry return measures as variables in their compensation equations.
These
estimates decisively reject both the restriction thatperformance
effects arecontemporaneous
only^^ and the restriction that theperformance
coefficients areconstant over time.^^
The
pattern of coefficients highlights thereasons
these restrictions are rejected. Focusingon
the1980s,
formarket
returns the previousyear's stock
market performance appears
tohave
about
thesame,
or slightlymore,
impact
on
currentcompensation
asdoes
currentmarket
returns (.078 (.010) forcurrent,
.095
(.011) for laggedonce
returns).The
impact
of previousmarket
performance
on
currentcompensation drops
quite sharply afterone
year,however.
The
coefficienton
returnsfrom
year t-2 is less than halfthemagnitude
of the returnscoefficient for year t-1, at .042 (.009).
Accounting
return coefficients exhibit asmoother
pattern ofdecay
over time, decliningabout
60
percenteach
yearfrom
thecontemporaneous
return impact of.573
(.040). Nevertheless,assuming
that pastaccounting
returnshave no
impacton
currentcompensation
misses
about
35
percentofthe
cumulative
three-yearcompensation response
to ashock
inaccounting
returns.Finally,
we
note that themarket
return estimatesfrom
the generaldynamic
first-difference
model
incolumn
6, table 3, are quite similar to those of the levelsmodel
in
column
7 of table 2. Thismay
suggest
that the differencesbetween
thesetwo
estimation
methods
for thecontemporaneous-only
model
aredue
more
tomis-^^
The
F-tests forthe restrictionthat lagged marketreturn coefficients are zero is 22.08,
distributed as F{4,4647); that lagged accounting return coefficients are zero is 7.40,
distributed asF(4,4647);thatalilaggedperformancecoefficients arezerois 17.94,distributed
as F(8,4647).
The
.95 level critical values are: F(4,cx3)=
2.37, F(8,oo)=
1.94.^^
The
F-statistic for the testthat current and lagged market return parameters are equal (within decade) is 10.86, distributed as F(4,4647); that current and lagged accounting parameters are equal (within decade) is 25.54, distributed as F(4,4647); and that both of these sets ofrestrictions are satisfied is 21 .35, distributed as F(8,4647).
The
.95 level criticalspecification of the pay-for-performance relationship than to correlation
between
30
returns
and
a CEO-specificcomponent
of the error term.For
completeness,
we
report incolumn
7 of table 3 estimatesfrom
a firstdifference
model
that uses the level ofmarket
returnand
its lags rather thanfirst-differences in
market
return. This is similar to themodel
thatassumes
completelypersistent
market performance
effects incompensation
(e.g.,column
5 of table 3).Ifthis
assumption
is correct, thecoefficientson
the laggedmarket
returnterms
shouldbe zero.^*'
As
expected from
the results incolumn
6,which
nestthis
model
as a special case, the data reject this restriction.^^ For the1980s,
the previous year'smarket
returnhas
a slightly larger impacton
currentcompensation
thandoes
the current year's return (the coefficient of.023
(.011)on
lagged return is properlyinterpreted as the incremental effect over the current return coefficient).
The
market
return
from
two
yearsago has
less than half theimpact on
currentcompensation
as the currentmarket
return,however,
asevidenced by
its negative point estimate of -.049 (.010).Given thesuperiority ofthe general
dynamic
specification in boththe levelsand
first-difference equations,
we
focus our attentionon
variants of thismodel
in the
remaining analysis.
30
The
coefficients on current and lagged market return for the1980s
are quite similaracross these
two
tables.The
first difference estimates yield slightly lowercoefficient
estimates for market returns during the 1970s, and slightly higher estimates
for lagged
accounting returns (though within astandard error).
The
similarity of resultsacrosslevels and first-difference estimates providessome
incidental support for theconsistency ot the underlying model.
^'
Returning to the general dynamic specification in first differences, equation (2), the
coefficient on
contemporaneous
marketreturn is So, the coefficient on thefirstlag of market return is (fl, - %), and the coefficient on the second lag of market
return is ((^2 - li,).
me
complete persistence model
assumes
that Bg=
K,=
1^2=
•••~
^r32
The
F-statistic fortherestriction thatthe coefficients onthe laggedmarket returntermsTable
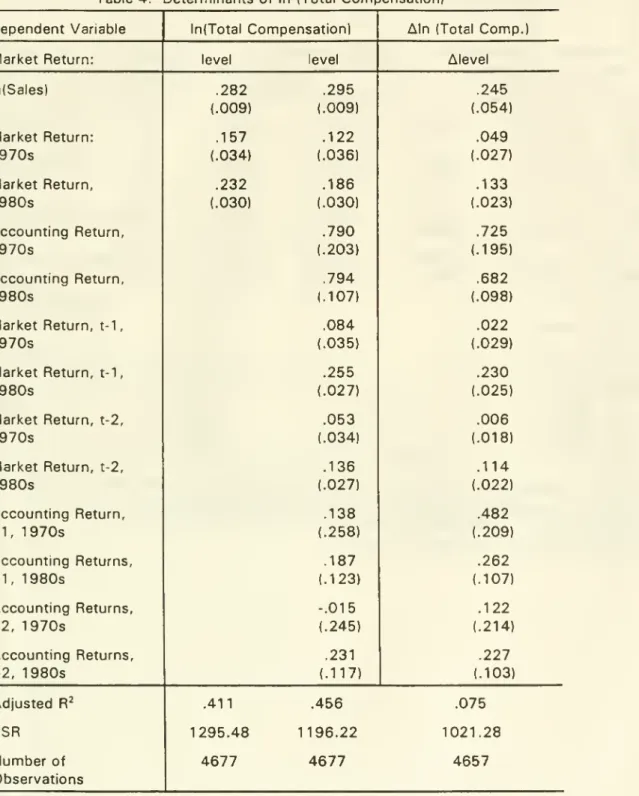
4
replicates the analysis of Tables 2and
3 using totalcompensation
(TOTAL)
rather than salaryand
bonus
as the nneasure of executive pay.Column
1reports the simplest
performance
specification (market return only, with slopes splitby decade)
for comparability with table 2and
previous studies.Columns
2and
3report results
from
the "fulldynamic"
specification, estimated in levels (2)and
first-differences (3). Total
compensation
is, not surprisingly,more
responsive tomarket
performance
variations than is salaryand
bonus,and
the sensitivity increasedmarkedly
during the1980s.
As
in the salaryand
bonus
results, pastperformance
influences current
compensation
but the effectdecays
after the first lag.-^-' In thefirstdifference
model
ofcolumn
3, a10
point increase in currentmarket
return duringthe
1980s
increases totalcompensation by
1.3%
(.2%) this year,2.3%
(.3%) nextyear,
and
1.1%
(.2%) the following year, for a cumulative effect equivalent to a one-year increase of4.7%.
This ismore
than twice thecumulative
market
return effecton
salaryand
bonus
(column
6, table 3).^'*Perhaps
more
surprising is the strongersensitivity of total
compensation
to accountingperformance:
thecumulative
effectof a
10 percentage
point increase in accounting returns inthismodel
is 1 1.7%, about
a third larger than the cumulative effect of accounting return increase
on
salaryand
bonus
(column
6 of table 3)."
The
estimates in both columns 2 and 3 reject both ofthe restricted models ofthepay-for-perf
ormance
relationship. Forthefirst-difference model, the F-statisticforthetestthattherelationship is
contemporaneous
only is 21.00 formarket returns, 13.81 for both market andaccounting returns, distributed as F(4,4609) and F(8,4609) respectively.
The
F-statistic forthe test that the relationship is perfectly persistent (equal performance slopes over time) is
10.26 for market returns and 8.51 for both market and accounting returns, distributed as F(4,4609) and F(8,4609) respectively.
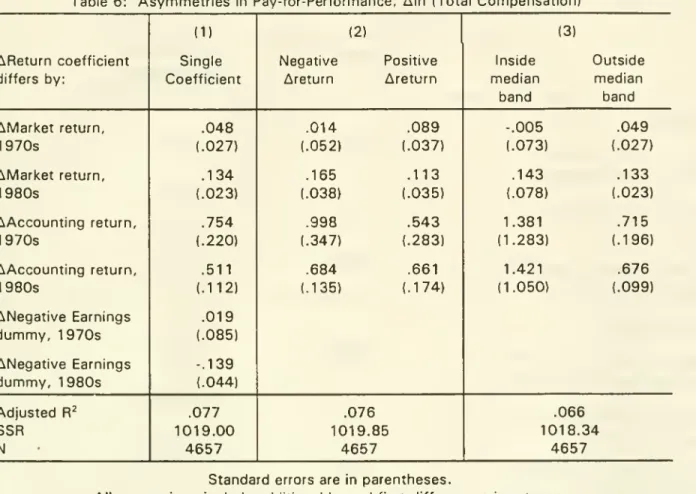
^*
The
larger impact of past marketreturns on total compensation than on salary and bonus is not unexpected, given the construction of