HAL Id: hal-02382408
https://hal.archives-ouvertes.fr/hal-02382408
Submitted on 27 Nov 2019HAL is a multi-disciplinary open access
archive for the deposit and dissemination of sci-entific research documents, whether they are pub-lished or not. The documents may come from teaching and research institutions in France or abroad, or from public or private research centers.
L’archive ouverte pluridisciplinaire HAL, est destinée au dépôt et à la diffusion de documents scientifiques de niveau recherche, publiés ou non, émanant des établissements d’enseignement et de recherche français ou étrangers, des laboratoires publics ou privés.
3D phase-field computations of microsegregation in
nodular cast iron compared to experimental data and
CalPhad-based Scheil-prediction
Janin Eiken, Emir Subasic, Jacques Lacaze
To cite this version:
Janin Eiken, Emir Subasic, Jacques Lacaze. 3D phase-field computations of microsegregation in nodular cast iron compared to experimental data and CalPhad-based Scheil-prediction. Materialia, Elsevier, 2019, pp.100538. �10.1016/j.mtla.2019.100538�. �hal-02382408�
1
3D phase-field computations of microsegregation in nodular cast iron compared to
experimental data and CalPhad-based Scheil-prediction
Janin Eikena, Emir Subasica, Jacques Lacazeb aAccess e.V., Aachen, Germany
bCIRIMAT, Université de Toulouse, Toulouse, France
The redistribution of solute elements during processing of a nodular cast iron alloy was simulated for the first time comprehensively over time and 3D space. Numerical predictions had so far been limited to 1D models, neglecting local morphological aspects and commonly also diffusion and growth in solid-state. Application of the standard multi-phase-field method was hindered by the inherent simplifying assumption of equal and constant molar volume, causing artificial piling-up of solute and biased kinetics during mod-elling of graphite growth. A recently developed volumetric multi-phase-field approach now accounts for the changing partial molar volume of the individual elements. The Calphad-based phase-field study was benchmarked to experimental cooling and nodule density data, and the predicted as-cast distributions were validated by experimental segregation analysis. The combined numerical and experimental findings were furthermore used as a basis to discuss simplifying assumptions commonly made in 1D Scheil-type models.
1. Introduction
3D computations of microsegregation contribute to a better understanding and control of microstructure evolution and as-cast material properties. The multicomponent multi-phase-field (MMPF) method [1,2] implemented in the Micress® software [3] offers the possibility to simulate microsegregation in a compre-hensive way under consideration of finite liquid and solid diffusivities, nucleation conditions and morpho-logical aspects. The coupling to thermodynamic databases enables handling of complex multicomponent multiphase quasi-equilibria, while diffusion matrixes can consistently be derived from mobility databases. Calphad-coupled MMPF simulations have become state of the art for steels [3,4] and many other technical alloys [5-7], however not yet for alloys that exhibit significant volume change during solidification. This is especially true for nodular cast irons where graphite forms in a divorced eutectic transformation, with graphite expanding upon crystallization while austenite is shrinking. While the volume change itself might be of minor interest for microsegregation prediction, it is indispensable to consider the intrinsic transport of matter and solute, since all elements forming part of the material are changing position as consequence of local expansion or shrinkage. Neglect of the expansion-related solute transport during simulation of nodular cast irons was found to result in unrealistic kinetics and incorrect microsegregation prediction [8]. In the present work, a novel volumetric multi-phase-field (Vol-MMPF) approach [8], which in contrast to the standard MMPF formulation [1,2] accounts for volume change and related matter and solute transport, was applied to study microsegregation in a representative nodular cast iron alloy. Phase-specific partial molar volumes were evaluated as function of temperature and composition from the linked Calphad da-tabase.
Microsegregation in cast irons is of importance as it affects the mechanical and chemical properties of cast iron not only directly, but also indirectly by its interplay with microstructure evolution. Negative seg-regation of graphitizers (Si, Al, Cu, Ni) and positive segseg-regation of cementite stabilizers (Mn, Cr, Mo, V) is known to decrease the stable graphite-austenite eutectic transformation temperature and promote for-mation of detrimental intercellular carbides in the last stage of solidification, while local impoverishment of nodularizers (Mg, Ce) may affect the graphite morphology [9-12]. High concentration gradients of spe-cific substitutional elements such as Ni and Si are expected to reduce the carbon diffusion flux and thus
2
favour detrimental chunky growth [15]. Microsegregation also controls the subsequent solid-state eutec-toid transformation with some of the named elements promoting ferrite, while others promoting pearlite formation [16-19]. In the studied representative nodular cast iron alloy (Fe-3.66 C-1.97 Si-0.18 Mn-0.048 Mg), diffusion of C controls the overall evolution kinetics, Si is acting as graphitizer, Mn as carbide-stabi-lizer and Mg as nodularizer.
To our knowledge, this is the first time that microsegregation during processing of a multicomponent cast iron was simulated in 3D space. A previous multicomponent 2D MMPF study [20] was restricted to nucle-ation and growth of graphite in the early solidificnucle-ation stage where volume change is still negligible. The important role of volume change during graphite growth was demonstrated for a binary Fe-C alloy by 2D cellular automaton simulations [21,22], however the pragmatic way expansion was handled is not extend-able to multicomponent alloys. A general problem of 2D simulations compared to 3D simulations is that diffusion lengths are systematically overestimated because the volume to radius ratio of the nodules and the surrounding shells is not correctly reproduced. To date, 1D models based on spherical coordinates are still the method of choice to predict microsegregation in cast iron alloys. The majority of existing mod-els is based on the Scheil approach, i.e. the mass balance is solved for a closed volume under assumption of infinite diffusion in liquid and zero diffusion in solid phases [23]. Scheil-type models neglect local mor-phological aspects and cannot provide multidimensional distribution maps, but allow for a fast estimation of solute contents as function of solid fraction. The predictivity of Scheil-type models was in early applica-tions [24,25] still limited by use of calibrated partition coefficients, but strongly increased with combined multicomponent thermodynamic modelling [26]. For comparison with the Vol-MMPF simulations, we gen-erated concentrations curves with the TC-Scheil module of the ThermoCalc software [27]. The TC-ap-proach is in contrast to some extended Scheil-type models [28,29] merely based on thermodynamic data and does not consider any process conditions. Among other aspects, we try to clarify the controversially discussed question wether change in cooling conditions or nodule density has a strong impact on mi-crosegregation [12-16, 28-31].
The study further encompasses a casting experiment to provide realistic process conditions for input and to validate the Vol-MMPF simulations. The paper starts with a description of the experimental cast-ing procedure and the experimental microsegregation analysis. Afterwards the novel Vol-MMPF-ap-proach is explained, followed by the simulation scenario and the numerical microsegregation analysis. Both experimental and numerical results are then discussed together and eventually compared to Scheil predictions.
2. Experimental procedure
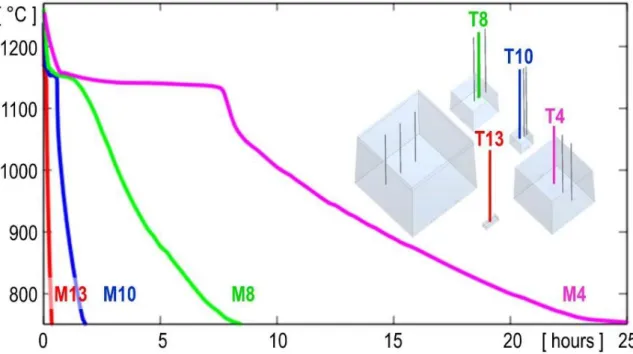
The samples used in this work were obtained by casting a ferritic SGI grade EN-GJS-400-18-LT in a furan resin sand mould. The total casting weight – including gating system and pouring basin – was approx. 6000 kg. The casting experiment was carried out using an induction melting furnace, an automatized magnesium-wire melt treatment, in-ladle inoculation and manually controlled melt pouring. The melt qual-ity was controlled by Quik-Cup thermal analysis and composition measurement in the foundry laboratory using LECO analysis for carbon and sulphur and mass spectrometry for all other elements. The melt temperature was measured by use of a thermocouple lance during successive stages of melt preparation. Just before pouring, it was 1320°C and the chemical composition was slightly hypoeutectic at 3.66 C, 1.97 Si, 0.18 Mn and 0.048 Mg (in weight % with all other elements as traces). The casting geometry consisted of five blocks of different sizes which enabled studying the effect of varying cooling rates. All blocks but the smallest one (50 x 50 x 150 mm) were cube-shaped with edges of 150, 300, 500, and 750 mm. The temperature profiles were recorded during solidification and subsequent cooling to room tem-perature by 13 type N thermocouples. Four samples - named M4, M8, M10, and M13 - were taken from defined positions, such that the metallography analysis could clearly be related to the recorded tempera-tures profiles T4, T8, T10, and T13 depicted in figure 1.
3
Figure 1: Measured cooling curves for samples M4, M8, M10 and M13.
From each of the four samples, five micrographs were prepared to characterize the graphite nodule size and spatial density. The nodule density NA, the nodule diameters DA, and the overall fraction of graphite fG were evaluated using an automatic image analysis software. To avoid bias by micropores or inclusions, only graphite nodules with a diameter above a certain threshold were taken into account [32]. Area fraction and volume fraction of graphite were assumed to be equal. 3D nodule densities NV and mean diameters d̅V were derived in two different ways: a) based on the simplifying assumption of randomly distributed mono-sized spheres and b) based on Saltykov’s method of inverse diameters [33]:
NV= NA d ̅V with a) d̅V= 4 π d̅A or b) dV = π 2 (dA −1 ̅̅̅̅̅)−1. (1)
Table 1 gives both the directly measured as well as the derived data for the different samples. As ex-pected, the nodule diameter decreases with increasing cooling rate while the nodule density is increasing. No clear tendency could be found for the impact of the cooling rate on graphite fraction.
Table 1: Experimental characterization of graphite nodule size and spatial density
sample fraction fG mean nodule diameter [mm] nodule density [mm-2], [mm-3] d̅A d̅V (a) d̅V (b) NA NV (a) NV (b) M04 0.10 0.062 0.079 0.083 35 443 424 M08 0.11 0.043 0.055 0.058 69 1260 1171 M10 0.08 0.028 0.036 0.041 116 3254 2824 M13 0.10 0.023 0.029 0.030 225 7683 7553
4
3. Experimental microsegregation analysis
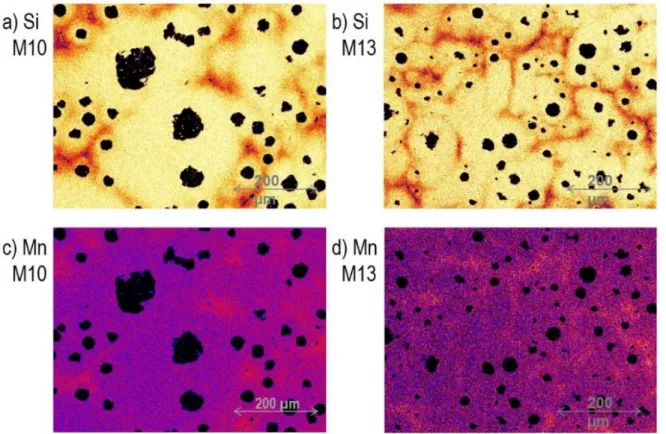
Two samples, M10 and M13, were selected for experimental microsegregation analysis. For analysing the distribution of substitutional solutes Si and Mn, energy dispersive X-ray analyses (EDX) were carried out with a XFLASH 6130 from Bruker fitted in a FEI Quanta scanning electron microscope (SEM). The procedure was two-fold: First, acquiring 2D maps for visualization of the microsegregation features (see figure 2); Second, recording spectra by spot counting on a regular grid for quantitative analysis. During these analyses, Fe, Si, and Mn were measured together with Al that was sometimes detected, but asso-ciated to the final polishing of the samples and thus disregarded. Amongst the raw data, a significant number of data points show a sum much lower than 100%. These points were related to graphite particles and removed from further analysis of the solute distribution in the matrix. The selected data were corrected for atomic number, fluorescence and absorption, and the sum of Fe, Si, and Mn was normalized to 100%. Grid analyses were performed with a grid spacing of 175 µm in both directions, large enough to ensure a representative statistics independent of the different spacing of dendrite arms, nodules and eutectic cells. The corrected concentrations values were then sorted in decreasing order for Si and in increasing order for Mn accounting for their opposite segregation behaviour. The resulting 1D-distribution profiles (figure 3) provide a statistical characterization of the element distribution in the entire multidimensional structure. This is in contrast to some previous studies e.g. [12,31], where only limited areas between selected adja-cent nodules were analysed and extreme values distributed at a scale much larger than the nodule spac-ing may not have been considered. It should however be noted that the evaluation of the extreme con-centrations generally exhibits a very high uncertainty due to the intrinsic scattering of X-ray emission [34] as well as due to the statistical randomness to directly hit the singular points of last solidification. To avoid bias by the finite size and number of the measuring points, we restricted the range of the cumulative distribution from 0 to 99%.
5
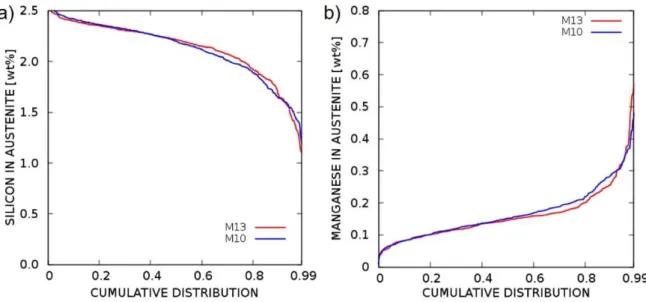
Figure 3: Experimental segregation curves for silicon and manganese in samples M10 and M13.
4. The volumetric multicomponent multi-phase-field model (Vol-MMPF)
Microstructure simulations were performed with the Micress software [1,2,3] based on a novel Vol-MMPF approach [8] which accounts for volume changes during phase transformation and cooling. Ther-modynamic data were derived from the database TCFe8 [35] and diffusivities from the mobility database mobFe3 [36] via the TQ-interface of the Thermo-Calc software [27]. In the following, the material-spe-cific modelling of nucleation, anisotropic growth, solute segregation and volumetric expansion are shortly described.
4.1 Modelling of austenite and graphite nucleation
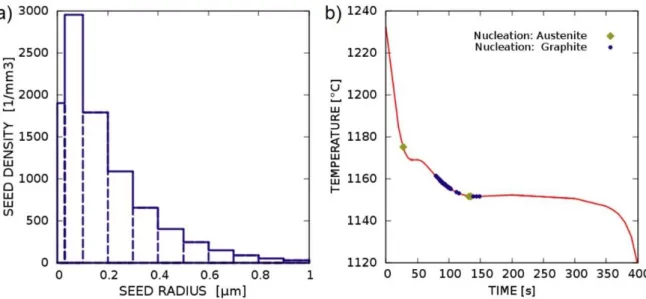
Nucleation is handled in Micress® by a submodel. Nuclei, whose radii can be much smaller than the grid spacing x, are generated when the local undercooling - evaluated from the thermodynamic database - exceeds the specified critical undercooling. In order not to violate the concentration balance, the initial nucleus composition still equals that of the surrounding melt, but local equilibrium is soon obtained by solute redistribution. As long as a nucleus is too small to be numerically resolved, its curvature is analyt-ically evaluated from the volume fraction under assumption of spherical geometry [2]. Austenite was modelled to nucleate with low nucleation undercooling (Tcrit = 1°C) in one of the domain corners and with higher undercooling (Tcrit = 10°C) on the liquid/graphite interface. Nucleation of graphite was mod-elled on seeds randomly distributed in the melt according to a size-density function with almost expo-nential course (figure 4). The seeds were distributed to eleven classes with radii ranging from 0 to 1 µm and the corresponding critical undercooling for nucleation Tcrit was evaluated according to Turnbull’s free growth criterion [37] by:
∆Tcrit= 2σLG0
ΔsLG rseed. (2)
where σLG0 denotes the mean interfacial energy and Δs
LGthe local entropy of fusion evaluated from the database. Since the critical undercooling is inverselyproportional to the seed radius rseed, nucleation starts at the largest seeds. Under slow cooling conditions only a low undercooling is reached and smaller seeds do not become active, hence less graphite nodules are nucleated than for higher cooling
6
Figure 4: a) Calibrated seed distribution for graphite nucleation, b) nucleation events in sample M13. rates. The total seed density was adjusted to approximately reproduce the experimental nodule densi-ties given in Table 1. Note that the intention was not at all to obtain a perfect fitting, but rather to study whether, and if so, how changing nodule densities affect microsegregation.
4.2 Modelling of austenite and graphite growth
A set of multiple phase-fields (𝐱, t) maps the spatial distribution of the phases liquid (L), austenite (A) and graphite (G) in the simulation domain. Additionally, grains of same phase, but different orienta-tion, may be distinguished. Theevolution of the structure is described by a set of multiphase-field equa-tions:
ϕ̇α(𝐱,t) =ΣβMαβϕ ( |∇ϕαβ| νmol,αβ−1 Δµαβ - σαβ Kαβ + ΣγJαβγ ), (3) where the phase field variable ϕα is associated with the local mole fraction of phase α, interacting with multiple phases β. µ denotes the difference in chemical potential and νmol,αβ the mean molar volume for interacting grains αandβ. Their ratio represents the thermodynamic driving force for transition and is evaluated via the TQ-interface of the Thermo-Calc software as function of local composition and tem-perature. The pairwise interface contributions σαβ∙Kαβ correspond to the capillarity force. Third-order in-terface contributions J account for forces only acting in junctions where more than two grains are locally coexisting, for details see [1,2]. σαβ denotes the interfacial energy and Mαβ the interfacial mobility, specifically defined for each pairwise phase interaction as function of the interfacial normal vector n. The anisotropy description of the liquid-austenite interface accounts for the cubic symmetry of the fcc-lattice:
MLA= MLA0 acubic(𝐧), (4) σLA = σLA 0 acubic(𝐧), (5) acubic(𝐧) = 1 - δLA 4(nx4+ny4+nz4-0.75),
7
where the mean interface mobility MLA0 was defined in the diffusion controlled limit [39] and the mean liquid/austenite interface energy was set to σLA0 = 0.17 Jm-2 with an anisotropy of δLA = 0.05.
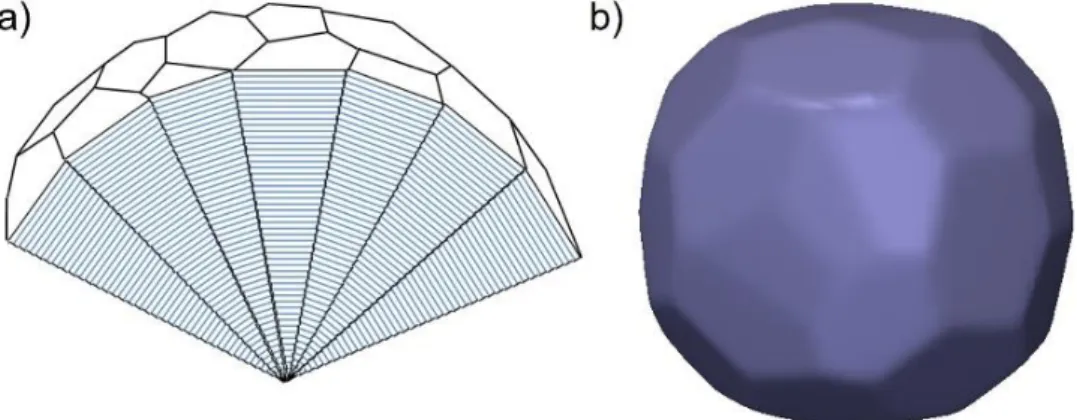
Graphite nodules are supposed to be multi-crystalline, built of multiple conical sectors as sketched in figure 5a. The effective interface of a spheroid is hence formed of basal c-facets modelled in the Micress software by:
MLG= MLG0 afacet(θ), (7) 𝜎LG∗ = 𝜎LG0 afacet−1 (θ), (8) afacet(θ) = δLG+(1-δLG) |tan θ| tanh ( |tan θ|-1), (9) with phase-specific values MLG0 = 5∙10-15 m4J-1s-1, δLG = 0.5 and σLG0 = 1.5 Jm-2 [38]. θ denotes the an-gle between the local interfacial normal vector and the nearest facet vector and 𝜎LG∗ is the regularized interfacial stiffness. Figure 5b shows the effective Wulff shape of a graphite spheroid modelled with 50 facets. The graphite/austenite interface was modelled based on the same anisotropy function with spe-cific values MGA0 = 8∙10-16 m4J-1s-1 and σ
GA
0 = 1.2 Jm-2. Note that the interface anisotropy is of marginal importance for the studied microsegregation and only described for the sake of completeness. All inter-facial mobility values were corrected in the thin-interface limit by:
Mαβϕ = Mαβ
1+η⋅G⋅Mαβ, (10)
where the factor G is locally evaluated from the database to consider the growth restricting effect of the diffusion-controlling elements in the multiphase interface region [39]. The numerical interfacial thickness was set to η = 3.5 x with x being the numerical grid size. High accuracy was ensured by a special finite-difference formulation with implicit correction of systematic discretization errors [40].
Figure 5: Schematic cut through a graphite nodule (a) and Wulff-shape of the effective anisotropy function.
4.3 Modelling of solute segregation and diffusion
The composition vector field χ⃑ (𝐱,t) maps the distribution of the alloying elements during simulation. The components of this vector give the content of the solute elements C, Si, Mn, and Mg in terms of mole fractions, with nmoli denoting the number density of moles of this component and n
mol the total number density of moles (eq. 11). Within the diffuse interface region where the adjacent phases overlap, the vector χ⃑ is defined as a mixture composition consisting in the weighted sum of individual phase-specific composition vectors χ⃑ α, evaluated from the phase-related mole number densities nmol,αi and n
8 χ⃑ (𝐱,t) = Σα α(𝐱,t) χ⃑ α(𝐱,t) , with χi= nmoli nmol and χα i =nmol,αi nmol,α. (11) Redistribution of the mixture composition χ⃑ into individual phase-specific composition χ⃑ α is done ac-cording to the quasi-equilibrium approach which postulates equal diffusion potentials μ̃αi= μ̃
β
i for each component in locally coexisting phases. This constraint corresponds to a parallel tangent construction and is evaluated by coupling to the database TCFe8 with intermediate extrapolation [1,2]. Solute diffu-sion of the elements C, Si, Mn, Mg (including cross dependencies) is simulated in both liquid and aus-tenite:
χ⃑ ̇(𝐱,t) = nmol−1 (𝐱,t) ( Σα𝛁⋅[nmol(x⃑ ,t) 𝐣⃗α(𝐱,t)] + 𝛁⋅[nmol(x⃑ ,t) 𝐣⃗atc(𝐱,t)] ), (12) with diffusion fluxes 𝐣⃗α(𝐱,t) = D̿α𝛁 χ⃑ α(𝐱,t). (13) Equation (12) represents a generalized formulation of the diffusion equation, allowing for locally chang-ing mole number densities nmol(x⃑ ,t). The phase-specific diffusion matrices D̿α are evaluated as prod-uct of thermodynamic factor and chemical mobility from the databases TCFe8 [35] and mobFe3 [36]. In between the frequent database calls, the diffusion coefficients are interpolated based on Arrhenius-type functions. By default, antitrapping currents j⃗atc [39] were evaluated by the Micress® software, but found to be negligible except for the first seconds of dendritic growth. It is important to note that equation (12) ensures conservation of the total number of moles of each species over the simulation domain, while the constraint of conserved mole fractions used in the standard multi-phase-field model [1,2] is not valid in the general case of unequal mole number density. The local number density of moles nmol(𝐱,t) re-mains unaffected by substitutional diffusion, but changes during interstitial diffusion of C at the rate of:
ṅmol(𝐱,t) = 𝛁⋅ [ nmol(𝐱,t) 𝐣AC(𝐱,t) ] , (14) where jAC is the diffusion flux of C in austenite as defined in eq.(13). The explicit computation of the composition vector accounts for both the change in mole fraction (eq.12) and the change in total mole number density (eq. 14):
χ⃑ (𝐱,t+Δt) = [χ⃑ (𝐱,t) + χ⃑ ̇(𝐱,t) Δt] nmol(𝐱,t)
nmol(𝐱,t)+ṅmol(𝐱,t) Δt .
(15)
4.4 Modelling of volume change
The eutectic transformation in nodular cast-iron is controlled by carbon transport through the austenite shell. As long as the carbon atoms are interstitially dissolved in austenite they hardly contribute to the material’s volume, but drastically increase their partial volume when becoming attached to the graphite interface. Effectively, the graphite nodules grow by volume expansion, pushing the surrounding austen-ite shell to the outside. If we were to neglect the displacement of the fcc-lattice and the related solute transport in the simulation, we would find all slow diffusing elements piling up in front of the graphite in-terface. This would falsify the segregation profiles and lead to transition kinetics orders of magnitude lower than in reality as demonstrated on the example of a ternary Fe-C-Si alloy [8]. Note that expansion-induced matter transport is not limited to solidification, but also occurs by creep processes in solid-state. A comprehensive modelling of solid and fluid mechanics during microstructure evolution of a multicom-ponent alloy would clearly exceed the possibilities of today’s computation, especially as the mechanical processes occur on a time-scale much faster than diffusion. Because of the elevated temperatures dur-ing processdur-ing, it is reasonable to assume that any temporary stress is immediately relaxed. The new
9
Vol-MMPF approach allows a realistic prediction of phase volumes, transformation kinetics and multi-component microsegregation based on the assumption that local strain gradients in liquid or solid phases are immediately homogenized by internal matter fluxes.
The model accounts for the fact that the local molar volume may change as a consequence of phase transition, solute diffusion or cooling. The phase-specific molar volumes ν⃑ α are evaluated from the data-base as function of composition and temperature. Within the diffuse interfacial regions, we define the local molar volume νmol as the weighted sum of the individual phase-specific molar volumes να:
νmol(𝐱,t) = Σα [α(𝐱,t) να(χ⃑ α,T)]. (16) To homogenize the local volume changes and continuously recover a stress-free simulation domain, internal molar fluxes jmol are calculated based on a relaxation approach on a time scale much faster than diffusion and growth (Δτ≪ Δt).
jmol(𝐱, τ) = νmol−1 (𝐱) MV 𝛁 [nmol(𝐱,τ) νmol(𝐱)], (17) nmol(𝐱, τ+Δτ) = nmol(𝐱,τ) + 𝛁 ∙ jmol(𝐱,τ), (18) Note that the term (nmol νmol) is a measure for local strain. The matter fluxes jmol become zero, when no more gradients in local strain exist. As the relaxation is assumed to be instantaneous, the relaxation coefficient MV can be defined as a numerical parameter adjusted for computational efficiency and the local molar volume νmol is modelled as temporary constant. The relaxation equation is solved iteratively at the end of each phase-field time step Δt until a homogeneously distributed volume is recovered, i.e. until the mean gradient ∇(nmolνmol) has fallen below a numerically negligible limit, here specified as 10-5 % of the mean value of nmolνmol. Simultaneously to eq. (18), the local composition vector field is recalculated in each iteration step Δτ to account for the expansion-related solute fluxes:
χ⃑ (𝐱, τ+Δτ) = nmol−1 (𝐱, τ+Δτ) ( χ⃑ (𝐱, τ) nmol(𝐱, τ) + ∇ [χ⃑ (𝐱,τ) 𝐣mol(𝐱,τ) ] ) (19)
5. Phase-field simulations
Phase-field simulations were performed for the various process conditions referring to the casting sam-ples M4, M8, M10 and M13 described in section 2. The nominal composition indicated in section 2 was used (wC = 3.66, wSi = 1.97, wMn = 0.18 and wMg = 0.048 in weight-%). Simulations start at the moment when all cavities were filled with melt. The temperature evolution was imposed to follow the measured cooling curves T4, T8, T10, and T13 depicted in figure 1 from T 1230°C down to T752°C, i.e. to the onset of the eutectoid transformation. The initial volume of the cubic calculation domain was (200 µm)3 and the numerical grid spacing x = 2µm. To check the influence of the numerical discretization, sam-ple M13 which exhibited the finest structure - and hence was most critical – was additionally run with a smaller grid spacing of x=1µm. This comparative simulation confirmed that the changed resolution had no visible effect on the resulting segregation profiles.
All simulations started from pure liquid phase. As the alloy was slightly hypoeutectic, primary austenite nucleated prior to graphite at about 1175°C and then grew dendritically. Below 1161.5°C graphite nod-ules started to nucleate and grow from the melt with spherical morphology. After becoming encapsu-lated either by primary austenite or by newly nucleated eutectic austenite, the nodules continued to grow driven by carbon diffusion through the austenite shell. Some new graphite nodules nucleated dur-ing further cooldur-ing. Table 2 gives a characterization of the simulated graphite distribution, namely the graphite fraction, the mean diameter of the nodules at the end of the simulation, the nodule number
10
within the calculation volume and the corresponding nodule density. The highest number of nodules was obtained in sample M13. Figure 4b shows the time and temperature of nucleation events for this sample and figure 6 illustrates the microstructure evolution during the various stages of nucleation and growth. Solidification was here completed at about TS 1117°C, while in the slowest solidifying sample M4, so-lidification ended at TS 1140°C. The final stage of the simulation was governed by solid-state transfor-mation with graphite directly growing from austenite. All simulations were stopped at 752°C, i.e. the eu-tectoid transformation was not modelled.
Table 2: Characterization of simulated volume fraction, size, number and number density.
sample volume fraction mean diameter DV nodule number density NV [ mm-3]
M04 0.100 0.088 2 250
M08 0.100 0.046 12 1500
M10 0.099 0.039 20 2500
M13 0.097 0.028 60 7500
Volume change was considered during all simulations. As expected, primary growth of austenite re-sulted in local contraction, while growth of graphite caused local expansion and hence reduced the over-all shrinkage. The total volume of the hypoeutectic over-alloy continuously decreased dominated by thermal shrinkage. The effective volume change resulting from the balance of expansion, contraction, and ther-mal shrinkage was about -5% from pouring until start of eutectoid transformation. Note that in the pre-sent simulations, the total number of moles has been kept constant and neither liquid feeding nor pore formation was considered.
A general problem of studying the impact of cooling time and nodule density on microsegregation based on experimental data is that both parameters do not vary independently in practice. Slower cooling im-plicitly results in reduced nucleation undercooling and hence in a reduced nodule density. On the other hand, a change in nucleation density will alter the latent heat release and thus the eutectic undercooling. In contrast to experiments, Vol-MMPF-simulations enable an independent variation of both parameters by explicit adjustment of the seed density function. To study the separate effect of cooling and nodule density, two variations of the experimental process conditions were simulated: Variation1 (V1) combines the nodule count from sample M13 with the cooling from sample M10 and Variation2 (V2) combines the cooling from sample M13 with the nodule count from sample M10.
6. Numerical microsegregation analysis
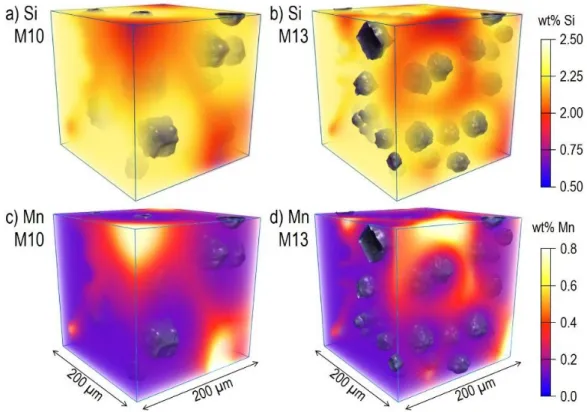
As direct simulation results, 3D distribution maps of the solute elements were given out at specified time steps. Figure 7 shows the 3D distribution of the substitutional elements Si and Mn evaluated for sam-ples M10 and M13 at the end of simulation. Note that all compositions were converted to weight fraction. To enable a quantitative comparison with both experimental results and Scheil prediction, the 3D maps were further processed into characteristic 1D profiles. Concentrations belonging to the austenite region were filtered by the constraint that the local phase-field value of austenite exceeds the critical value of α= 0.5. In accordance with the processing of the experimental data described in section 3, the concen-tration of the solute elements were sorted independently from each other - accounting for their segrega-tion behaviour- and plotted versus the normalized cumulative distribusegrega-tion of value numbers. Figure 8 shows the segregation profiles of Si and Mn, and figure 9 the profiles of Mg and carbon for samples M4, M8, M10 and M13. All curves refer to a temperature of 752°C. Carbon distributions are additionally shown for T = 1117°C. Furthermore, selected 2D sections of the Si distribution at different times during solidification are given in figure 10, and figure 11 shows a 2D section of the final carbon concentration field for simulations M13, V1, V2 and M10 in comparison. All numerical results are discussed in the fol-lowing section together with the experimental data.
11
Figure 6: Phase-field simulation of the microstructure evolution in sample M13 during cooling from T =1230°C to T = 752°C.
12
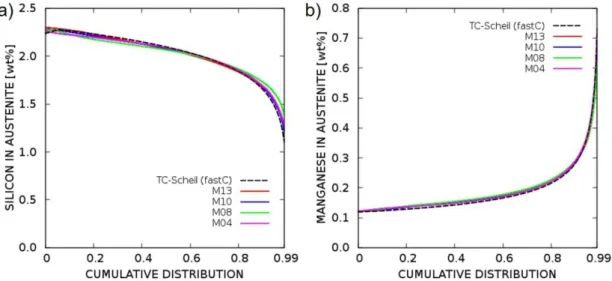
Figure 8: Simulated segregation curves of silicon and manganese for samples M4, M8, M10 and M13
at T = 752°C in comparison with TC-Scheil calculations.
Figure 9: Simulated segregation curves of magnesium and carbon for samples M4, M8, M10 and M13 at T = 752°C (and additionally at T = 1117°C for carbon).
Figure 10: 2-D section cut from PF-simulation. The silicon content in austenite increases during pro-eutectic solidification, but decreases during pro-eutectic growth.
13
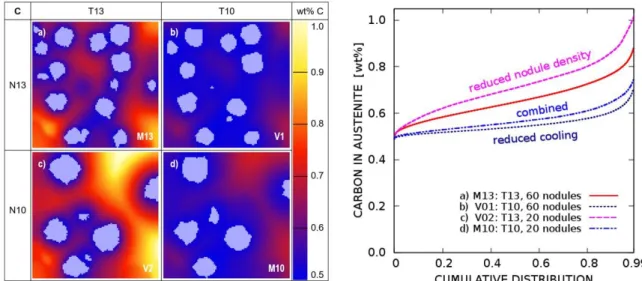
Figure 11: Carbon distribution from independent variation of process parameters a) sample M13, b) variant V1 with reduced cooling, c) variant V2 with decreased nodule count, d) sample M10 with reduced cooling and decreased nodule count combined.
7. Combined discussion of experimental and numerical results
4.5 Microsegregation of substitutional elements
For a first qualitative validation, the numerically predicted 3D distribution maps of Si and Mn depicted in figure 7 were compared to the experimentally evaluated 2D maps in figure 2. Both show similar segrega-tion patterns with lowest Si contents and highest Mn contents in the regions of last solidificasegrega-tion. An im-portant result of the multidimensional analysis is that the extreme values corresponding to the end of solidification are unevenly spread along the intercellular boundaries at a scale which can be much larger than the nodule spacing. The observed impoverishment of the graphitizing element in the residual melt combined with the simultaneous enrichment of the cementite stabilizer principally promotes cementite and carbide formation in the last stages of solidification, which was however found to be uncritical under the given conditions. Only very small amounts of cementite were detected in some samples with fraction below 0.5%. An interesting detail observed in the 3D simulations is that the Si content of austenite still increases during primary pro-eutectic growth, despite the fact the partition coefficient of Si is greater than one (figure 10). This atypical segregation behaviour was reported before [28] and can be explained by the strong composition and temperature dependency of the partition coefficient. After nucleation of graph-ite, the Si content of austenite starts to decrease. Consequently, highest values in the multidimensional Si distribution map mark the moment of first eutectic precipitation as illustrated by the 2D sections in figure 10. The 3D distribution maps of Mg (not depicted here) were found to be qualitatively comparable to those of Mn, showing lowest values in the dendrite’s centre and highest values in the last solidified regions. Mg segregation and associated precipitation of Mg-compounds are known to have a significant impact on the graphite morphology. Whether this affect is dominated by modification of kinetics, interfacial energies or nucleation and to which extent the interplay with oxygen and sulphur plays a role is still unclear and shall be the subject of a future study.
A quantitative validation of the numerical simulation results was enabled by processing the multi-dimen-sional data into characteristic 1D profiles. In contrast to simple line-scans, these profiles are not subjec-tively biased and ensure a statistical representation of the whole microsegregation spectrum distributed over different length scales. Experimentally and numerically evaluated profiles (figure 3 vs figure 8) of both Si and Mn show good agreement except for deviation within the first 20% of the distribution which are most probably related to the physical noise generally associated with EDX measurements [34]. The
14
experimental validation confirms that the new Vol-MMPF approach produces realistic results without the need for parameter fitting. The only parameter which was calibrated is the nodule density which however obviously has no significant effect on the characteristic 1D profiles of the substitutional elements. Indeed, the most striking result of the microsegregation analysis is that the characteristic profiles of none of the substitutional elements (figures 3, 8, 9a) exhibit any significant difference for the samples M4, M8, M10 and M13 processed under significantly differing cooling conditions These results go against the still widely accepted theory that microsegregation in cast iron strongly depends on cooling rate [12,13,30,31], but finds support in the difficulty of ascertaining this statement in practical studies [14,26,28,29]. The present study goes beyond the previous studies, demonstrating that variation of the process times ranging from 20 min to 25 h and related change in nodule density from approx. 0.41012 to 7.61012 m-3 show no significant impact on the characteristic 1D segregation curves. Independent variation of cooling condition and nodule density in simulations V1 and V2 revealed a slightly enhanced, however still negligible impact. It is however important to note that this statement only holds for the characteristic 1D concentration pro-files, which do not account for spatial aspects. While the statistical distribution remain unaffected, the multidimensional distribution patterns considerably alter with changing process consideration. The 3D distribution maps (figure 7) generally reveal increased spatial concentration gradients for higher nodule densities, because the concentration variation occurs over reduced segregation lengths. In contrast to classic 1D models, the new Vol-MMPF model can provide these more comprehensive local information. 4.6 Microsegregation of carbon
In addition to the microsegregation of the substitutional elements, also the redistribution of carbon was predicted by the Vol-MMPF model. As carbon is interstitially dissolved in austenite, its diffusion coeffi-cient is still relative high at 1175°C (3.7∙10-10 m2s-1), but decreases during cooling to 752°C by two or-ders of magnitude. During the eutectic transformation, carbon continuously diffuses from the liquid/aus-tenite interface to the graphite/ausliquid/aus-tenite interface. Nevertheless, the residual melt becomes more and more enriched in carbon and the highest carbon concentrations in austenite are obtained at the point of last solidification. Figure 9 shows that the carbon concentration profiles of all four samples are still close to each other at the end of solidification. During subsequent cooling to eutectoid temperature all curves are significantly shifted downward because of the continuous decrease of carbon concentration at the graphite-austenite interface and resulting diffusion fluxes towards the graphite nodules. At the final tem-perature of 752°C, the maximum carbon values reveal a clear impact of the process conditions, while the minimum value is identical for all samples. The highest carbon concentration is obtained in the fast-est solidifying sample M13, clearly followed by M10. However, the profiles of M08 and M04 hardly differ, which can be explained by the fact that the impact of increased cooling time and decreased nodule den-sity compensate each other, i.e. increasing diffusion time is compensated by longer diffusion distances. The 2D sections depicted in figure 11 give further insight into the fundamental segregation mechanisms. Figure 11a correspond to simulation M13. Minimal carbon concentrations are located at the graph-ite/austenite interface and maximal concentrations in places with largest distance to a graphite nodule. Figure11b shows the same section for simulation V1 where reduced cooling was assumed. The in-creased diffusion time here results in a homogenization of the profile and thus a decrease of the maxi-mal values. The minimaxi-mal values - determined by the local equilibrium condition at the interface - do not change. A reduced nodule density, in contrast, results in longer diffusion distances and thus in higher maximum concentrations as shown in figure11c. Combination of both variations in sample M10 (fig-ure11d) results in partial compensation. In this specific case, the effect of the cooling change was found to slightly dominate, which however cannot be generalized and may depend on the specific casting con-ditions.
15
8. Comparison to Scheil predictions
Scheil computations were performed with the Thermo-Calc Scheil module [21] based on the same ther-modynamic database as used for the Vol-MMPF simulations. The TC-model accounts for multicompo-nent interdependencies with carbon defined as fast-diffuser, i.e. with infinite diffusivity. Figures 8-10 show that the TC Scheil predictions are - for all solute elements but carbon - almost identical to the sim-ulated distribution curves and hence also in good agreement with the experimental data. This result is by far not trivial taking into account the different ways these curves were obtained. The statistic 1D curves were generated from post-mortem data, i.e. by sorting the concentration data of the final 3D structure in progressive order. Scheil concentrations, in contrast, are local equilibrium values continu-ously evaluated during solidification and originally function of fraction solid, but here correlated to the cumulative distribution, i.e. a dimensionless rank number which indicates the relative positioning of a specific concentration within the spectrum of all occurring concentrations. A correlation between cumu-lative distribution and solid fraction is only reasonable provided that all concentrations are unambigu-ously ascending or descending with time. This holds for Mn and Mg, but not strictly for Si, which exhibits an atypical temporarily increase during pro-eutectic growth as discussed in section 7.1. A changing curve progression generally requires a different sorting of the simulation data e.g. with respect to a lead-ing element or a weighted rank number [7]. As consequence of the simplified sortlead-ing, we observe a small, however almost negligible, deviation from Scheil in the very first part of the simulated distribution curve in figure 8.
Furthermore, cumulative distributions can only be related to fraction solid values provided that local con-centrations at the solid/liquid interface are simply frozen in during solidification and not further affected by back-diffusion. This seems to be a reasonable assumption for all substitutional elements, as the sub-stitutional diffusion coefficients in austenite evaluated from the mobility database were found to be more than four orders lower compared to the diffusion coefficient of interstitial carbon, which controls the eu-tectic transition. Nevertheless, back-diffusion plays an important role during the very last stage of solidi-fication. Here, the exponentially evolving concentration gradients cause non-negligible concentration fluxes which eventually determine the end of solidification. Due to the inherent neglect of back-diffusion, Scheil predictions can theoretically never reach 100% solid and the concentrations asymptotically ap-proach infinity or zero. In the present study, Scheil computations were stopped at 99% fraction solid. In contrast to Scheil computations, Vol-MMPF simulations comprehensively address the solid-state pro-cess. A critical question was whether the concentration profiles built up in austenite during solidification would become partially homogenized by diffusion during the subsequent cooling to 752°C. This was ex-pected to be most likely for sample M4, exposed to the longest cooling time (25 h), but found not to be the case for any of the substitutional elements. Only carbon is strongly affected by finite solid-phase dif-fusion and can therefore not be predicted by the Scheil model. It is noteworthy that despite the assump-tion of infinite diffusivity in the Scheil model, the carbon content does not homogenize in austenite due the multicomponent interdependency of its diffusion potential with the slow diffusing elements.
Good matching between statistical post-mortem data and Scheil predictions furthermore requires that the microsegregation is not affected by the continuing growth of the graphite nodules after solidification. Since graphite forms completely from carbon, all other elements have to be transported out of the evolv-ing interfacial regions. This transport is however induced by volume expansion and hence, the substitu-tional elements move together with the displaced Fe-lattice, thus only changing their local position, but not their characteristic profiles. In fact, the statistical 1D profiles of Si, Mn and Mg evaluated at the end of simulation (752°C) showed no visible deviation from those evaluated at the end of solidification (1117°C). Moreover, these profiles were found in good agreement with the experimental profiles evalu-ated at room temperature, i.e. after the eutectoid transformation has taken place. This finding supports the hypothesis that the eutectoid structure inherits the substitutional solute content of the as-solidified
16
austenitic structure [19]. It is emphasized that this only holds for substitutional elements, but not for car-bon, whose concentrations profile strongly changes during solid state transition and completely deviates from Scheil prediction (figure 9).
Most revealing is to recall that the TC-Scheil computations are merely based on thermodynamic data and - in contrast to the Vol-MMPF simulations - do not consider any process conditions. Nevertheless, statistical concentration profiles evaluated from simulations with strongly varying cooling and nucleation conditions reveal no significant deviation from Scheil predictions. This supports the finding that the con-centration statistics of substitutional elements are independent of any process specific conditions. Non-negligible deviation from Scheil prediction may only be expected when extremely long process times are combined with very high nodule densities.
Altogether, it can be summarized that the statistical concentration distribution of substitutional elements in ductile cast iron can reliably be predicted by the TC-Scheil model provided that matter is conserved. The benefits of this prediction are however limited by the fact that neither corresponding carbon concen-trations nor information about the spatial distribution of the solute elements is provided. In comparison, the new Vol-MMPF model is computationally more expensive, but provides comprehensive 3D distribu-tion maps for all solutes as funcdistribu-tion of time, essential to study local effects e.g. on graphite degeneradistribu-tion or carbide formation.
9. Conclusions
Microsegregation in hypoeutectic ductile cast iron was studied for the first time in 3D space based on a novel volumetric multicomponent multi-phase-field (Vol-MMPF) approach. The Calphad-based simula-tions were successfully validated for a representative Fe-C-Si-Mg-Mn alloy by a simultaneous experi-mental study. The combined numerical and experiexperi-mental microsegregation analysis confirms the as-sumption that the statistical distribution of substitutional elements in the final microstructure is simply inherited from the as-solidified structure and not significantly affected by on-going graphite growth or dif-fusion in solid-state. Against the common view that microsegregation is strongly affected by process conditions, only the characteristic profiles of interstitial carbon revealed a sensitivity to varying cooling and nucleation conditions, while characteristic 1D profiles of substitutional elements hardly differed from each other or from TC-Scheil predictions. In contrast to the merely statistical 1D profiles, the complex 3D distribution patterns and local chemical gradients, however, considerably alter with varying nodule density. The new Vol-MMPF model can provide this more comprehensive information and contribute to a better understanding and control of the interplay between microsegregation and structure evolution in cast iron alloys.
Acknowledgement
The authors like to thank Alexandre Freulon for sample preparation, Yannick Thébault for performing EDX measurements, and the German Federal Ministry for Economic Affairs and Energy for partial funding of the work in the frame of the research project DiWaGussGJS.
References
[1] J. Eiken, B. Böttger, I. Steinbach, Multiphase-field approach for multicomponent alloys with extrapo-lation scheme for numerical application, Phys. Rev. E 73 (2006) 066122.
[2] J. Eiken, A Phase-Field Model for Technical Alloy Solidification, Shaker Verlag (2010) ISBN 978-3-8322-9010-8.
17
[4] B. Böttger, M. Apel, J. Eiken, P. Schaffnit, I. Steinbach, Phase-Field Simulation of Solidification and Solid-State Transformations in Multicomponent Steels, Steel Res. Int., 79:8 (2008) 608-616 [5] Y. Shen, S. Yang, J. Liu, H. Liu, R. Zhang, H. Xu, Y. He., Study on Micro Segregation of High Alloy
Fe–Mn–C–Al Steel. Steel Res. Int. (2019) 1800546
[6] J. Eiken, M. Apel, S.M. Liang, R. Schmid-Fetzer, Impact of P and Sr on solidification sequence and morphology of hypoeutectic Al–Si alloys: Combined thermodynamic computation and phase-field simulation. Acta Materialia 98 (2015) 152-163.
[7] K. Grätz, J. Eiken, R. Schmid-Fetzer, Methods of segregation analysis applied to simulated multi-component multiphase microstructures, Int. J. Mater. Res. 105:2 (2014) 130-138.
[8] J. Eiken, B. Böttger, A Multi-phase-field Approach for Solidification with Non-negligible Volumetric Expansion - Application to Graphite Growth in Nodular Cast Iron, T. Indian I. Metals (2018) 71(11), 2725-2729.
[9] P.C.Liu, C.R. Loper, Segregation of Certain Elements in Cast Irons, AFS Trans. 92 (1984) 289–295. [10] A. Kagawa, T. Okamoto, Partition of alloying elements on eutectic solidification of cast iron, MRS
Proc. 34 (1984) 201.
[11] N.K. Datta, N.N. Engel, Electron Microprobe Study of the Distribution of Si, Cu, Ni, Mn, Mo, and Cr in Ductile iron, AFS Trans. 83 (1976) 431-436.
[12] A. Owhadi, J. Hedjazi, P. Davami, M. Fazli, J.M. Shabestari, Microsegregation of manganese and silicon in high manganese ductile iron. Mater Sci Tech-lond 13(10), (1997) 813-817.
[13] S. Pietrowski, G. Gumienny, Microsegregation in Nodular Cast Iron with Carbides, Archives of Foundry Engineering 12:4 (2012) 127-134
[14] Charbonnier J, Margerie JC. Contribution to the study of microsegregation in Fe-C casting alloys, Mem. Sci. Rev. Met. 64 (1967) 345-357.
[15] B. Pustal, B., A. Bührig-Polaczek, Physico-chemical causes of the formation of chunky graphite in austenitic ductile iron. Acta Mater 124 (2017) 137-142.
[16] M.J. Lalich, C.R. Loper, Effects of pearlite promoting elements on the kinetics of the eutectoid transformation in ductile cast irons, AFS Trans. 81 (1973) 217-228.
[17] E.N. Pan, M.S. Lou, C.R. Loper, Effects of Cu, Sn, and Mn on the eutectoid transformation of gra-phitic cast irons, AFS Trans. 95 (1987) 819–840.
[18] J. Lacaze, The austenite to Pearlite/ferrite transformation, ASM Handbook 1A (2017) 106-113. [19] A. Freulon A, P. de Parseval P, C. Josse, J. Bourdie, J. Lacaze, Study of the Eutectoid
Transfor-mation in Nodular Cast Irons in Relation to Solidification Microsegregation, Metall. Mater. Trans. A 74 (2016) 5362-5371.
[20] A. Sommerfeld, B. Böttger, B. Tonn, Graphite nucleation in cast iron melts based on solidification experiments and microstructure simulation, J. Mater. Sci. Technol. 24 3 (2008) 321-324
[21] M. Zhu, L. Zhang, L., H. Zhao, D.M. Stefanescu, Modeling of microstructural evolution during di-vorced eutectic solidification of spheroidal graphite irons, Acta Mater (2015) 84, 413-425. [22] A.A. Burbelko, D. Gurgul, M. Królikowsk, M. Wróbel, Cellular automaton modeling of ductile iron
density changes at the solidification time, Arch. Foundry Eng. 13(4), (2013) 9-14.
[23] E. Scheil, Bemerkungen zur Schichtkristallbildung, Zeitschrift für Metallkunde 34 (1942) 70-72. [24] R. Boeri, F. Weinberg, Microsegregation in Ductile Iron, AFS Trans. 97 (1989) 179-184.
[25] R. Boeri, F. Weinberg, Microsegregation of Alloying Elements in Cast Iron, Cast Metals 6:3 (1993) 153-158.
[26] B. Domeij, A. Diószegi, Inferring the development of microsegregation and microstructure in Sphe-roidal and Compacted Graphite Iron using EPMA-WDS, Proc. of the 6th Int. Conf. on Solidification Processing SP17 (2017) 455-458.
[27] Thermo-Calc software. www.thermocalc.com.
[28] J. Lacaze, Solidification of spheroidal graphite cast irons, Part III: microsegregation related effects, Acta mater. 47:14 (1999) 3779-3792.
[29] C. Selig, J. Lacaze, Study of microsegregation buildup during solidification of spheroidal graphite cast iron, Metall. Mater. Trans. 31B (2000) 827-836.
18
[30] L. Nastac, D. M. Stefanescu, Modeling of Microsegregation in SG Cast Iron. AFS Trans 101, (1993) 933-938.
[31] A. Tadesse, H. Fredriksson, H, On the solidification and structure formation during casting of large inserts in ferritic nodular cast iron, Metall. Mater. Trans. B 49(3), (2018) 1223-1235.
[32] A. Escobar, D. Celentano, M. Cruchaga, J. Lacaze, B. Schulz, P. Dardati, A. Parada, Experimental and numerical analysis of effect of cooling rate on thermal-microstructural response of spheroidal graphite cast iron solidification, Int. J. Cast. Met. Res. 27:3 (2014) 176-186.
[33] S.A. Saltykow, Stereometrische Metallographie, VEB Dt. Verlag für Grundstoffindustrie, 1974. [34] J. Lacaze, P. Benigni, A. Howe, Some Issues Concerning Experiments and Models for Alloy
Mi-crosegregation, Adv. Eng. Mater. 5 (2003) 37-46. [35] TCFe8, TCS Steels/Fe-Alloys Database, version 8.0. [36] TCS Steels/Fe-Alloys Mobility Database, version 3.0.
[37] D. Turnbull, Theory of catalysis of nucleation by surface patches, Acta Metall. 1 (1953) 8-14.
[38] R.H. McSwain, C.E. Bates, W.D. Scott, Iron-graphite surface phenomena and their effects on iron solidification, AFS Trans. 82 (1974) 85-94.
[39] A. Carré, B. Böttger, M. Apel, Implementation of an antitrapping current for a multicomponent multiphase-field approach J. Cryst. Growth 380 (2013) 5-13.
[40] J. Eiken, Numerical solution of the phase-field equation with minimized discretization error, IOP Conf. Ser: Mater. Sci. Eng. 33 (2012) 012105.