HAL Id: hal-01662057
https://hal.archives-ouvertes.fr/hal-01662057
Submitted on 9 Jan 2018HAL is a multi-disciplinary open access
archive for the deposit and dissemination of sci-entific research documents, whether they are pub-lished or not. The documents may come from teaching and research institutions in France or
L’archive ouverte pluridisciplinaire HAL, est destinée au dépôt et à la diffusion de documents scientifiques de niveau recherche, publiés ou non, émanant des établissements d’enseignement et de recherche français ou étrangers, des laboratoires
A kinetic model of sugar metabolism in peach fruit
allows the exploration of genetic variability
Elsa Desnoues, Michel Génard, Bénédicte Quilot-Turion, Valentina Baldazzi
To cite this version:
Elsa Desnoues, Michel Génard, Bénédicte Quilot-Turion, Valentina Baldazzi. A kinetic model of sugar metabolism in peach fruit allows the exploration of genetic variability. Acta Horticulturae, International Society for Horticultural Science, 2017, pp.169-176. �10.17660/ActaHortic.2017.1182.20�. �hal-01662057�
A kinetic model of sugar metabolism in peach fruit allows the
exploration of genetic variability
Elsa Desnoues1,2 Michel Génard1,, Bénédicte Quilot-Turion2, Valentina Baldazzi1
1INRA, UR1115 Plantes et Systèmes de Culture Horticoles, F-84000 Avignon, France 2 INRA, UR1052 Génétique et Amélioration des Fruit et Légumes, F-84000 Avignon,
France
Keywords: mathematical model, P.persica, sugar concentrations, enzyme capacities,
compartimentation
Abstract
The organoleptic properties of peach, as fruit in general, largely depend on the accumulated sugars and acids. From sucrose, glucose and fructose, main sugars found in peach, fructose is the sweetest one. While commercial peach has equivalent fructose and glucose concentration, some wild or ornamental accessions display an imbalanced fructose-to-glucose ratio with a very low fructose concentration. In addition to genetic control, sugar metabolism is driven by fruit development and environment. The relative role of biochemical strengths and gene regulation in the elaboration of fruit sugar content at maturity is not well known. As the complex interplay between synthesis, degradation, transport and storage held in the cell is difficult to formulate, mathematical modelling appears to be an effective tool to challenge the issue. Thus, on the basis of profiling data, we developed a kinetic model of sugar metabolism in peach fruit. It simulates the evolution of sucrose, glucose, fructose and sorbitol concentrations during fruit development. A particular attention has been given to represent cellular compartmentation (cytosol and vacuole) in order to modulate the availability of the metabolites for the enzymatic reactions. The model was parameterized for different peach genotypes including a particular phenotype with low fructose-to-glucose ratio. It described well genetic variability. It was then used to further explore the system including the mechanisms driving genotypic differences.
Keywords: mathematical model, P.persica, sugar concentrations, enzyme capacities,
compartimentation
INTRODUCTION
Sugars are the principal component of fruit controlling organoleptic quality. Nevertheless, the accumulation of sugars during fruit development is a complex mechanism not well understood yet. The sugar content in fruit evolves along fruit growth and depends on the environment and the genotype. At maturity, peach fruit (Prunus
persica (L.) Batsch) are characterized by high amount of sucrose equal moderate amounts
of glucose and fructose, and low amount of sorbitol (Moriguchi et al., 1990a). Despite this general trend, peach accessions display a large natural variability in sugar
concentrations (Cantín et al., 2009). The main point of variation in wild or ornamental peaches is a very low fructose concentration compared to glucose concentration (Moriguchi et al., 1990a; Kanayama et al., 2005). The mechanism involving in this particular feature is not yet known. Three hypotheses can be made to explain this low fructose-to-glucose ratio: I) the fructose may be less synthetized, four enzymes synthetize fructose in peach fruit namely acid invertase (AI), neutral invertase (NI), sucrose synthase (SuSy) and sorbitol dehydrogenase (SDH). Among these enzymes, only SuSy and SDH may lead to a modification of the fructose-to-glucose ratio II) fructose may be more phosphorylated by the fructokinase (FK) or III) a default in the fructose storage capacity into the vacuole may result in a higher amount of fructose in the cytosol where it can be phosphorylated by the FK.
Recent studies characterizing a large number of metabolites and enzyme capacities (maximal activity) related to sugar metabolism during fruit development showed that there is no clear link between the concentration of a given sugar and enzymatic maximal activities (Biais et al., 2014; Desnoues et al., 2014).This suggests that the regulation of sugar metabolism is system-driven rather than reaction-driven. Therefore kinetic models are especially useful to investigate functional hypotheses or perform in silico experiments, due to the mechanistic description of metabolic functions.
The present study is aiming at exploring the fruit sugar metabolism during peach fruit development. More precisely, it intends at investigating hypotheses to explain the major change in fructose concentration between genotypes. For this purpose, we developed a kinetic model of sugar metabolism based on profiling data (Desnoues et al., 2016).
MATERIALS AND METHODS
Model construction
We built a dynamical model of sugar metabolism in peach fruit mesocarp (Desnoues et al., in prep). From the measured flesh dry weights during fruit development, we estimated the carbon inflow as done by Génard et al. (2003). A series of ordinary differential equations describes the distribution of this carbon through the metabolites. We used irreversible Michaelis Menten (MM) equations to represent enzymatic reactions.
Sub Cellular Compartmentation
We performed a cytological analysis as described in Biais et al. (2014) to estimate the compartmentation between the cytosol and the vacuole during fruit development. This compartmentation was then represented explicitly in the model so as to calculate the appropriate concentration of metabolites available for the enzymatic reactions in each compartment.
We used a linear function of the cytosolic sucrose concentration to represent the import flow of sucrose in the vacuole (Preisser and Komor, 1991). Concerning the
hexoses, we represented the active and passive transporters separately since both active and passive transports occur in the vacuolar membrane in fruit (Martinoia et al., 2012). Concerning sorbitol transport in the fruit, little information is available in the literature (Wei et al., 2014). Since sorbitol has been observed in the vacuole in peach fruit (Jiang et al., 2013), we assumed the existence of a vacuolar transporter and chose a passive transport mechanism. Following Beauvoit et al. (2014), we supposed that the density of transporters per unit surface area was constant for both active and passive transports. Consequently, flows linked to transport augmented proportionally to the tonoplast surface during fruit development.
Model Parameterization and Simulation
Parameter values corresponding to respiration rate were taken from Génard et al. (2010). A polynomial curve fitted to the Vmax measured in Desnoues et al. (2014) was used to parameterize enzyme kinetics. We used Km values from literature, primarily those concerning peach or plants (Moriguchi et al., 1990b; Moriguchi et al., 1991; Vorster and Botha, 1998; Oura et al., 2000). In absence of information in the literature, we numerically estimated the six parameters linked to vacuolar transport kinetics that we assumed constant.
Matlab software (MATLAB R2014a, The MathWorks Inc., Natick, MA) was used for model integration and calibration. For each genotype we performed twenty estimations to ensure good exploration of the parameter space. Among the estimations, we selected for each genotype those with no more than 10% deviation from the lowest sum of squared difference between simulations and observations. Then, based on flow minimization criteria (Holzhutter, 2004), we kept only one for the subsequent result analyses.
RESULTS and DISCUSSION
The dynamic model we developed combines enzyme activities with an explicit description of subcellular compartmentation and their evolution over time. It describes well the accumulation of four sugars (sucrose, glucose, fructose and sorbitol) in peach fruit during its development. It can simulate the genetic diversity observed between the eight genotypes studied (Fig. 1), including a particular phenotype with a low fructose concentration. The application of our model to a panel of genotypes with different fructose-to-glucose ratio opens the way to an in-depth investigation of the molecular mechanisms underlying this variation. Three possible mechanisms were hypothesized for the modification of the fructose content, namely, fructose synthesis, degradation and/or storage.
Fructose synthesis: SuSy
Previous studies have shown the presence of different isoforms of SuSy (Tanase and Yamaki, 2000) which is why the KM values related to this enzyme were estimated.
Moreover, the presence of two genes coding for SuSy have been reported in the QTL controlling the low fructose-to-glucose ratio (Desnoues et al., 2016), making Susy a good candidate to explain this feature. However, the estimated KM for both fructose types are
not significantly different (Fig. 2a) although we observe a trend of a higher KM for the
‘low fructose-to-glucose ratio’ genotypes, which is consistent with the hypothesis of a lower synthesis of fructose. To explore this functional hypothesis we simulated the concentrations of sugars by exchanging the value of the KM of SuSy parameter with the
average estimated value of the opposite fructose type (Fig 2b, c). Changing this parameter alone has no effect on the simulation of sugar concentration. Thereby SuSy does not seem to be responsible of the ‘low fructose-to-glucose ratio’ phenotype.
Fructose degradation: FK
In the same way as the SuSy, Kanayama et al. (1998; 2005) showed the presence of isoforms of FK with different KM. The estimated parameter representing the KM of FK
shows a significant difference between the two types of fructose (Fig 2d), with a lower
KM for the ‘low fructose-to-glucose ratio’ genotypes. This is in line with an increase of the degradation of fructose by FK and is therefore consistent with the hypothesis.
We then simulated the concentration of sugars by exchanging the value of the parameter KM of FK with the average estimated values of the opposite fructose type (Fig
2e, f). While the concentration of the other sugars is not changed, the fructose concentration changes drastically. Indeed, the genotypes initially ‘standard fructose-to-glucose ratio’ display a strong fall of their fructose concentration to a concentration close to that observed in the ‘low fructose-to-glucose ratio’ genotypes and inversely.
Thus the presence of these isoforms in different proportions in the two fructose types may result in differential degradation of fructose and may lead to the emergence of two phenotypes.
Fructose storage: passive tonoplastic transporter
A similar low-fructose phenotype in Arabidopsis leaves has been attributed to the action of the tonoplastic transporter AtSWEET17, a fructose exporter from vacuoles to the cytosol (Chardon et al., 2013). Similarly, in apple, Wei et al. (2014) found higher expression of the MdSWEET4.1 transporter (phylogenetically similar to AtSWEET17) in the leaves than in the fruit, and the fructose concentration was lower in the leaves. The AtSWEET17 transporter is a bidirectional passive transporter (Guo et al., 2014), and its activity corresponds to the TpassifFru parameter of the model.
However, the estimated parameter values TpassifFru were not significantly different between the two fructose types (Fig 2g). The model estimated a higher value for the ‘low fructose-to-glucose ratio’ genotypes which cause a higher flow of fructose from the vacuole to the cytosol allowing its phosphorylation into the cytosol. The use of the parameter estimated from the other fructose type causes a modification of fructose concentration (without changing the concentrations of other sugars) but lower than the parameter of KM of FK (Fig. 2h, i).
However, it has to be noted that TpassifFru is represented in the model as a passive transporter, whose action only depends on the fructose gradient across the tonoplastic membrane. Its effect should thus be strengthened if coupled to a “pump” mechanism, such as FK, which hydrolyzes fructose in the cytosol. The fructose vacuolar transport and the two isoforms of FK are therefore compatible mechanisms that might act together for the elaboration of the ‘low fructose-to-glucose ratio’ phenotype.
In conclusion, the model presented here proved to be a helpful tool for the investigation of sugar metabolism in peach and the identification of the mechanisms underlying phenotypic variability. Indeed, this study reveals that a difference in fructokinase affinity can be responsible for the ‘low-fructose-to glucose-ratio’ phenotype observed in the studied population. We do not exclude that other mechanisms, such as a modification of fructose storage in the vacuoles, may act with the fructokinase affinity to cause this particular phenotype.
ACKNOWLEDGEMENTS
This research was funded by grants from the Regional Council of PACA (Provence Alpes Côte d’Azur) and the Institut National de la Recherche Agronomique, France.
Literature Cited
Beauvoit BP, Colombie S, Monier A, Andrieu M-H, Biais B, Benard C, Cheniclet C, Dieuaide-Noubhani M, Nazaret C, Mazat J-P, Gibon Y. 2014. Model-assisted analysis of sugar metabolism throughout tomato fruit development reveals enzyme and carrier properties in relation to vacuole expansion. Plant Cell. 26:3224–3242. Biais B, Benard C, Beauvoit B, Colombie S, Prodhomme D, Menard G, Bernillon S, Gehl
B, Gautier H, Ballias P, Mazat P., Sweetlove L., Génard M., Gibon Y. 2014. Remarkable reproducibility of enzyme activity profiles in tomato fruits grown under contrasting environments provides a roadmap for studies of fruit metabolism. Plant Physiol. 164:1204–1221.
Cantín CM, Gogorcena Y, Moreno MÁ. 2009. Analysis of phenotypic variation of sugar profile in different peach and nectarine [Prunus persica (L.) Batsch] breeding progenies. J Sci Food Agric. 89:1909–1917.
Chardon F, Bedu M, Calenge F, Klemens P, Spinner L, Clement G, Chietera G, Léran S, Ferrand M, Lacombe B et al. 2013. Leaf fructose content is controlled by the vacuolar transporter SWEET17 in Arabidopsis. Current Biology 23(8): 697-702. Desnoues E, Gibon Y, Baldazzi V, Signoret V, Génard M, Quilot-Turion B. 2014.
Profiling sugar metabolism during fruit development in a peach progeny with different fructose-to-glucose ratios. BMC Plant Biol. 14:336.
Quilot-Turion B. 2016. Dynamic QTLs for sugars and enzyme activities provide an overview of genetic control of sugar metabolism during peach fruit development. J. Exp. Bot., doi:10.1093/jxb/erw169.
Desnoues E, Génard M, Quilot-Turion B and Baldazzi V. In prep. A kinetic model of sugar metabolism in peach fruit reveals a functional hypothesis for a particular low fructose-to-glucose ratio phenotype.
Etienne C, Moing A, Dirlewanger E, Raymond P, Monet R, Rothan C. 2002. Isolation and characterization of six peach cDNAs encoding key proteins in organic acid metabolism and solute accumulation: involvement in regulating peach fruit acidity. Physiol Plant. 114:259–270.
Génard M, Bertin N, Gautier H, Lescourret F, Quilot B. 2010. Virtual profiling: a new way to analyse phenotypes: Virtual profiling to analyse phenotypes. Plant J. 62:344–355.
Génard M, Bruchou C, Souty M. 1991. Variabilité de la croissance et de la qualité chez la pêche (Prunus persica L Batsch) et liaison entre croissance et qualité. Agronomie. 11:829–845.
Génard M, Lescourret F, Gomez L, Habib R. 2003. Changes in fruit sugar concentrations in response to assimilate supply, metabolism and dilution: a modeling approach applied to peach fruit (Prunus persica). Tree Physiol. 23:373–385.
Guo WJ, Nagy R, Chen HY, Pfrunder S, Yu YC, Santelia D, Frommer WB, Martinoia E. 2014. SWEET17, a facilitative transporter, mediates fructose transport across the tonoplast of Arabidopsis roots and leaves. Plant Physiol. 164(2): 777-789.
Holzhutter HG. 2004. The principle of flux minimization and its application to estimate stationary fluxes in metabolic networks. Eur. J. Biochem. 271: 2905–2922.
Jiang F, Wang Y, Sun H, Yang L, Zhang J, Ma L. 2013. Intracellular compartmentation and membrane permeability to sugars and acids at different growth stages of peach. Sci Hortic. 161:210–215.
Kanayama Y, Kogawa M, Yamaguchi M, Kanahama K. 2005. Fructose content and the activity of fructose-related enzymes in the fruit of eating-quality peach cultivars and native-type peach cultivars. J Jpn Soc Hortic Sci. 74:431–436.
Kanayama Y, Granot D, Dai N, Petreikov M, Schaffer A, Powell A, Bennett AB. 1998. Tomato fructokinases exhibit differential expression and substrate regulation.
Plant Physiol. 117(1): 85-90.
Martinoia E, Meyer S, De Angeli A, Nagy R. 2012. Vacuolar transporters in their physiological context. Annu Rev Plant Biol. 63:183–213.
Moriguchi T, Ishizawa Y, Sanada T. 1990 a. Differences in sugar composition in Prunus
persica fruit and the classification by the principal component analysis. J Jpn Soc
Hortic Sci. 59:307–312.
Moriguchi T, Sanada T, Yamaki S. 1990b. Seasonal fluctuations of some enzymes relating to sucrose and sorbitol metabolism in peach fruit. J Am Soc Hortic Sci. 115:278– 281.
fruits. Phytochemistry. 30:95–97.
Oura Y, Yamada K, Shiratake K, Yamaki S. 2000. Purification and characterization of a NAD+-dependent sorbitol dehydrogenase from Japanese pear fruit. Phytochemistry. 54:567–572.
Preisser J, Komor E. 1991. Sucrose uptake into vacuoles of sugarcane suspension cells. Planta. 186:109–114.
Tanase K, Yamaki S. 2000. Sucrose synthase isozymes related to sucrose accumulation during fruit development of japanese pear (Pyrus pyrifolia Nakai). J. Japan. Soc. Hort. Sci. 69:671-676.
Vorster DJ, Botha FC. 1998. Partial purification and characterisation of sugarcane neutral invertase. Phytochemistry. 49:651–655.
Wei X, Liu F, Chen C, Ma F, Li M. 2014. The Malus domestica sugar transporter gene family: identifications based on genome and expression profiling related to the accumulation of fruit sugars. Front Plant Sci. 5:569.
0 20 40 60 Sucrose 0 2 4 6 8 Sorbitol 60 80 100 120 140 0 2 4 6 8 10 Fructose 60 80 100 120 140 0 5 10 15 20 25 Glucose C on ce nt ra tio n mg gF W 1
0 20 40 60 E1 0 20 40 60 E22 0 20 40 60 E33 0 20 40 60 F106 0 20 40 60 E43 0 20 40 60 F146 60 80 100 120 140 0 20 40 60 F111 60 80 100 120 140 0 20 40 60 H191 C on ce nt ra tio n mg gF W 1
DABday after bloom
Fig. 1. Observed and simulated concentrations (mg gFW-1) of sucrose, glucose, fructose
and sorbitol during the fruit development (DAB, day after bloom) for four different genotypes with the ‘standard fructose-to-glucose ratio’ phenotype (left) and four different genotypes with the ‘low fructose-to-glucose ratio’ phenotype (right). Symbols and bars correspond to mean and standard deviation of experimental data from Desnoues et al. (2014). Lines correspond to the model simulation displaying the minimum cost function. Sucrose concentration is represented by diamonds and dark gray lines, glucose concentration is represented by points and gray dotted lines, fructose concentration is represented by cross and black lines and sorbitol concentration is represented by plus signs and light gray lines.
Synthesis
Standard
fructose-to-glucose ra o genotypes Low fructose-to-glucosera o genotypes
S t a n d a r d L o w 0 2 0 4 0 6 0 8 0 1 0 0 1 2 0 1 4 0 T p a s s i f F r u S t a n d a r d L o w 0 5 1 0 1 5 2 0 2 5 K f k
* *
S t a n d a r d L o w 5 0 1 0 0 1 5 0 2 0 0 K s u s y 6 0 8 0 1 0 0 1 2 0 1 4 0 0 5 1 0 1 5 F ru ct os e m g gF W 1 D A B d a y a ft e r b lo o m 6 0 8 0 1 0 0 1 2 0 1 4 0 0 5 1 0 1 5 F ru ct os e mg gF W 1 D A Bd a y a ft e r b lo o m 6 0 8 0 1 0 0 1 2 0 1 4 0 0 5 1 0 1 5 F ru ct os e mg gF W 1 D A Bd a y a f te r b lo o m 6 0 8 0 1 0 0 1 2 0 1 4 0 0 5 1 0 1 5 F ru ct os e mg g F W 1 D A B d a y a f te r b lo o m 6 0 8 0 1 0 0 1 2 0 1 4 0 0 5 1 0 1 5 F ru ct os e mg gF W 1 D A Bd a y a f te r b lo o m 6 0 8 0 1 0 0 1 2 0 1 4 0 0 5 1 0 1 5 F ru ct os e mg gF W 1 D A B d a y a f te r b lo o m a b c d e f g h i Degrada on TransportSynthesis
Degrada on
Transport
Standard
fructose-to-glucose ra o genotypes Low fructose-to-glucosera o genotypes
S t a n d a r d L o w 0 2 0 4 0 6 0 8 0 1 0 0 1 2 0 1 4 0 T p a s s if F r u S t a n d a r d L o w 0 5 1 0 1 5 2 0 2 5 K f k
* *
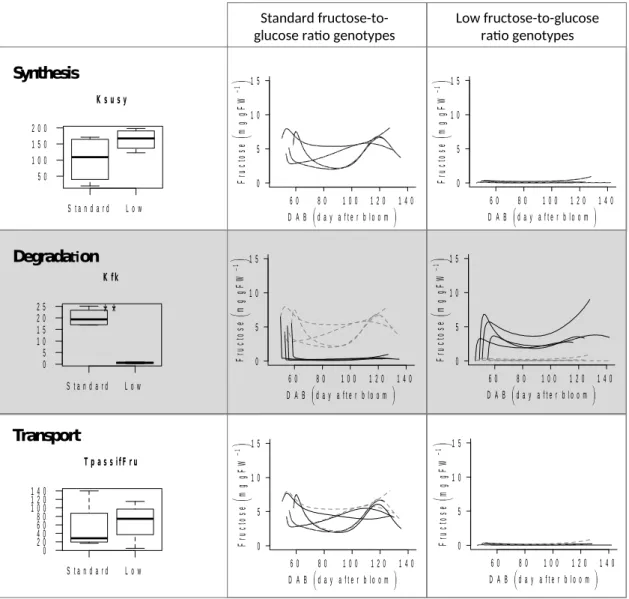
S t a n d a r d L o w 5 0 1 0 0 1 5 0 2 0 0 K s u s y 6 0 8 0 1 0 0 1 2 0 1 4 0 0 5 1 0 1 5 F ru ct o se m g gF W 1 D A B d a y a f te r b lo o m 6 0 8 0 1 0 0 1 2 0 1 4 0 0 5 1 0 1 5 F ru ct o se m g g F W 1 D A B d a y a fte r b lo o m 6 0 8 0 1 0 0 1 2 0 1 4 0 0 5 1 0 1 5 F ru ct os e mg g F W 1 D A Bd a y a fte r b lo o m 6 0 8 0 1 0 0 1 2 0 1 4 0 0 5 1 0 1 5 F ru ct o se m g g F W 1 D A B d a y a ft e r b lo o m 6 0 8 0 1 0 0 1 2 0 1 4 0 0 5 1 0 1 5 F ru ct o se m g g F W 1 D A B d a y a f te r b lo o m 6 0 8 0 1 0 0 1 2 0 1 4 0 0 5 1 0 1 5 F ru ct o se m g g F W 1 D A B d a y a f te r b lo o m Fig. 2. The three functioning hypotheses to explain the low fructose-to-glucose ratio phenotype are a modification of the fructose synthesis, degradation or transport. a, d and g) For the three hypotheses, a box plot represents the variability of the parameter values relative to the hypotheses (Ksusy, Kfk and TpassiFru respectively). For each hypotheses, the parameter values estimated for the four genotypes with the ‘standard-fructose-to-glucose’ phenotype correspond to the box named Standard and the four genotypes with the ‘low fructose-to-glucose’ phenotype correspond to the box named Low. ** Significant differences at p-value <0.01 (Student’s t-test between the two fructose types). b, e and h) Solid black lines correspond to fructose concentration (mg gFW-1) during fruit
development (DAB, days after bloom) corresponding to simulations of the four genotypes with the ‘standard-fructose-to-glucose ratio’ phenotypes with average values of the parameters corresponding to the hypothesis (Ksusy, Kfk and TpassiFru respectively) estimated from the genotypes with the ‘low fructose-to-glucose ratio’ phenotype. Gray
dotted lines correspond to the original fructose concentration simulations. ). c, f and i) Solid black lines correspond to fructose concentration (mg gFW-1) during fruit
development (DAB, days after bloom) corresponding to simulations of the four genotypes with the ‘low fructose-to-glucose ratio’ phenotypes with average values of the parameters corresponding to the hypothesis (Ksusy, Kfk and TpassiFru respectively) estimated from the genotypes with the ‘standard-fructose-to-glucose ratio’ phenotype. Gray dotted lines correspond to the original fructose concentration simulations.