HAL Id: hal-01402242
https://hal.archives-ouvertes.fr/hal-01402242
Submitted on 8 Dec 2016
HAL is a multi-disciplinary open access
archive for the deposit and dissemination of sci-entific research documents, whether they are pub-lished or not. The documents may come from teaching and research institutions in France or abroad, or from public or private research centers.
L’archive ouverte pluridisciplinaire HAL, est destinée au dépôt et à la diffusion de documents scientifiques de niveau recherche, publiés ou non, émanant des établissements d’enseignement et de recherche français ou étrangers, des laboratoires publics ou privés.
A multi-seasonal model of plant-nematode interactions
and its use for durable plant resistance deployment
strategies
S. Nilusmas, M. Mercat, T. Perrot, Suzanne Touzeau, V. Calcagno, C.
Djian-Caporalino, P. Castagnone, Ludovic Mailleret
To cite this version:
S. Nilusmas, M. Mercat, T. Perrot, Suzanne Touzeau, V. Calcagno, et al.. A multi-seasonal model of plant-nematode interactions and its use for durable plant resistance deployment strategies. Hortimodel 2016 - Models for plant growth, environment control and farming management in protected cultivation, Sep 2016, Avignon, France. 8 p. �hal-01402242�
A multi-seasonal model of plant-nematode interactions
and its use to identify durable plant resistance
deployment strategies
S. Nilusmas1, M. Mercat1, T. Perrot1, S. Touzeau1,2, V. Calcagno1, C. Djian Caporalino1, P.
Castagnone-Sereno1, L. Mailleret1,2
1 Université Côte d'Azur, INRA, CNRS, ISA, France. 2 Université Côte d'Azur, Inria, BIOCORE, France.
Abstract
Root-knot nematodes of the genus Meloidogyne are soil-borne, little mobile, polyphagous pests which threaten important sheltered crops such as vegetables or small fruits. They attack plant roots to feed and reproduce and have a major impact on crop yield. Most eco-friendly plant protection strategies are based on the use of resistant crops. The emergence of virulent nematode variants, which are adapted to the resistance, challenges the durability of such methods. Because virulent root-knot nematodes exhibit a reduced fitness on susceptible crops, combining both resistant and susceptible plants can help increase the efficacy and sustainability of resistance-based nematode control. Since nematodes have poor intrinsic dispersal ability, the association between resistant and susceptible plants should rely on crop rotation over cropping seasons, rather than on spatial arrangements. We proposed a semi-discrete model describing the population dynamics of plant roots and of nematodes within and over cropping seasons. This model, inspired by epidemiological concepts, was fitted to literature data on the within cropping season dynamics of susceptible tomato plants and avirulent nematodes; it was then extended to also account for resistant plants and virulent parasites. The model was used to compute optimal crop rotation strategies with respect to the minimization of an epidemiological criterion called AUDPC to increase crop yield over different time horizons (between 2 and 40 cropping seasons).
Keywords: epidemiology; nematode; resistance. INTRODUCTION
Root-knot nematodes are present in most soils worldwide. They can infect more than 5500 plant species (Goodey et al., 1956) and cause considerable damage to crops. Controlling these parasites has long relied on chemical treatments. Since 2006, many of these treatments have been removed from the market because of their environmental and sanitary impact (Abad and Williamson, 2010). This is for instance the case of methyl bromide, a preplant soil-fumigant that was banned by the European Union (MBTOC 2006; EC Directive 1107 ⁄ 2009). The fight against nematodes of genus Meloidogyne now consists in using plant cultivars bearing resistance genes. Avirulent nematodes are not able to infect such resistant plants. However, the risks of resistance being overcome by virulent nematode populations that were demonstrated in the laboratory (Djian-Caporalino et al., 2011) are more and more observed in cropping conditions (Djian-Caporalino et al., 2013). Resistance breaking may lead to a significant reduction of durability of resistance-based cultivars and thus compromise yield. Even though virulent nematodes are able to infect resistant and susceptible plants, they develop more slowly on the susceptible plants as the acquisition of virulence comes at the price of a fitness cost, represented by a decrease in fertility (Djian-Caporalino et al., 2011).
Setting up rotation strategies of resistant and susceptible crops should allow to increase the durability of resistance genes and limit the spread of virulent nematodes. Our aim is to explore the efficiency of such rotation strategies by a modelling approach. In this paper, we first present an epidemic model describing the infection dynamics of susceptible or resistant plants by avirulent and virulent nematodes. We then adjust it to the available experimental data. We finally use this model to determine optimal crop rotation strategies. MATERIALS AND METHODS
Our model is based on a description of plant root infection by nematodes: the free living parasites have limited mobility in the soil; they spread and reproduce in the local plant root system. Given that the problem under consideration is essentially seasonal, we used a semi-discrete plant epidemic model to describe the within-season plant root infection dynamics, coupled to the season-to-season survival of nematodes (Mailleret et al. 2012, Fabre et al. 2012, 2015).
Within-season infection dynamics
Figure 1. Compartmental diagram representing the within-season infection of susceptible (superscript X=S) or resistant (superscript X=R) healthy plant roots (HX
)
by virulent (subscript v) and avirulent (subscript a) nematodes (P), before becoming latently infected (E=Ea+Ev) and then infectious (I=Ia+Iv) plant roots. Parameters aredescribed in the text.
The within-season dynamics of the nematode infection of plant roots is described by a system of ordinary differential equations. When a healthy plant root H comes into contact with a free living nematode P, it becomes latently infected E as the nematode settles in the plant root. After a period 1/λ, it becomes infectious I, producing nematodes P at rate r. The infection of roots by nematodes negatively impacts root growth (Leskovar et al., 1990), which is taken into account through function f. This function discounts the basal growth rate
gx by a decreasing exponential function of the infection prevalence π=I/(HX+E+I) multiplied by a scaling factor k: f(H,E,I)=gxe-kπ
.
During a cropping season of length τ, either susceptible (X=S) or resistant (X=R) plants are grown. Two kinds of nematodes compete for healthy roots HX: avirulent nematodes Pa which can infect susceptible plants
(ε
aS=
1)
but are unable to infect resistantplants (εaR=0); and virulent nematodes Pv which can infect both susceptible and resistant
cost w associated with the virulence.We assumed that a proportion δ of newborn avirulent nematodes mutate into virulent nematodes and considered the reverse mutation as negligible (Castagnone et al., 1993). The within-season model equations read as follows (see also Fig. 1):
˙
P
a=
− βP
aH
X− ΩP
a+
r (
1 ─ δ) I
a˙
P
v=
− βP
vH
X− ΩP
v+
r δ I
a+
r (
1−w) I
v˙
H
X=
f ( H
X, I , E)− ε
a Xβ P
aH
X− ε
vβ P
vH
X˙
E
a=
ε
aβP
aH
X− λE
a˙
E
v=
ε
vβP
vH
X− λE
v˙I
a=
λE
a−
αI
a˙I
v=
λE
v−
αI
vParameter definitions, values and units are given in Table 1. The simulation of these equations were conducted with R (function ODE in package deSolve) using the Runge Kutta 4 method.
Winter survival of nematodes
Nematode densities Pa and Pv at the beginning of a given cropping season are
computed as the product of nematode densities at the end of the previous cropping season multiplied by the winter survival probability φ. Other variables are reset to zero, except the number of healthy roots H at crop plantation, which is set to the initial root biomass of newly planted individuals H0.
Model adjustment
All parameters could be estimated from the literature or expert knowledge but three: the conversion factor of units of root in feeding sites (x), the infection rate (β), and impact of infection prevalence on root growth rate (k ).
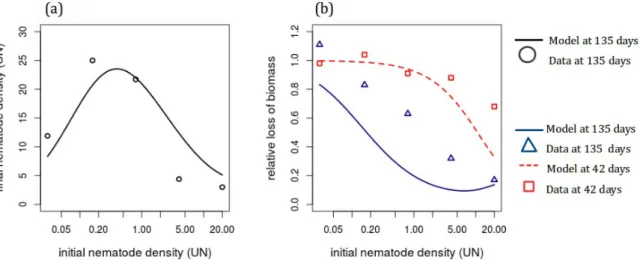
We thus obtained their value by adjusting the model to experimental data on the within cropping season dynamics of susceptible tomato plants and avirulent nematodes, reported by (Ehwaeti et al, 1998). They measured the final density of nematodes in the ground after one cropping season (Pdata) for different values of their in
itial d
ensity (i=1,...5), as well as the relative loss of biomass (Bdata) after 42 days (j=1) and at the end ofthe season, i.e. after 135 days (j=2). Each set of data is reported as the mean over five replicates, for five values of initial nematode density (Fig. 2). We computed the density of nematodes after 135 days (Pmodel) for each initial density. We assumed that we could equate
the relative loss of total biomass (the data) with the relative loss of root biomass (our model), the total root biomass being the sum of healthy (H), latent (E) and infectious (I) roots. So we could also compute this variable (Bmodel) for each initial nematode density (i=1,…
5) and at both dates (j=1,2). We measured the distance between our model output and the observed data using a weighted least square metric calculated in the following way:
RSS=
∑
i =1
5
(
P
model(
i)−P
data(
i)
Mean(P
data)
)
2+
∑
j=1 2∑
i=1 5(
B
model(
i, j)−B
data(
i , j)
Mean(B
data(
j))
)
2The division by averages allowed accounting for heterogeneous data between nematode density and relative loss of biomass. Model adjustment was done with the optim function in R, using Nelder-Mead’s method. The parameter values obtained are given in Table 1.
Table 1. List of model parameters: parameter values either derive from the literature [reference given] or were estimated [*]; values in brackets are given for the 6 parameters (in bold) that were varied.
Parameter Description Value (and range) Reference
r Nematode reproduction rate 25 UN x UR-1 x day-1 [1]
g Plant root growth rate 105 mg of roots x day-1 [2]
H0 Initial root biomass at the beginning of each
cropping season 1500 mg of roots [2]
Ω Mortality rate of nematodes in the soil 0.04 day-1 [3]
w Cost of virulence 0.4 (0.3, 0.35, 0.4, 0.45) [3]
εv Success of infection by virulent
nematodes. 0.8
aUR x bUN-1 [3]
λ Transition rate from E to I 0.05 day-1 [4,5]
α Mortality rate of infected feeding sites 0.125 day-1 [4,5]
δ Mutation rate of avirulent to virulent
nematodes 10
-3 (10-3, 10-4, 10-5, 10-6) [6]
τ Duration of each cropping season 135 days __
ε
aX Success of infection by avirulentnematodes. 0 if X=R, or 1 if X=S UR x UN
-1 __
φ Winter survival probability 0.8 (0.5, 0.6, 0.7, 0.8) [7]
P0 Initial nematode density in the soil 0.8 (0.016, 0.03, 0.8, 4, 20) UN [8]
β Infection rate 4.9 10-3 UR-1 x day-1 (3.92 10-3 ,
5.88 10-3) [*]
x Conversion factor between root mass and
density of feeding sites 3.7 10
-5 UR x mg of roots-1 [*]
k Impact of infection prevalence on root
growth rate 7.60 (6.08, 7.60, 9.12) [*]
aUR: number of feeding sites per gram of soil bUN: number of nematodes per gram of soil
Sources: [1]Tsai, 2008; [2] Leskovar et al., 1990; [3] Djian-Caporalino et al., 2011; [4] Ekanayake and Vito, 1986; [5] Ploeg and Maris, 1999; [6] Unpublished data Castagnone; [7] Unpublished data Djian-Caporalino; [8] Ehwaeti et al., 1998; [*] Estimated (see Model adjustment).
Optimal crop rotation strategies
We considered all periodic rotation strategies between resistant and susceptible crops, beginning with resistant crops, and alternating m and p seasons of resistant and susceptible plants, respectively. We denoted by mR+pS these periodic strategies. For instance, a 2R+1S (i.e. m=2 and p=1) strategy on a 10-season temporal horizon is RRSRRSRRSR. We also considered the two pure resistant-only and susceptible-only strategies that correspond to planting only one crop type along the seasons.
We quantified the performance of each strategy using an epidemiological criterion called the Area Under the Disease Progress Curve (AUDPC; Jeger, 2004) defined for one season as:
∫
0 τ
(
I
a(
t)+I
v(
t))dt
. More precisely, we used the average AUDPC calculated as the mean of the AUDPC over the n cropping seasons.The larger the criterion, the more severe the plant infestation by nematodes. We thus defined the optimal strategy as the one minimizing the above criterion. We have shown that
minimizing AUDPC amounts to maximize yield. Indeed, we found that AUDPC was negatively correlated with crop yield (not shown). We computed these optimal strategies for all temporal horizons between n=2 and n=40 cropping seasons.
To study the robustness of the strategies with respect to parameter values, we also varied the most uncertain or variable parameters according to the ranges given in Table 1. We calculated the AUDPC of all pure and periodic rotation strategies and for all 2880 parameter combinations. We then deduced the optimal strategy for each temporal horizon and each parameter set. We computed the median and the 5-95% inter-percentile over all parameter combinations for the optimal and pure strategies.
RESULTS AND DISCUSSION Model adjustment
The loss of biomass 42 days after planting was well fitted by the model (see Figure 2), but the model overestimated the loss of biomass after 135 days. The fit of nematode populations 135 days after planting was also satisfying.
Figure 2. Adjustment of the model to experimental data. (a) Final density of nematodes and (b) relative biomass loss after 42 (in red) and 135 days (in blue), as functions of the initial density of nematodes (logarithmic scale).
Optimal crop rotation strategies
The median and inter-percentile AUDPC for the susceptible-only strategies were constant for temporal horizons over 5 seasons(see Figure 3). In contrast, the AUDPC for the resistant-only strategies increased with the temporal horizon, which is characteristic of resistance breakdown by nematode populations.
As we could expect, the resistant-only and optimal strategies had lower AUDPC and hence performed better than the susceptible-only strategies. Up to 5 years the two former strategies had very similar performances, but for larger time horizons optimal strategies resulted in significant improvements: for instance, the average AUDPC was around 0.8 UR x days while resistant-only was around 1.2 UR x days for a 10-year temporal horizon. Hence, on very short time horizons, a resistant-only strategy remained efficient, while for longer temporal horizons, periodic rotations were preferable. The AUDPC gain obtained when shifting from a resistant-only to an optimal strategy could be almost as large as the one obtained by shifting from a susceptible-only to a resistant-only strategy.
Figure 3. Graphical representation of the susceptible-only, resistant-only and optimal periodic rotation strategies according to the temporal horizon, for the parameter combinations defined in Table 1. The shaded areas represent the 5-95% inter-percentiles, i.e. envelopes containing 90 % of the values over the 2880 parameter sets. The solid curves represent the median.
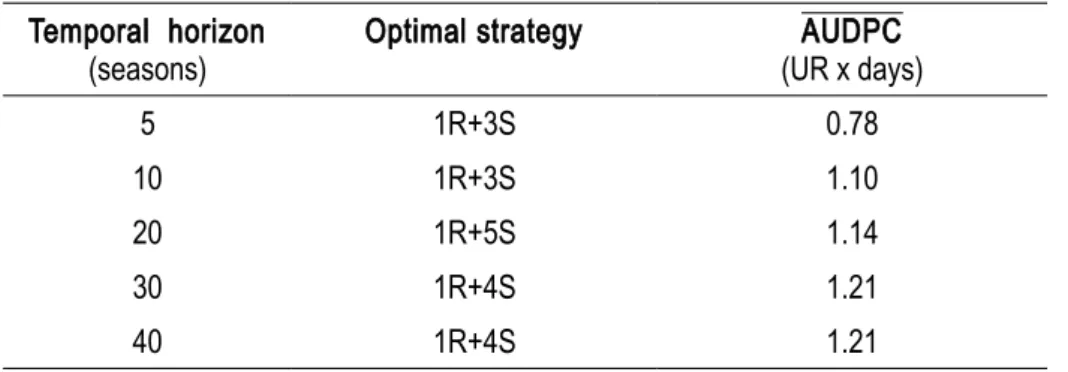
For temporal horizons greater than 5 seasons, optimal strategies generally alternated a single season of resistant (R) plants with a few seasons of susceptible plants (see Table 2). A single R season appeared to be the best trade-off to reduce the avirulent nematode population and limit the increase of virulent nematodes. With our parameter ranges, optimal performance was overall achieved by planting relatively few resistant plants. A low ratio of resistant plants limits the selection pressure in favour of virulent nematodes, but also increases crop losses as avirulent nematodes thrive on susceptible plants. On the contrary, larger resistant plant ratios decrease the durability of the gene, by selecting for virulent nematodes, which eventually cancel the benefits provided by the resistance.
Table 2. Optimal periodic rotation strategies with their associated AUDPC , for various temporal horizons. An mR+pS strategy alternates m and p seasons of resistant and susceptible plants, respectively.
Temporal horizon
(seasons) Optimal strategy (UR x days)AUDPC
5 1R+3S 0.78
10 1R+3S 1.10
20 1R+5S 1.14
30 1R+4S 1.21
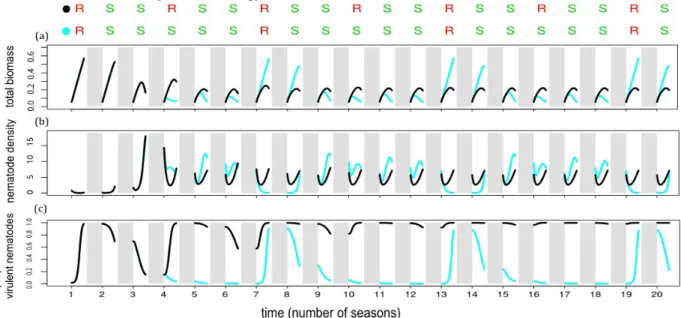
The resistant plant ratio had an impact on the performance and dynamics. We compared an optimal 1R+5S and a non optimal 1R+2S strategy on a 20-season temporal horizon (see Figure 4). After the first 3 seasons, which were the same for both strategies, the end-of-season value of the total biomass tended to stabilise around 0.2 UR for the non optimal strategy, whereas it varied between 0.1 and 0.6 UR for the optimal strategy (see Figure 4(a)).
The nematode population also had a fairly regular seasonal pattern for the non optimal strategy: its density varied between 2 and 7 UN (see Figure 4(b)) and mostly consisted of virulent nematodes (see Figure 4(c)). In contrast, the optimal strategy exhibited an irregular pattern: at the end of each R season, nematode density tended to 0. It then increased, but the proportion of virulent nematodes gradually decreased to 0 over the subsequent 4 S seasons (see Figure 4(c)). Indeed, virulent nematodes are selected for in resistant crops, but selected against in susceptible crops, as they are less competitive than avirulent nematodes. The 1R+5S optimal strategy ensured that virulent nematodes were rare in the soil when introducing resistant plants, in order to take full benefit from the resistance. In contrast, the 1R+2S non optimal strategy did not achieve the same result because 2 S seasons were not enough for the virulent nematodes to become rare. Consequently, during R seasons, production (biomass) increased for the optimal strategy, but not for the non optimal strategy.
Figure 4. Graphical representation of two periodic rotation strategies over a 20-season time horizon: the 1R+5S optimal strategy (in blue) alternating 1 and 5 seasons of resistant (R in red) and susceptible (S in green) plants, respectively; the 1R+2S non optimal strategy (in black). Winter seasons are illustrated as shaded areas. Corresponding AUDPC are 1.14 UR x days for the optimal strategy and 1.44 UR x days for the non optimal strategy.
CONCLUSION
This study proposed a model which describes plant root infection dynamics by nematodes. Parameter adjustment of our model on experimental data allowed to reproduce rather faithfully infected plant growth by nematodes during a cropping season. We looked for optimal periodic crop rotations, by minimizing a proxy of nematode damage to crops. The deployment of resistant and susceptible plants should allow to maintain crop yield while controlling resistance breaking by virulent nematodes. We found that rather few resistant plants are necessary to achieve this goal. To take the study one step further, we
could carry out sensitivity analyses to identify parameters which have most influence on the the optimal strategy. We could also test these strategies experimentally to validate their efficiency.
ACKNOWLEDGEMENTS
The authors are grateful to the Inria Sophia Antipolis - Méditerranée "NEF" computation cluster for providing resources and support.
Literature cited
Abad, P., and Williamson, V. M. (2010). Plant nematode Interaction: a sophisticated dialogue. Advances in Botanical Research. 53, 147-192.
Castagnone-Sereno, P., Bongiovanni, M., and Dalmasso, A. (1993). Stable virulence against the tomato resistance Mi gene parthenogenetic root-knot nematode Meloidogyne incognita. Phytopathology. 83, 803-805.
Djian-Caporalino, C., Molinari, S., Palloix, A., Ciancio, A., Fazari, A., Marteu, N., Ris, N., and Castagnone-Sereno, P. (2011). The reproductive potential of the root-knot nematode Meloidogyne incognita is affected by selection for virulence against major resistance genes from tomato and pepper. European journal of plant pathology. 131(3), 431-440.
Djian-Caporalino, C., Palloix, A., Fazari, A., Marteu, N., Sage-Palloix, A. M., Mateille, T., Tavoillot, J., Martiny, B., Risso, S., Lanza, R. et al. (2013). Evaluation expérimentale de stratégies de déploiement de gènes de résistance pour la gestion durable des nématodes à galles. Innovations Agronomiques. 28, 187-199.
EC Directive 1107 ⁄ 2009 of the European Parliament and of the Council of 21 October 2009 concerning the placing of plant protection products on the market and repealing Council Directives 79 ⁄ 117 ⁄ EEC and 91 ⁄ 414 ⁄ EEC. Official Journal of the European Union, 24.11.2009, L 309 ⁄ 1-50.
Ehwaeti, M. E., Phillips, M. S., and Trudgill, D. L. (1998). Dynamics of damage to tomato by Meloidogyne incognita. Fundamental and applied nematology. 21(5), 627-635.
Ekanayake, H. M. R. K., and Vito, M. Dr. (1986). Life cycle and multiplication of Meloidogyne incognita on tomato and egg plant seedlings. Tropical Agriculturist (Sri Lanka). 142, 59-68.
Fabre, F., Rousseau, E., Mailleret, L., and Moury, B. (2012). Durable strategies to deploy plant resistance in agricultural landscapes. New Phytologist. 193(4), 1064-1075.
Fabre, F., Rousseau, E., Mailleret, L. and Moury, B. (2015), Epidemiological and evolutionary management of plant resistance: optimizing the deployment of cultivar mixtures in time and space in agricultural landscapes. Evol Appl. 8, 919–932.
Goodey, T., Goodey, J. B., Franklin, M. T., Hooper, D. J. and Commonwealth Agricultural Bureaux et al. (1956). The nematode parasites of plants catalogued under their hosts. Commonwealth Agricultural Bureaux, Farnham Royal, England.
Jeger, M. J. (2004). Analysis of disease progress as a basis for evaluating disease management practices. Annual Review of Phytopathology. 42, 61-82.
Leskovar, D. I., Cantliffe, D. J., and Stoffella, P. J. (1990). Root growth and root-shoot interaction in transplants and direct seeded pepper plants. Environmental and Experimental Botany. 30(3), 349-354.
Mailleret, L., Castel, M., Montarry, J. and Hamelin, F.M. (2012). From elaborate to compact seasonal plant epidemic models and back: is competitive exclusion in the details? Theoretical Ecology. 5, 311.
Ploeg, A. T., and Maris, P. C. (1999). Effects of temperature on the duration of the life cycle of a Meloidogyne incognita population. Nematology. 1(4), 389-393.
Tsai, B. Y. (2008). Effect of temperature on the survival of Meloidogyne incognita. Plant Pathology Bulletin. 17, 203-208.

![Table 1. List of model parameters: parameter values either derive from the literature [reference given] or were estimated [*]; values in brackets are given for the 6 parameters (in bold) that were varied.](https://thumb-eu.123doks.com/thumbv2/123doknet/13442934.409945/5.892.119.772.167.776/table-parameters-parameter-literature-reference-estimated-brackets-parameters.webp)