HAL Id: hal-02442240
https://hal-cea.archives-ouvertes.fr/hal-02442240
Submitted on 16 Jan 2020HAL is a multi-disciplinary open access archive for the deposit and dissemination of sci-entific research documents, whether they are pub-lished or not. The documents may come from teaching and research institutions in France or abroad, or from public or private research centers.
L’archive ouverte pluridisciplinaire HAL, est destinée au dépôt et à la diffusion de documents scientifiques de niveau recherche, publiés ou non, émanant des établissements d’enseignement et de recherche français ou étrangers, des laboratoires publics ou privés.
Validation of the Newly Implemented 3D TDT-MOC
Solver of APOLLO3 Code on a Whole 3D SFR
Heterogeneous Assembly
P. Archier, J.-M. Palau, J.-F. Vidal, S. Santandrea, D. Sciannandrone
To cite this version:
P. Archier, J.-M. Palau, J.-F. Vidal, S. Santandrea, D. Sciannandrone. Validation of the Newly Implemented 3D TDT-MOC Solver of APOLLO3 Code on a Whole 3D SFR Heterogeneous Assembly. PHYSOR 2016 - Unifying Theory and Experiments in the 21st Century, May 2016, Sun Valley, United States. �hal-02442240�
VALIDATION OF THE NEWLY IMPLEMENTED 3D TDT-MOC SOLVER
OF APOLLO3
RCODE ON A WHOLE 3D SFR HETEROGENEOUS
ASSEMBLY
P. Archier, J.-M. Palau, J.-F. Vidal,
CEA, DEN, DER, SPRC, Cadarache Saint-Paul-Lez-Durance, F-13108, France
S. Santandrea, D. Sciannandrone
CEA, DEN, DM2S, SERMA, Saclay Gif-sur-Yvette, F-91191, France
ABSTRACT
A three-dimensional (3D) axial capabilities have been recently implemented in the TDT-MOC solver (Method of Characteristics solver), module of the French deterministic core physics analy-sis code APOLLO3 R currently under development. This solver has already been validated on a
two plans hexagonal sub-assembly test-case and showed quite good performances. In the frame-work of the ASTRID project, the CFV core presents strong heterogeneities, on both radial and axial directions, that are not treated correctly with the usual 2D solvers. The aim of this paper is to quantify the approximation made with non-fully-representative 2D cluster geometries by using the 3D TDT-MOC solver on a whole 3D heterogeneous CFV sub-assembly. Results obtained with 3D TDT-MOC are compared and validated using the continuous energy Monte-Carlo TRIPOLI-4 R
code and are discussed. Improvements, mainly focus on the homogenization and energy-collapsing methods, are also pointed out.
Key Words: Method of Characteristics, TDT solver, 3D, Validation, APOLLO3 R
1. INTRODUCTION
A reference calculation scheme using the APOLLO3 R code [1, 2] has been defined and validated
in Reference [3] in the case of the CFV1 core (ASTRID project [4]). Some results at the core level were not entirely satisfactory; one possible reason to this may be due to the choice of 2D cluster sub-assembly geometries (sub-critical sub-sub-assembly surrounded by a ring of fuel sub-assemblies) which are not fully representative of the exact 3D geometry in the core. One particular aspect of the CFV is its heterogeneity on both the axial and radial directions, and this makes difficult the passage from sub-assembly level to core level.
Recent developments in the three dimensional TDT-MOC solver (Method of Characteristics) have been integrated in APOLLO3 R
and performances evaluated in Reference [5] on a hexagonal FBR2 sub-assembly splitted in two: the lower part is made of fissile material whereas the upper part is composed of fertile. The flux calculation is performed in 3D and the self-shielding procedure is done radially in 2D per plan. It was concluded in this paper that self-shielding in 2D was sufficient (no correlations between each plan) and that axial refinement was necessary to obtain sufficient spatial convergence of the flux.
The aim of this paper is to quantify the approximation made with non-fully-representative 2D cluster geometries by using the 3D TDT-MOC solver on a whole 3D heterogeneous CFV sub-assembly. The 3D geometry is composed of five different regions from the CFV, starting from the core center to the top of the core. Results obtained on this geometry with TDT-MOC solver are also compared with the 3D continuous energy Monte-Carlo TRIPOLI-4 R code [6].
2. TEST CASE DESCRIPTION
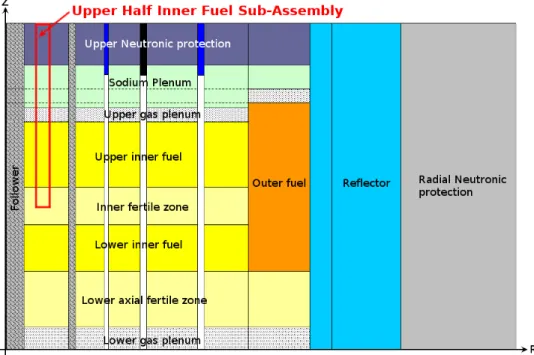
Figure 1.Radial description of the CFV core geometry. The red box corresponds to the upper half inner fuel sub-assembly, which is the chosen pattern of our test case geometry detailed further. The strong heterogeneities of the CFV core geometry require improved neutronic codes and associated calculation schemes in order to precisely evaluate the main neutronic parameters. Those geometrical properties can be seen on Figure1, showing a radial description of the CFV core and the numerous
different media along with the radial direction and especially the axial direction. The red box describes the upper half of an inner fuel sub-assembly and corresponds to the geometry used as a relevant test case in this paper with respect to axial issues.
Figure 2 details the test case geometry with five different axial zones: fertile, fissile, gas plenum, sodium plenum and axial neutronic protection (B4C absorber with about 90 % of B-10). This geometry reflects the heterogeneous characteristics of the CFV core, therefore it is a good benchmark to test and validate the 3D TDT-MOC solver. The boundary conditions are the following: reflective radially (infinite lattice), reflective at the bottom and void condition at the top of the geometry.
Axial Neutronic Protection (hom.)
Sodium Plenum (hom.)
Fertile Zone (het.) Upper Gas Plenum (hom.)
Fissile Zone (het.)
Z axis Void condition Reflective condition Y axis X axis Reflective conditions Reflective conditions
Figure 2.Geometry of the Upper Half 3D Inner Fuel Sub-Assembly of the CFV. Five different axial zones are detailed (from bottom to top): fertile, fissile, gas plenum, sodium plenum and neutronic protection. Only the fertile and fissile zones are described explicitly, the other zones are composed of homogenized media.
The calculation scheme associated to the 3D flux calculation is described explicitly in References [3,5]. To summarize the calculation route, the flux solver is fed with infinite diluted cross-sections described in a 1968 groups fine structure and transfer matrices detailed up to P3 Legendre order expansion. However, several special features due to this 3D geometry must be mentioned.
First, the calculation mesh along the Z−axis has to be refined enough in order to assure spatial con-vergence, especially near the interfaces (unregular axial mesh). It means that the axial size of the cells is between 0.5 cm and 1.25 cm. Secondly, the self-shielding calculation (subgroup method) is actually performed with the 2D exact Pij TDT-CPM solver (in the X −Y plan) on the five different axial regions
of our geometry, whereas the flux is calculated on the whole 3D geometry. Thus flux and self-shielded cross-sections are only correlated by the 3D source term integrated along the Z−axis. This assumption of self-shielding by plan has been validated and further details are given in Reference [5].
3. RESULTS AND DISCUSSION
3.1. 3D TDT-MOC vs. TRIPOLI-4 calculations
To validate our 3D multigroup calculations, we used the continuous energy Monte-Carlo TRIPOLI-4 R
code on the same heterogeneous geometry showed in Figure 2. Two configurations have been tested, one in a nominal condition where sodium is present in all the different regions, and one in a voided condition where sodium is missing in fertile, fissile, gas plenum and sodium plenum regions. The voided situation is interesting here to highlight the ability of the 3D TDT-MOC solver to account accurately the flux gradient, in particular in the sodium plenum zone.
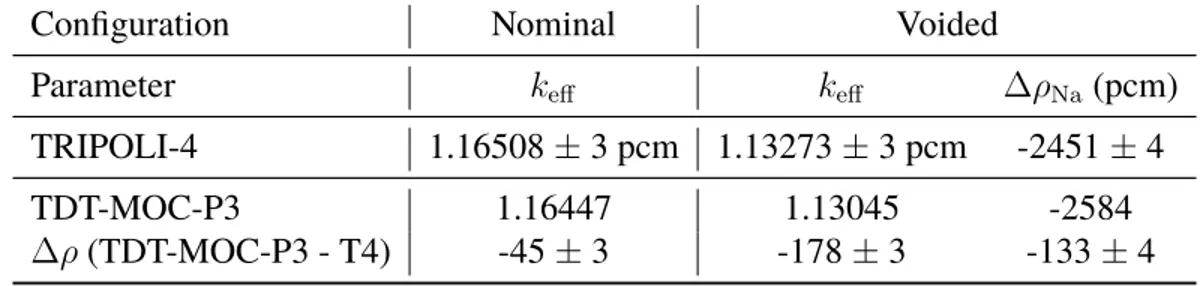
Results in terms of keff and reactivity effect are detailed in Table I. The agreement in the nominal
configuration is very good (less than 50 pcm) whereas the reactivity is slightly underestimated in the voided situation. The current axial discretization (120 plans) of the geometry might explain this dis-agreement in the voided case and would mean that the flux may not be fully converged spatially. Also, the independence assumption of the self-shielding effect between each axial region might not be valid anymore in the voided situation, because of the strong spectral variations and the flux gradient. An axial polynomial description of the 3D TDT-MOC flux, which should drastically reduce the number of axial plans and improve the flux calculations, is under development.
Table I.Multiplication factors (keff) and reactivity effects (∆ρ) for nominal and voided configurations,
calculated with 3D TDT-MOC solver, are compared to reference Monte Carlo TRIPOLI-4 R
calcula-tions.
Configuration Nominal Voided
Parameter keff keff ∆ρNa(pcm)
TRIPOLI-4 1.16508 ± 3 pcm 1.13273 ± 3 pcm -2451 ± 4
TDT-MOC-P3 1.16447 1.13045 -2584
Concerning the angular discretization, 360 directions for the quadrature have been considered in this case. A very detailed angular quadrature (576 directions) has also been tested and showed few varia-tions compared to the results from TableI, meaning that angular convergence seemed to be achieved.
3.2. Core calculations
The aim of the 3D TDT-MOC sub-assembly calculations previously presented is also to provide col-lapsed, homogenized and self-shielded cross-sections for full core configurations. Thus, we used the MINARET Sn solver [7] on the same geometry described in Figure2, but homogenized by plan: fertile and fissile zone are now homogeneous media. A S12 level-symetric quadrature and a very refined cal-culation mesh (more than 7 500 cells) have been chosen to assure both angular and spatial convergences of the solver. The homogenized and self-shielded cross-sections have been produced at the end of the TDT-MOC calculations with two energy meshes: one in a broad structure with 33 groups and another one with a fine structure with 1968 groups (without collapsing but with homogenization). Those two energy meshes will underline the effects of energy-collapsing and homogenizing the cross-sections in the core.
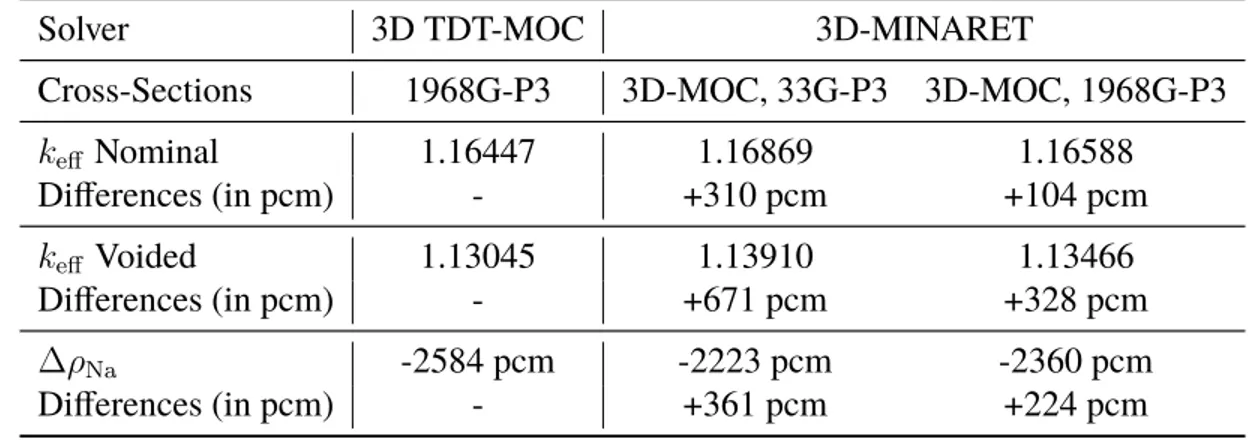
We can see in TableIIthe calculation results obtained with MINARET using different sets of cross-sections (33G and 1968G). The effect of the collapsing method is significant, in particular in the voided situation where a difference of more than 650 pcm is observed. The origin of these differences might come from the collapsing method, which currently uses the scalar flux instead of the angular flux. A recent development has been made in the APOLLO3 R code in order to calculate collapsed
cross-sections with the moments of the angular flux and should be employed when it will be validated. Furthermore, the homogenization effect is quite important (voided case in 1968G), the flux-volume homogenization, without performing any equivalence method, might be the cause of those biaises.
Table II.Multiplication factors (keff) and reactivity effect (∆ρ) for nominal and voided configurations.
The calculations are performed with MINARET core solver using different sets of cross-sections and are compared to initial 3D TDT-MOC calculations.
Solver 3D TDT-MOC 3D-MINARET
Cross-Sections 1968G-P3 3D-MOC, 33G-P3 3D-MOC, 1968G-P3
keff Nominal 1.16447 1.16869 1.16588 Differences (in pcm) - +310 pcm +104 pcm keff Voided 1.13045 1.13910 1.13466 Differences (in pcm) - +671 pcm +328 pcm ∆ρNa -2584 pcm -2223 pcm -2360 pcm Differences (in pcm) - +361 pcm +224 pcm
The 3D TDT-MOC solver should allow us to quantify the approximation made by using 2D cluster geometries, that are not completly representative of the real geometry, in our reference scheme (see Reference [3]). So, cross-sections calculated with 2D clusters are also fed to MINARET solver to be compared to results obtained with 3D TDT-MOC cross-sections.
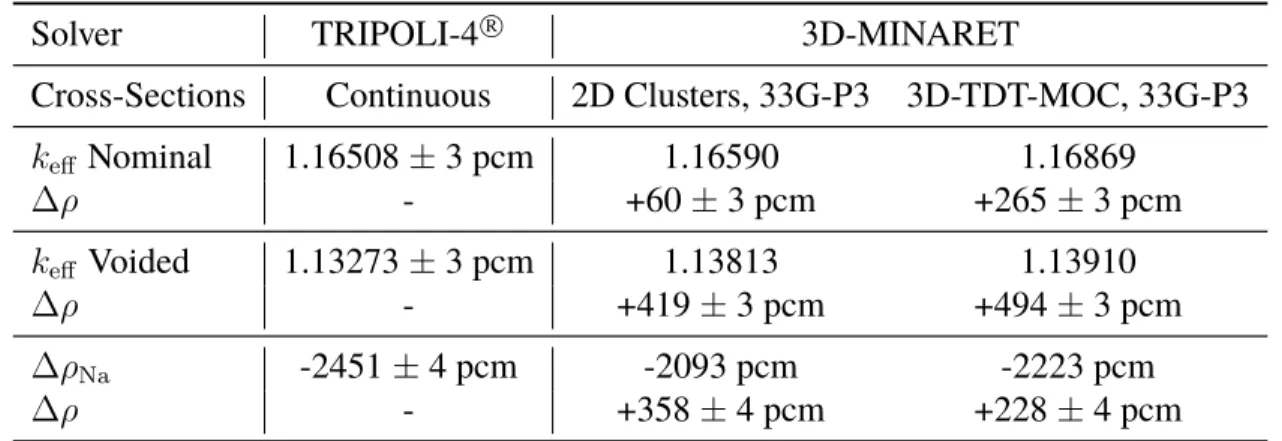
Table III presents the MINARET calculation results obtained using 2D clusters and 3D TDT-MOC cross-sections which are compared to continuous energy Monte Carlo results. In terms of multipli-cation factors, the 2D clusters cross-sections provide better results than the 3D TDT-MOC ones, es-pecially in the nominal configuration. The keff calculations for the voided configuration are not well
estimated (400-500 pcm biais), with both cross-sections sets. However, the void reactivity effect cal-culation is better using 3D-TDT-MOC cross-sections (same magnitude of biaises for both keff) than the
2D clusters ones. In conclusion, it is difficult to assert which scheme gives the best results, mostly be-cause there is a loss of information during the homogenization (no equivalence) and energy-collapsing (scalar flux only) procedure that cancels out the quite good agreement at the sub-assembly step.
Table III.Multiplication factors (keff) and reactivity effect (∆ρ) for nominal and voided configurations.
The calculations are performed with MINARET core solver using 2D clusters and 3D TDT-MOC sets of cross-sections and are compared to reference Monte Carlo TRIPOLI-4 R calculations.
Solver TRIPOLI-4 R 3D-MINARET
Cross-Sections Continuous 2D Clusters, 33G-P3 3D-TDT-MOC, 33G-P3
keff Nominal 1.16508 ± 3 pcm 1.16590 1.16869 ∆ρ - +60 ± 3 pcm +265 ± 3 pcm keff Voided 1.13273 ± 3 pcm 1.13813 1.13910 ∆ρ - +419 ± 3 pcm +494 ± 3 pcm ∆ρNa -2451 ± 4 pcm -2093 pcm -2223 pcm ∆ρ - +358 ± 4 pcm +228 ± 4 pcm 4. CONCLUSION
In this paper, the new 3D-TDT-MOC (Method of Characteristics) solver recently implemented in the APOLLO3 R code has been validated on a whole 3D heterogeneous CFV sub-assembly. The results
obtained with 1968 groups and P3 Legendre expansion (before the homogenization/energy-collapsing procedure) are in very good agreement with the reference Monte Carlo TRIPOLI-4 R code, in both
nominal and voided configurations.
After the homogenization/collapsing procedure, at the core step with MINARET solver, the results with 3D-TDT-MOC cross-sections get worse compared to original 3D-TDT-MOC and TRIPOLI-4 R
Several improvements are planned for 3D-TDT-MOC, the first one is the implementation of an axial polynomial expansion for a better description of the flux gradient. New methods of homogenization and cross-sections collapsing are also in development in APOLLO3 R and should give improved results
at the core level.
ACKNOWLEDGMENTS
The authors would like to thank the APOLLO3 R development team for their efforts in developing the
code. APOLLO3 R and TRIPOLI-4 R are registered trademarks of CEA. We gratefully acknowledge
AREVA and EDF for their long term partnership and their support.
REFERENCES
[1] H. Golfier et al. “APOLLO3: a common project of CEA, AREVA and EDF for the development of a new deterministic multi-purpose code for core physics analysis.” In: International Conference on Mathematics, Computational Methods and Reactor Physics (M&C 2009). American Nuclear Society (ANS). Saratoga Springs, New York, USA, May 3 - 7 (2009).
[2] D. Schneider et al. “APOLLO3 R: CEA/DEN Deterministic Multi-Purpose Code for Reactor
Physics Analysis.” In: This PHYSOR 2016 Conference. Americal Nuclear Society. Sun Valley, Idaho, USA, May 1 - 5 (2016).
[3] P. Archier et al. “New Reference APOLLO3 Calculation Scheme for Sodium Cooled Fast Reactors: from Sub-Assembly to Full-Core Calculations.” In: This PHYSOR 2016 Conference. Americal Nuclear Society. Sun Valley, Idaho, USA, May 1 - 5 (2016).
[4] P. Le Coz et al. “The ASTRID Project : Status and Future Prospects.” In: International Conference on Fast Reactors and Related Fuel Cycles: Safe Technologies and Sustainable Scenarios (FR13). French Nuclear Energy Society (SFEN). Paris, France, March 4 - 7 (2013).
[5] D. Sciannandrone et al. “Coupled Fine-Group Three Dimensional Flux Calculation and Sub-groups Method for FBR Hexagonal Assembly with the APOLLO3 R
Core Physics Analysis Code.” In: Joint International Conference on Mathematics and Computation (M&C), Supercomputing in Nuclear Applications (SNA) and the Monte Carlo (MC) Method. American Nuclear Society. Nashville, Tennessee, USA, April 19 - 23 (2015).
[6] E. Brun et al. “TRIPOLI-4 R, CEA, EDF and AREVA reference Monte Carlo code.” Annals of
Nuclear Energy, 82: pp. 151–160. Joint International Conference on Supercomputing in Nuclear Applications and Monte Carlo 2013, SNA + MC 2013. Pluri- and Trans-disciplinarity, Towards New Modeling and Numerical Simulation Paradigms (2015).
[7] J.-Y. Moller and J.-J. Lautard. “MINARET, a Deterministic Neutron Transport Solver for Nuclear Core Calculations.” In: International Conference on Mathematics and Computational Methods Applied to Nuclear Science and Engineering (M&C 2011). Latin American Section (LAS) / Amer-ican Nuclear Society (ANS). Rio de Janeiro, Brazil, May 8 - 12 (2011).