Publisher’s version / Version de l'éditeur:
Vous avez des questions? Nous pouvons vous aider. Pour communiquer directement avec un auteur, consultez la première page de la revue dans laquelle son article a été publié afin de trouver ses coordonnées. Si vous n’arrivez pas à les repérer, communiquez avec nous à PublicationsArchive-ArchivesPublications@nrc-cnrc.gc.ca.
Questions? Contact the NRC Publications Archive team at
PublicationsArchive-ArchivesPublications@nrc-cnrc.gc.ca. If you wish to email the authors directly, please see the first page of the publication for their contact information.
https://publications-cnrc.canada.ca/fra/droits
L’accès à ce site Web et l’utilisation de son contenu sont assujettis aux conditions présentées dans le site LISEZ CES CONDITIONS ATTENTIVEMENT AVANT D’UTILISER CE SITE WEB.
Research Report (National Research Council of Canada. Institute for Research in
Construction), 2007-01-01
READ THESE TERMS AND CONDITIONS CAREFULLY BEFORE USING THIS WEBSITE.
https://nrc-publications.canada.ca/eng/copyright
NRC Publications Archive Record / Notice des Archives des publications du CNRC : https://nrc-publications.canada.ca/eng/view/object/?id=db424f8f-3beb-4592-bafe-ea0e9147dac6 https://publications-cnrc.canada.ca/fra/voir/objet/?id=db424f8f-3beb-4592-bafe-ea0e9147dac6
NRC Publications Archive
Archives des publications du CNRC
For the publisher’s version, please access the DOI link below./ Pour consulter la version de l’éditeur, utilisez le lien DOI ci-dessous.
https://doi.org/10.4224/20377162
Access and use of this website and the material on it are subject to the Terms and Conditions set forth at
Approaches for Determining Gypsum Board Fall-Off Temperature in
Floor Assemblies Exposed to Standard Fires
Approaches for Determining Gypsum
Board Fall-Off Temperature in Floor
Assemblies Exposed to Standard
Fires
Research Report # 226
Date of Issue: January 2007
Authors: Audrey Roy-Poirier and Mohamed A. Sultan
Published by
Institute for Research in Construction National Research Council Canada Ottawa, Canada
Approaches for Determining Gypsum Board Fall-Off Temperature in
Floor Assemblies Exposed to Standard Fires
by
Audrey Roy-Poirier and Mohamed A. Sultan
SUMMARY
In this report, an attempt is made to develop temperature criteria for the fall-off of gypsum board layers in floor assemblies tested under standard fire conditions that can be used in the development of mathematical models for predicting the fire resistance of floor assemblies with lightweight framing. Results from eighty standard fire tests on floor assemblies protected with either one or two layers of gypsum board were classified into categories based on various parameters affecting the fire performance of gypsum board.
Four different approaches were studied using the recorded temperatures at the various gypsum interfaces in the assemblies to determine the approximate gypsum board temperature at the fall-off. For each category, the first approach was based on the average temperature that corresponds to the first and last pieces of gypsum board at the observed fall-off time during fire resistance tests. The second approach used the average of the first and last piece fall-off temperature criteria determined in the first approach. The gypsum board temperature at the time corresponding to the average of the first and last piece fall-off times was used to estimate the average fall-off temperature in the third approach. The last approach dealt with individual thermocouple temperature histories and determines the sudden increase in temperature caused by gypsum board fall-off.
Approaches for Determining Gypsum Board Fall-Off Temperature in
Floor Assemblies Exposed to Standard Fires
by
Audrey Roy-Poirier and Mohamed A. Sultan
TABLE OF CONTENTS
1. INTRODUCTION 4
2. GYPSUM BOARD 4
3. DESCRIPTION OF TEST ASSEMBLIES 5
4. INSTRUMENTATION 5
5. TEST CONDITIONS AND PROCEDURES 6
6. EXPERIMENTAL RESULTS 6
7. DEVELOPING FAILURE CRITERIA FOR GYPSUM BOARD 6
8. OBSERVED TIME OF FIRST AND LAST PIECE FALL-OFF 7
9. AVERAGE TEMPERATURE AT FALL-OFF 13
10. AVERAGE FALL-OFF TIME 18
11. SUDDEN RISE IN TEMPERATURE IN THE BOARD 23
12. SELECTED CRITERIA 31
13. DISCUSSION OF RESULTS 31
14. SUMMARY OF FINDINGS 32
INTRODUCTION
Part of the current fire safety research efforts are being invested into developing numerical models that can be used by designers to reduce the need for conducting standard fire resistance tests, which are both costly and time consuming. One important limitation of the current models developed for this purpose is the prediction of gypsum board fall-off, which significantly impacts the fire resistance of an assembly. Studies1,2 showed that, in lightweight frame assemblies, gypsum board provides up to 90% of fire resistance protection, owing in the major part to its high water content.
The National Research Council Institute for Research in Construction (NRC-IRC), in collaboration with industry and government partners, has carried out two major experimental research studies (Floors-I1 and Floors-II2) to measure the fire resistance and acoustic performance of full-scale floor assemblies with different framing types. Details on the assemblies’ construction and fire resistance results of these studies can be found in References 1 and 2. A study3 on gypsum board fall-off time was also carried out jointly between NRC-IRC and Carleton University. In that study, gypsum board fall-off times were determined from test observations and video-recordings of the fire-exposed gypsum board surfaces. The effects of a number of floor configuration parameters on the gypsum board fall-off time were investigated and highlighted that gypsum board fall-off times vary considerably from one assembly to the other depending on the materials and configuration selected. More details on that study and its findings are available in Reference 3.
Due to the difficulty in predicting gypsum board fall-off times for assemblies with configurations that have not previously been tested, a time failure criterion is impractical for use in numerical modelling. The purpose of this study is to establish an alternative criterion such as temperature for the fall-off of gypsum board exposed to standard fire that can be used to improve the accuracy of fire resistance models for lightweight floor assemblies.
GYPSUM BOARD
Gypsum board provides significant fire resistance protection to building assemblies. It is found in the form of a sheet product that consists of a non-combustible core pounded with paper-laminated surfaces, which is at least 75% pure gypsum and 25% additives such as glass fibre and vermiculate as well as other materials to enhance the fire resistance performance by reducing the likelihood of crack propagations and board shrinkage when exposed to heat. The gypsum core is calcium sulphate dehydrate, CaSO4 .2H2 O, a crystalline mineral that contains
about 21% by weight of chemically combined water. In addition, gypsum usually contains a small amount of absorbed free water. As the gypsum is heated to a temperature in excess of 80°C, it begins to undergo a thermal degradation process known as calcinations, in which the chemically combined water dissociates from the crystal lattice. The chemical equation for this process is:
CaSO4 .2H O2 → CaSO4 ½ H2 O + 3/2 H2 O
Calcium sulphate hemihydrate (CaSO4 ½ H2 O + 3/2 H2 O) is commonly known as plaster of
Paris. As the gypsum core reaches 125°C, calcinations are usually complete. Through continued heating, the remaining water is released as the hemihydrate undergoes dehydration to form anhydrous calcium sulphate CaSO4.
DESCRIPTION OF TEST ASSEMBLIES
Eighty floor assemblies, 4.8 m long by 3.9 m wide, were constructed in accordance with CAN/CSA-A82.31-M914 to investigate the effect of different parameters on the fire resistance performance of floor assemblies consisted of solid wood, wood I- joists, steel C- joists and wood trusses. In 72 floor assemblies (see Table 2) resilient channels, spaced either 203 mm o.c., 406 mm o.c., or 610 mm o.c., were used for sound reduction purposes and attached perpendicular to either the joists or trusses to support the gypsum board ceiling finish. Additional resilient channels were also installed to support gypsum board ends (board short dimension). The resilient channels, 14 mm deep by 58 mm wide, were fabricated from 0.6 mm thick galvanized steel sheets. The channels had a 34 mm wide web, designed to support the gypsum board connection, and one 18 mm wide flattened flange lip connected to the bottom of the joists or trusses. Three types of insulation were used: glass and rock fibre batts, and cellulose fibre insulation either sprayed wet on the underside of the sub-floor and on the side of the joists and allowed to dry to achieve an 11% moisture content or dry blown and supported at the bottom of the joists or trusses with a steel mesh. The glass, rock and cellulose insulation satisfied CSA A101-M835, CAN/ULC S702-M976 and CGSB 51.60-M907, respectively. The resilient channels and insulation were used for acoustical purposes to reduce the sound transmission across the floor. The sub-floor types used in the assemblies were either Canadian Softwood Plywood (CSP) or steel deck with concrete topping. The ceiling finish used in the assemblies was Type X gypsum board, 12.7 mm and 15.9 mm thick. The gypsum boards had the Firecode C Core Type X designation and met the requirements of Type X gypsum board8,9. The gypsum boards were supplied from one manufacturer to minimize potential variability associated with the production of such material by different producers. The boards were also packaged (100 boards a patch) to avoid board damage in transportation from the manufacturer to NRCC laboratories. The gypsum boards had an average surface density of 9.85 kg/m2 for a nominal 12.7 mm thick board and 10.5 kg/m2 for a nominal 15.9 mm thick board. They were attached perpendicular either to resilient channels in 72 assemblies or directly to the framing in 8 assemblies. Table 2 lists the variable parameters of the assemblies studied. Complete construction details can be found in References 1 and 2.
INSTRUMENTATION
In addition to the standard instrumentation specified in CAN/ULC-S101-M8910, numerous thermocouples (over 100) were placed within each floor assembly in order to obtain temperature histories at various locations during fire tests for further use beyond the scope of the above-mentioned studies. Type K (20 gauge) chromel-alumel thermocouples, with a thickness of 0.91 mm, were used for measuring the temperatures of the sub-floor surface and gypsum board surface facing the floor cavity as well as the interface surface between the gypsum board for assemblies with two layers of gypsum board and between the gypsum board and insulation at the floor cavity side. Temperature readings were recorded every minute across the floor assemblies. Details on the locations of the thermocouples can be found in References 1 and 2. All floor assemblies were tested with a superimposed load depending on the components of the assembly. Assemblies FF-01A to FF-09 were tested using a restricted load of 75% of maximum design load; while assemblies FF-10 to FF-82 were tested on a maximum design load. Details on the loading system arrangement can be found in References 1 and 2. The superimposed load used in this study for each assembly is given in Table 2. Two video cameras were used to record the fire exposed gypsum board performance.
TEST CONDITIONS AND PROCEDURES
The assembly’s gypsum board ceiling finish was exposed to heat in a propane-fired horizontal furnace in accordance with CAN/ULC-S101-M8910, “Standard Methods of Fire Endurance Tests of Building Construction and Materials” which is similar to ASTM E11911 “Standard Test Method for Fire Tests of Building Construction and Materials”. The furnace temperature was measured by nine (20 gauge) shielded thermocouples and the average of these thermocouples was used to control the furnace temperature in such a way that it followed, as closely as possible, the CAN/ULC-S101-M89 standard temperature-time curve.
The assembly was considered to have failed when one of the following failure criteria, as per CAN/ULC-S101-M89 Standard, occurred:
1. A single point temperature reading measured by one of the nine thermocouples under insulation on the unexposed surface rose 180°C above the ambient temperature,
2. The average temperature measured by the 9 thermocouples under the insulated pads on the unexposed surface rose 140°C above the ambient temperature,
3. There was passage of flame or gases hot enough to ignite cotton waste, or 4. The assembly was no longer able to bear the applied load.
Subsequently, the time of fall-off of the first and last pieces of each gypsum board layer for all assemblies was determined through viewing of the video recordings of the experiments. Details on this study can be found in Reference 3.
EXPERIMENTAL RESULTS
The results of the 80 full-scale fire resistance floor tests, including the time of fall-off of gypsum board layers, are summarised in Table 2. The average temperature at different surfaces in each assembly, furnace average temperature and three deflection measurements (maximum deflections) at the centre line of the assembly can be found in References 1 and 2.
DEVELOPING FAILURE CRITERIA FOR GYPSUM BOARD
The study performed on gypsum board fall-off times by Elewini3 confirms that gypsum board fall-off is not solely dependent on time. While relationships to estimate board fall-off times were successfully developed3, it is desirable for numerical modelling to obtain an alternative and more flexible criterion for gypsum board fall-off than time, which depends widely on the configuration of the assembly tested. The goal of this study is thus, to develop gypsum board failure criteria that can be readily applied to any floor assembly using numerical approach. Elewini3 notes: “It is evident from the experimental results presented in this study that the behaviour of the gypsum board is highly dependent on the severity of fire exposure.” Based on this observation, an attempt is being made to consider temperature as an alternate criterion for gypsum board fall-off.
Elewini3 identified and studied various parameters affecting the fire performance of gypsum board, concluding that the number of gypsum board layers used in the assembly, the installation and type of cavity insulation used, and the installation of resilient channels were the main factors influencing the fire resistance of gypsum board. Based on these findings, the 80 assemblies tested were divided into single and double gypsum board layer assemblies, and
each category was then divided further into non-insulated assemblies, assemblies with insulation against the gypsum board layers and assemblies with sprayed-on insulation. Finally, assemblies were separated according to their screw spacing; either 406 mm screw spacing or 610 mm screw spacing (resilient channel spacing or joist spacing when no resilient channels were installed). The assumption behind this last classification is that the strength of the bond between the gypsum board and the assembly will depend on the loading per screw on a gypsum board sheet, which varies with screw spacing on the sheet. Thus, the temperature required to break the bond between gypsum board and assembly would vary with screw spacing.
The following sections outline the approaches studied to establish temperature criteria for gypsum board fall-off.
OBSERVED TIME OF FIRST AND LAST PIECE FALL-OFF
The first approach used in developing failure criteria for the gypsum board layers was to study the first and last piece fall-off temperatures for each layer. The observed times of first and last piece fall-off, as reported in table 1, were used to determine the first and last piece fall-off temperatures. Averages of the temperatures recorded by all the thermocouples placed between the same layers in each floor assembly were compiled. The temperature corresponding to the time of fall-off of each piece was taken as the average temperature reading at the unexposed side (not facing the furnace) of each gypsum board layer. This average temperature reading was determined by linear interpolation of the experimental data available.
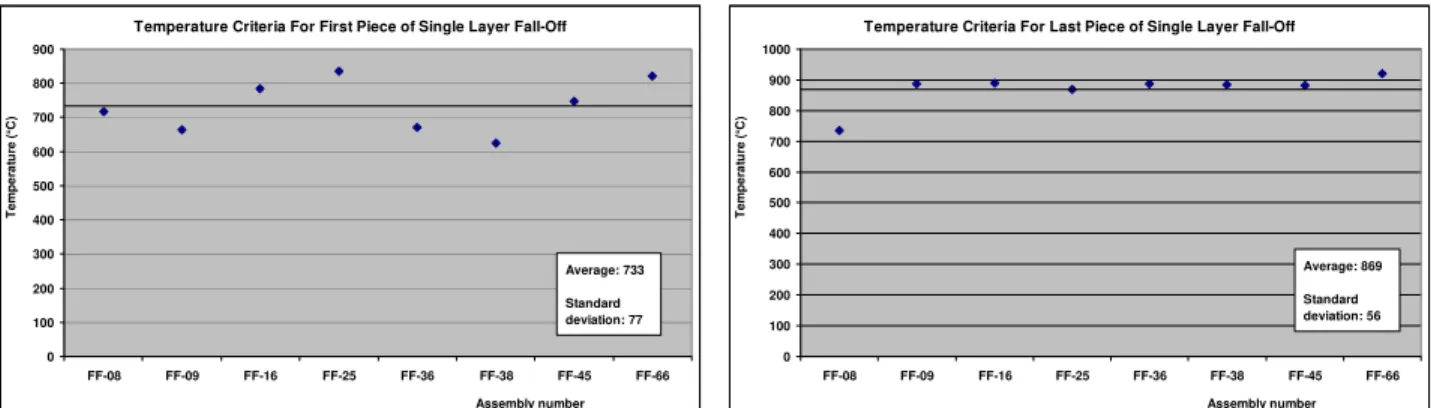
The arithmetic mean and standard deviation of the temperatures found for each assembly type were computed. Figures 1 through 3 show the statistical analyses of the first and last piece fall-off temperatures found for single gypsum board layer floor assemblies. Comparison of the results for non-insulated assemblies, assemblies insulated against the gypsum board layers and assemblies with sprayed-on insulation shows that fall-off temperatures are higher for insulated assemblies than for non-insulated assemblies. This seems to be due to a faster rate of heating of the gypsum board layer caused by thermal resistance of insulation. It is also worth noting that the standard deviations for first piece fall-off temperatures are twice that of the last piece fall-off temperatures with the non-insulated designs.
Temperature Criteria For First Piece of Single Layer Fall-Off
0 100 200 300 400 500 600 700 800 FF-01A FF-02A FF-14 FF-30 FF-37 Assembly number Te m p er at ur e ( °C) Average: 607 Standard deviation: 126
Temperature Criteria For Last Piece of Single Layer Fall-Off
0 100 200 300 400 500 600 700 800 900 FF-01A FF-02A FF-14 FF-30 FF-37 Assembly number Tem p er at ur e ( °C) Average: 763 Standard deviation: 60
Temperature Criteria For First Piece of Single Layer Fall-Off 0 100 200 300 400 500 600 700 800 900 FF-08 FF-09 FF-16 FF-25 FF-36 FF-38 FF-45 FF-66 Assembly number Te m p er at ur e ( °C) Average: 733 Standard deviation: 77
Temperature Criteria For Last Piece of Single Layer Fall-Off
0 100 200 300 400 500 600 700 800 900 1000 FF-08 FF-09 FF-16 FF-25 FF-36 FF-38 FF-45 FF-66 Assembly number Te m p er at ur e ( °C) Average: 869 Standard deviation: 56
Figure 2: Statistical Analysis for Single Gypsum Layer Assemblies With Insulation against Gypsum Layer and Screw Spacing at 406 mm
Temperature Criteria For First Piece of Single Layer Fall-Off
0 100 200 300 400 500 600 700 800 FF-07 FF-19 FF-49 FF-50 FF-74 Assembly number Te m p er at ur e ( °C) Average: 696 Standard deviation: 74
Temperature Criteria For Last Piece of Single Layer Fall-Off
0 100 200 300 400 500 600 700 800 900 1000 FF-07 FF-19 FF-49 FF-50 FF-74 Assembly number Te m p er at ur e ( °C) Average: 863 Standard deviation: 75
Figure 3: Statistical Analysis for Single Gypsum Layer Assemblies With Sprayed-On Insulation and Screw Spacing at 406 mm
The statistical analyses for the first and last piece fall-off temperatures of double gypsum board layer assemblies are presented in Figures 4 through 13. Figures 4 through 7 show the impact of screw spacing (406 mm or 610 mm) on the gypsum board temperature at the fall-off of both face and base layers in non-insulated assemblies. The same comparison is made for assemblies with insulation at the bottom of the cavity in Figures 8 through 11. Figures 12 and 13 present the face and base layer fall-off temperature for assemblies with sprayed-on insulation and screw spacing at 610 mm. (No sufficient test results were available for screw spacing at 406 mm in this case.) Base layer fall-off temperatures are seen to be significantly lower than face layer fall-off temperatures in the case of non-insulated assemblies (see Figures 10 to 13). In the case of insulated assemblies, base layer fall-off temperatures are also observed to be lower than face layer temperatures, but the difference is not as considerable. Temperatures are also found to be lower for wider screw spacing. Possible explanations of these phenomena will be explored in further sections.
The last piece of base layer fall-off temperature for assemblies FF-10, FF-41, FF-51 and FF-64 is shown as zero in Figures 5 and 7. This is because temperature recordings were stopped several minutes before the last piece of the base layer fall-off was recorded. These values were ignored in the computation of the average fall-off temperature.
Temperature Criteria For First Piece of Face Layer Fall-Off 0 100 200 300 400 500 600 700 800 FF-03A FF-10 FF-11 FF-12 FF-13 FF-22 FF-26 FF-28 FF-31 FF-40 FF-41 FF-51 FF-56 FF-60 FF-77 Assembly number T e m p erat u re ( °C ) Average: 637 Standard deviation: 62
Temperature Criteria For Last Piece of Face Layer Fall-Off
0 200 400 600 800 1000 1200 FF-03A FF-10 FF-11 FF-12 FF-13 FF-22 FF-26 FF-28 FF-31 FF-40 FF-41 FF-51 FF-56 FF-60 FF-77 Assembly number T e m p erat u re ( °C ) Average: 889 Standard deviation: 40
Figure 4: Statistical Analysis for Face Layer of Non-Insulated Double Gypsum Layer Assemblies With Screw Spacing at 406 mm
Temperature Criteria For First Piece of Base Layer Fall-Off
0 100 200 300 400 500 600 700 800 FF-03A FF-10 FF-11 FF-12 FF-13 FF-22 FF-26 FF-28 FF-31 FF-40 FF-41 FF-51 FF-56 FF-60 FF-77 Assembly number T e m p erat u re ( °C ) Average: 508 Standard deviation: 103
Temperature Criteria For Last Piece of Base Layer Fall-Off
0 200 400 600 800 1000 1200 FF-03A FF-10 FF-11 FF-12 FF-13 FF-22 FF-26 FF-28 FF-31 FF-40 FF-41 FF-51 FF-56 FF-60 FF-77 Assembly number T e m p erat u re ( °C ) Average: 736 Standard deviation: 164
Figure 5: Statistical Analysis for Base Layer of Non-Insulated Double Gypsum Layer Assemblies With Screw Spacing at 406 mm
Temperature Criteria For First Piece of Face Layer Fall-Off
0 100 200 300 400 500 600 700 800 FF-54 FF-62 FF-64 FF-71 Assembly number Te m p er at ur e ( °C) Average: 599 Standard deviation: 85
Temperature Criteria For Last Piece of Face Layer Fall-Off
0 100 200 300 400 500 600 700 800 900 1000 FF-54 FF-62 FF-64 FF-71 Assembly number Te m p er at ur e ( °C) Average: 860 Standard deviation: 33
Temperature Criteria For First Piece of Base Layer Fall-Off 0 50 100 150 200 250 300 350 400 450 500 FF-54 FF-62 FF-64 FF-71 Assembly number Te m p er at ur e ( °C) Average: 411 Standard deviation: 50
Temperature Criteria For Last Piece of Base Layer Fall-Off
0 100 200 300 400 500 600 700 800 900 1000 FF-54 FF-62 FF-64 FF-71 Assembly number Te m p er at ur e ( °C) Average: 824 Standard deviation: 52
Figure 7: Statistical Analysis for Base Layer of Non-Insulated Double Gypsum Layer Assemblies With Screw Spacing at 610 mm
Temperature Criteria For First Piece of Face Layer Fall-Off
0 100 200 300 400 500 600 700 800 FF-04A FF-06 FF-15 NR C-02FF-17FF-18FF-23FF-24FF-27FF-29FF-32FF-35FF-42FF-43FF-46FF-47FF-48FF-53FF-55FF-58FF-61FF-63 Assembly number Te m per a tur e ( °C) Average: 668 Standard deviation: 32
Temperature Criteria For Last Piece of Face Layer Fall-Off
0 200 400 600 800 1000 1200 FF-04A FF-06 FF-15 NR C-02FF-17FF-18FF-23FF-24FF-27FF-29FF-32FF-35FF-42FF-43FF-46FF-47FF-48FF-53FF-55FF-58FF-61FF-63 Assembly number Te m per a tur e ( °C) Average: 894 Standard deviation: 47
Figure 8: Statistical Analysis for Face Layer of Double Gypsum Layer Assemblies With Insulation against Gypsum Layer and Screw Spacing at 406 mm
Temperature Criteria For First Piece of Base Layer Fall-Off
0 100 200 300 400 500 600 700 800 900 FF-04A FF-06 FF-15 NR C-02 FF-17 FF-18 FF-23 FF-24 FF-27 FF-29 FF-32 FF-35 FF-42 FF-43 FF-46 FF-47 FF-48 FF-53 FF-55 FF-58 FF-61 FF-63 Assembly number Te m per a tur e ( °C) Average: 617 Standard deviation: 82
Temperature Criteria For Last Piece of Base Layer Fall-Off
0 200 400 600 800 1000 1200 FF-04A FF-06 FF-15 NR C-02 FF-17 FF-18 FF-23 FF-24 FF-27 FF-29 FF-32 FF-35 FF-42 FF-43 FF-46 FF-47 FF-48 FF-53 FF-55 FF-58 FF-61 FF-63 Assembly number Te m per a tur e ( °C) Average: 852 Standard deviation: 72
Figure 9: Statistical Analysis for Base Layer of Double Gypsum Layer Assemblies With Insulation against Gypsum Layer and Screw Spacing at 406 mm
Temperature Criteria For First Piece of Face Layer Fall-Off 0 100 200 300 400 500 600 700 800 FF-20 FF-44 FF-52 FF-59 FF-67 FF-68 FF-69 FF-73 FF-75 FF-79 FF-80 Assembly number T e m p erat u re ( °C ) Average: 650 Standard deviation: 58
Temperature Criteria For Last Piece of Face Layer Fall-Off
0 100 200 300 400 500 600 700 800 900 1000 FF-20 FF-44 FF-52 FF-59 FF-67 FF-68 FF-69 FF-73 FF-75 FF-79 FF-80 Assembly number T e m p erat u re ( °C ) Average: 874 Standard deviation: 61
Figure 10: Statistical Analysis for Face Layer of Double Gypsum Layer Assemblies With Insulation against Gypsum Layer and Screw Spacing at 610 mm
Temperature Criteria For First Piece of Base Layer Fall-Off
0 100 200 300 400 500 600 700 800 FF-20 FF-44 FF-52 FF-59 FF-67 FF-68 FF-69 FF-73 FF-75 FF-79 FF-80 Assembly number T e m p erat u re ( °C ) Average: 559 Standard deviation: 117
Temperature Criteria For Last Piece of Base Layer Fall-Off
0 100 200 300 400 500 600 700 800 900 1000 FF-20 FF-44 FF-52 FF-59 FF-67 FF-68 FF-69 FF-73 FF-75 FF-79 FF-80 Assembly number T e m p erat u re ( °C ) Average: 833 Standard deviation: 50
Figure 11: Statistical Analysis for Base Layer of Double Gypsum Layer Assemblies With Insulation against Gypsum Layer and Screw Spacing at 610 mm
Temperature Criteria For First Piece of Face Layer Fall-Off
0 100 200 300 400 500 600 700 800 FF-65 FF-70 FF-72 Assembly number T e m p erat u re ( °C ) Average: 696 Standard deviation: 11
Temperature Criteria For Last Piece of Face Layer Fall-Off
0 100 200 300 400 500 600 700 800 900 1000 FF-65 FF-70 FF-72 Assembly number T e m p erat u re ( °C ) Average: 831 Standard deviation: 36
Figure 12: Statistical Analysis for Face Layer of Double Gypsum Layer Assemblies With Sprayed-On Insulation and Screw Spacing at 610 mm
Temperature Criteria For First Piece of Base Layer Fall-Off 0 100 200 300 400 500 600 700 800 FF-65 FF-70 FF-72 Assembly number T e m p erat u re ( °C ) Average: 537 Standard deviation: 173
Temperature Criteria For Last Piece of Base Layer Fall-Off
0 100 200 300 400 500 600 700 800 900 1000 FF-65 FF-70 FF-72 Assembly number T e m p erat u re ( °C ) Average: 865 Standard deviation: 47
Figure 13: Statistical Analysis for Base Layer of Double Gypsum Layer Assemblies With Sprayed-On Insulation and Screw Spacing at 610 mm
Generally, the first piece fall-off temperatures were found to be more widely spread than the last piece fall-off temperatures. In both cases, the level of certainty associated with the average temperatures for each category is low; the standard deviations found exceeding 50ºC in most cases (only Figures 4, 6, 8 and 12 show better agreement, two of which were built on less than 5 points). It is also noted that, in the case of double layer assemblies, the ranges of values found for face layer fall-off temperatures were smaller than the base layer fall-off temperature ranges. Finally, a large difference in standard deviation is observed between the two temperature criteria shown in Figure 13, due to the limited number of tests available.
Although the previous observations suggest, from statistical point of view, that last piece temperatures should be preferred as more consistent fall-off criteria for gypsum board, those temperatures are considerably above the expected range for gypsum board fall-off and are closer to furnace temperature. It was observed that, once the first piece of a gypsum board layer falls-off, the fire protection provided by the latter is lost and the temperature in the cavity rises suddenly. It is necessary to discriminate this temperature rise from the temperature criteria sought, since it is to be used in numerical models that will only reproduce this temperature rise once the gypsum board layer is removed. A match of the cavity temperature with the furnace temperature might explain the better agreement seen with the last piece fall-off criteria found.
A few shortcomings of this method to determine temperature criteria were identified. The first one consists of a lack of precision of the temperatures obtained by linear interpolation. This is caused by a sudden rise in temperature (often above 300ºC in a minute), which is commonly observed in the temperature histories around the time of fall-off of gypsum board layers. Another weakness of this approach is that the average temperature of all thermocouple readings used may not represent correctly the actual physical phenomenon occurring in the floor assembly at the time of gypsum board fall-off. Indeed, because gypsum board is a composite material, its properties may vary across the floor assembly and the temperatures at the thermocouple locations may not be representative of the temperatures at the gypsum board fall-off locations. Finally, in the case of last piece of layer fall-off, approximations using the temperature recordings available had to be made in a few instances due to the lack of available data that was encountered. Two different situations occurred: either the gypsum board layer did not fall-off completely before the end of the test, in which case the end of the test was taken as the time of last piece fall-off3; either temperature recordings were ended before the fall-off of the last piece of gypsum board, in which case the last temperature recorded was taken as the fall-off temperature.
AVERAGE TEMPERATURE AT FALL-OFF
One of the pitfalls of the preceding approach was identified as a lack of physical meaning, especially in the case of the last piece fall-off. In the case of first piece fall-off temper
blems, the criterion considered in the second approach is an average fall-off temperature for gypsum board. Arithmetic means of the first and last piece fall-fall-off
ow the statistical analyses for non-insulated, insulated at the bottom of the cavity, and insulated at the top of the cavity single gypsum board layer floor assemblies. A
Figure 15: Statistical Analysis for Single Gypsum Layer Assemblies With Insulation against Gypsum Layer and Screw Spacing at 406 mm
atures, the accuracy of the values found can be questioned due to the large standard deviations obtained.
To remedy these pro
temperatures obtained with the preceding approach were computed for each assembly tested. The average and standard deviation of the means computed were then obtained for each category of assemblies.
Figures 14, 15 and 16 sh
small improvement in the standard deviations can be seen, especially when compared to the first piece fall-off temperatures, but the variation in temperature is still rather large. Once again, the assemblies with insulation against the gypsum board have the highest average temperature and the non-insulated assemblies the lowest.
Temperature Criteria For Average Temperature of Single Layer Fall-Off
0 100 200 300 400 500 600 700 800 900 FF-01A FF-02A FF-14 FF-30 FF-37 Assembly number Te m p er at ur e ( °C) Average: 685 Standard deviation: 87
Temperature Criteria For Average Temperature of Single Layer Fall-Off
0 100 200 300 400 500 600 700 800 900 1000 FF-08 FF-09 FF-16 FF-25 FF-36 FF-38 FF-45 FF-66 Assembly number Te m p er at ur e ( °C) Average: 801 Standard deviation: 51
Temperature Criteria For Average Temperature of Single Layer Fall-Off 0 100 200 300 400 500 600 700 800 900 FF-07 FF-19 FF-49 FF-50 FF-74 Assembly number Te m p er at ur e ( °C) Average: 780 Standard deviation: 64
Figure 16: Statistical Analysis for Single Gypsum Layer Assemblies With Sprayed-On Insulation and Screw Spacing at 406 mm
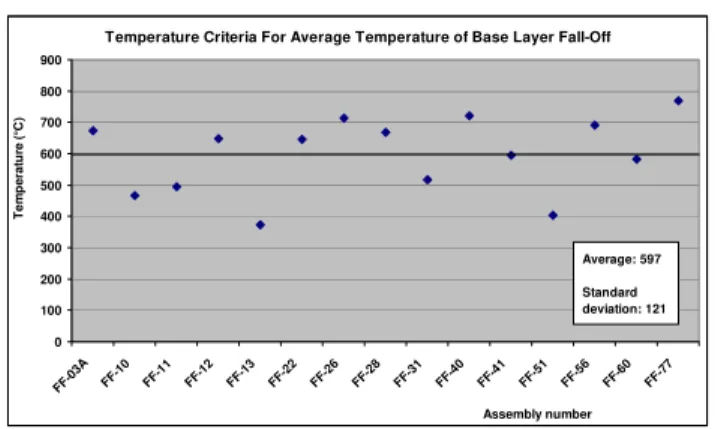
Figures 17 to 26 show the statistical analysis of the average temperature at fall-off for double gypsum board layer floor assemblies. Once again, it was noticed that the face layer fall-off temperatures are higher than the base layer temperatures. Moreover, the spread associated with face layer fall-off temperature criteria is significantly smaller than the spread of base layer fall-off temperatures. Figures 17 through 20 and 21 through 26 also show the influence of screw spacing on fall-off temperature. Once more, the assemblies with wider screw spacing display lower fall-off temperatures. The observations made about single gypsum board layer assemblies are also true here.
Temperature Criteria For Average Temperature of Face Layer Fall-Off
500 600 700 800 900 e m p erat u re ( °C ) 0 100 200 300 400 FF-03A FF-10 FF-11 FF-12 FF-13 FF-22 FF-26 FF-28 FF-31 FF-40 FF-41 FF-51 FF-56 FF-60 FF-77 Assembly number T Average: 763 Standard deviation: 40
ure 17: Statistical Analysis for Face Layer of Non-Insulated Double Gypsum Layer Assemblies With Screw Spacing at 406 mm Fig
Temperature Criteria For Average Temperature of Base Layer Fall-Off 0 100 200 300 400 500 600 700 800 900 FF-03A FF-10 FF-11 FF-12 FF-13 FF-22 FF-26 FF-28 FF-31 FF-40 FF-41 FF-51 FF-56 FF-60 FF-77 Assembly number T e m p erat u re ( °C ) Average: 597 Standard deviation: 121
Figure 18: Statistical Analysis for Base Layer of Non-Insulated Double Gypsum Layer Assemblies With Screw Spacing at 406 mm
Temperature Criteria For Average Temperature of Face Layer Fall-Off
0 100 200 300 400 500 600 700 800 900 FF-54 FF-60 FF-62 FF-64 Assembly number Te m p er at ur e ( °C) Average: 729 Standard deviation: 31
Figure 19: Statistical Analysis for Face Layer of Non-Insulated Double Gypsum Layer Assemblies With Screw Spacing at 610 mm
Figure 20: Statistical Analysis for Base Layer of Non-Insulated Double Gypsum Layer Assemblies With Screw Spacing at 610 mm
Temperature Criteria For Average Temperature of Base Layer Fall-Off
0 100 200 300 400 500 600 700 800 FF-54 FF-62 FF-64 FF-71 Assembly number Te m p er at ur e ( °C) Average: 558 Standard deviation: 144
Temperature Criteria For Average Temperature of Face Layer Fall-Off 0 100 200 300 400 500 600 700 800 900 FF-04A FF-06 FF-15 NR C-02 FF-17 FF-18 FF-23 FF-24 FF-27 FF-29 FF-32 FF-35 FF-42 FF-43 FF-46 FF-47 FF-48 FF-53 FF-55 FF-58 FF-61 FF-63 Assembly number Te m per a tur e ( °C)
Figure 21: Statistical Analysis for Face Layer of Double Gypsum Layer Assemblies With Insulation against Gypsum Layer and Screw Spacing at 406 mm
Average: 781 Standard deviation: 34
Figure 22: Statistical Analysis for Base Layer of Double Gypsum Layer Assemblies With Insulation against Gypsum Layer and Screw Spacing at 406 mm
Temperature Criteria For Average Temperature of Base Layer Fall-Off
0 100 200 300 400 500 600 700 800 900 FF-04A FF-06FF-15 NR C-02FF-17FF-18FF-23FF-24FF-27FF-29FF-32FF-35FF-42FF-43FF-46FF-47 FF-48 FF-53 FF-55 FF-58 FF-61 FF-63 Assembly number Te m per a tur e ( °C) Average: 735 Standard deviation: 53
Figure 23: Statistical Analysis for Face Layer of Double Gypsum Layer Assemblies With Insulation against Gypsum Layer and Screw Spacing at 610 mm
Temperature Criteria For Average Temperature of Face Layer Fall-Off
0 100 200 300 400 500 600 700 800 900 FF-20 FF-44 FF-52 FF-59 FF-67 FF-68 FF-69 FF-73 FF-75 FF-79 FF-80 Assembly number T e m p erat u re ( °C ) Average: 762 Standard deviation: 53
Temperature Criteria For Average Temperature of Base Layer Fall-Off 0 100 200 300 400 500 600 700 800 900 FF-20 FF-44 FF-52 FF-59 FF-67 FF-68 FF-69 FF-73 FF-75 FF-79 FF-80 Assembly number T e m p erat u re ( °C ) Average: 696 Standard deviation: 68
The main problem with this approach of determining the temperature criteria is the fact that it is not only based on the preceding technique but also it is based on the combined average of the first and last piece of gypsum board fall-off time which may not be appropriate for the statistical analysis Thus, most of the problems noted in the preceding section are encountered again. The lack of accuracy and precision of the readings may be attenuated by the process of using
Figure 24: Statistical Analysis for Base Layer of Double Gypsum Layer Assemblies With Insulation against Gypsum Layer and Screw Spacing at 610 mm
Temperature Criteria For Average Temperature of Face Layer Fall-Off
0 100 200 300 400 500 600 700 800 900 FF-65 FF-70 FF-72 Assembly number T e m p erat u re ( °C ) Average: 763 Standard deviation: 24
Figure 25: Statistical Analysis for Face Layer of Double Gypsum Layer Assemblies With Sprayed-On Insulation and Screw Spacing at 610 mm
Figure 26: Statistical Analysis for Base Layer of Double Gypsum Layer Assemblies With Sprayed-On Insulation and Screw Spacing at 610 mm
Temperature Criteria For Average Temperature of Base Layer Fall-Off
0 100 200 300 400 500 600 700 800 900 FF-65 FF-70 FF-72 Assembly number T e m p erat u re ( °C ) Average: 701 Standard deviation: 107
the average of two temperature recordings as opposed to a single one, but this is only artificial. The issue with physical meaning described for the last piece fall-off temperature criteria also affects this method. If the preceding temperatures did not bear any physical meaning, their average might be closer to the expectations and less widely spread, but not necessarily more accurate. Finally, this temperature criteria also depends on an important assumption that the gypsum board will fall at evenly distributed temperatures between the first and last piece fall-off temperatures, so that their average will be representative of the average gypsum board fall-off. It is difficult to confirm whether this assumption is reasonable.
AVERAGE FALL-OFF TIME
In this third approach, the method used is designed to avoid the problems identified in the previous approaches. The average time of fall-off – average between the time of fall-off of the first piece and of the last piece – was computed for each assembly. The temperature at this new fall-off time was determined by linear interpolation of the thermocouple reading averages,
s caused by missing temperature recordings which had to be substituted by the last data points available, as described for the first ture criteria. After ignoring this figure, the following observations der screw spacing is once again observed; contrar
F-10 and FF-51 are shown as zero in Figure 31. This is because temperature recordings were stopped before the average fall-off as described for the first and last piece fall-off criteria.
Figures 27 through 39 show the temperatures found as well as the average and standard deviation for all floor assemblies tested. The first three figures (27 through 29) show the impact of insulation type on gypsum board fall-off temperature in single gypsum layer assemblies. This time, we find the same temperature of fall-off for assemblies insulated both at the top and at the bottom of the cavity. The temperature of fall-off for non-insulated assemblies remains lower. There is an improvement from the previous methods in the standard deviations found, except for the assemblies with sprayed-on insulation in Figure 29, which standard deviation is slightly larger than with the average temperature fall-off criteria.
Figures 30 through 39 display the variations in fall-off temperatures for double gypsum board layer assemblies. The wide spread observed in Figure 31 wa
and last piece fall-off tempera
were made: a lower fall-off temperature for wi
y to the previous sections, this method shows a higher fall-off temperature for base layers than face layers. No clear trend between fall-off temperature and the type of insulation used is found in the case of double gypsum board layer assemblies.
The base layer fall-off temperatures for assemblies F
time computed for these tests. The two tests were ignored when calculating the average temperature and the standard deviation.
Temperature Criteria For Average Time of Single Layer Fall-Off
500 600 700 800 900 er at ur e ( °C) 0 100 200 300 400 FF-01A FF-02A FF-14 FF-30 FF-37 Assembly number Te m p Average: 762 Standard deviation: 59
Figure 28: Statistical Analysis for Single Gypsum Layer Assemblies With Insulation against Gypsum Layer and Screw Spacing at 406 mm
Temperature Criteria For Average Time of Single Layer Fall-Off
900 1000 0 100 800 FF-08 FF-09 FF-16 FF-25 FF-36 FF-38 FF-45 FF-66 Assembly number 200 300 400 500 600 700 Te m p er at ur e ( °C) Average: 875 Standard deviation: 33
Figure 29: Statistical Analysis for Single Gypsum Layer Assemblies With Sprayed-On Insulation and Screw Spacing at 406 mm
Temperature Criteria For Average Time of Single Layer Fall-Off
0 200 400 600 800 1000 1200 FF-07 FF-19 FF-49 FF-50 FF-74 Assembly number Te m p er at ur e ( °C) Average: 877 Standard deviation: 78
Figure 30: Statistical Analysis for Face Layer of Non-Insulated Double Gypsum Layer Assemblies With Screw Spacing at 406 mm
Temperature Criteria For Average Time of Face Layer Fall-Off
0 100 200 300 400 500 600 700 800 900 1000 FF-03A FF-10 FF-11 FF-12 FF-13 FF-22 FF-26 FF-28 FF-31 FF-40 FF-41 FF-51 FF-56 FF-60 FF-77 Assembly number T e m p erat u re ( °C ) Average: 817 Standard deviation: 73
Temperature Criteria For Average Time of Base Layer Fall-Off 0 100 200 300 400 500 600 700 800 900 1000 FF-03A FF-10 FF-11 FF-12 FF-13 FF-22 FF-26 FF-28 FF-31 FF-40 FF-41 FF-51 FF-56 FF-60 FF-77 Assembly number T e m p erat u re ( °C )
Figure 31: Statistical Analysis for Base Layer of Non-Insulated Double Gypsum Layer Assemblies With Screw Spacing at 406 mm
Average: 695 Standard deviation: 137
Figure 32: Statistical Analysis for Face Layer of Non-Insulated Double Gypsum Layer Assemblies With Screw Spacing at 610 mm
Temperature Criteria For Average Time of Face Layer Fall-Off
0 100 200 300 400 500 600 700 800 900 1000 FF-54 FF-62 FF-64 FF-71 Assembly number Te m p er at ur e ( °C) Average: 759 Standard deviation: 135
Temperature Criteria For Average Time of Base Layer Fall-Off
0 100 200 300 400 500 600 700 800 900 1000 FF-54 FF-62 FF-64 FF-71 Assembly number Te m p er at ur e ( °C) Average: 790 Standard deviation: 98
Temperature Criteria For Average Time of Face Layer Fall-Off 0 100 200 300 400 500 600 700 800 900 1000 FF-04A FF-06 FF-15 NR C-02 FF-17 FF-18 FF-23 FF-24 FF-27 FF-29 FF-32 FF-35 FF-42 FF-43 FF-46 FF-47 FF-48 FF-53 FF-55 FF-58 FF-61 FF-63 Assembly number Te m per a tur e ( °C)
Figure 34: Statistical Analysis for Face Layer of Double Gypsum Layer Assemblies With Insulation against Gypsum Layer and Screw Spacing at 406 mm
Average: 787 Standard deviation: 39
Figure 35: Statistical Analysis for Base Layer of Double Gypsum Layer Assemblies With Insulation against Gypsum Layer and Screw Spacing at 406 mm
Temperature Criteria For Average Time of Base Layer Fall-Off
0 100 200 300 400 500 600 700 800 900 1000 FF-04A FF-06 FF-15 NR C-02 FF-17 FF-18 FF-23 FF-24 FF-27 FF-29 FF-32 FF-35 FF-42 FF-43 FF-46 FF-47 FF-48 FF-53 FF-55 FF-58 FF-61 FF-63 Assembly number Te m per a tur e ( °C) Average: 831 Standard deviation: 87
Figure 36: Statistical Analysis for Face Layer of Double Gypsum Layer Assemblies With Insulation against Gypsum Layer and Screw S
Temperature Criteria For Average Time of Face Layer Fall-Off
0 100 200 300 400 500 600 700 800 900 1000 FF-20 FF-44 FF-52 FF-59 FF-67 FF-68 FF-69 FF-73 FF-75 FF-79 FF-80 Assembly number T e m p erat u re ( °C ) Average: 763 Standard deviation: 79 pacing at 610 mm
Temperature Criteria For Average Time of Base Layer Fall-Off 0 100 200 300 400 500 600 700 800 900 1000 FF-20 FF-44 FF-52 FF-59 FF-67 FF-68 FF-69 FF-73 FF-75 FF-79 FF-80 Assembly number T e m p erat u re ( °C ) Average: 777 Standard deviation: 88
Figure 37: Statistical Analysis for Base Layer of Double Gypsum Layer Assemblies With Insulation against Gypsum Layer and Screw Spacing at 610 mm
Temperature Criteria For Average Time of Face Layer Fall-Off
0 100 200 300 400 500 600 700 800 900 FF-65 FF-70 FF-72 Assembly number T e m p erat u re ( °C ) Average: 800 Standard deviation: 45
Figure 38: Statistical Analysis for Face Layer of Double Gypsum Layer Assemblies With Sprayed-On Insulation and Screw Spacing at 610 mm
Figure 39: Statistical Analysis for Base Layer of Double Gypsum Layer Assemblies With Sprayed-On Insulation and Screw Spacing at 610 mm
Temperature Criteria For Last Piece of Base Layer Fall-Off
0 100 200 300 400 500 600 700 800 900 1000 FF-65 FF-70 FF-72 Assembly number T e m p erat u re ( °C ) Average: 833 Standard deviation: 68
This approach generally gives better results than the previous ones for single layer assemblies, but there is no clear improvement for double gypsum board assemblies. Also, some of the trends identified in the previous sections are lost with this method. The temperatures are all found to be above 700°C, except for a temperature of 695°C for the base layer of non-insulated double layer assemblies with screws at 406 mm spacing (Figure 31). The expected
temperature of fall-off of gypsum board is significantly lower. Furthermore, the temperature criteria found do not vary considerably between last piece fall-off and average time fall-off, which may indicate that temperatures are stabilizing at this stage of the experiment. It seems that the portion of gypsum board layer left on the assembly ceiling at the average time of fall-off does not offer sufficient protection to the following layer to prevent the floor cavity from reaching the same high temperatures that it reaches once the gypsum board layer is entirely removed. Although this method uses the average fall-off time instead of the first and last piece fall-off times, the problem with missing temperature data identified for the first approach is encountered again. Thus, the problems identified with the first method, namely lack of accuracy and precision and missing temperature readings, are experienced once again with this method. The main downfall of this approach resides in the assumption underlying it; that gypsum fall-off will be regularly distributed between the fall-off times of the first and last pieces of the board. The average time between the first and last piece fall-off would thus correspond to the average
-An important one to consider is a malfunction of the that only cracking or a partial gypsum
cause the temperature to incre
gypsum board fall-off, and the temperature at that time would give a good estimate of the temperature of gypsum board at fall-off. This assumption does not represent reality since it does not account for the increase in temperature in the gypsum board layer and the floor cavity after the fall-off of the first piece of gypsum board. In fact, it seems that the fall-off of the first piece of gypsum board accelerates heat transfer into the floor cavity to the extent that the remaining pieces of gypsum board only make a minor contribution to the fire protection provided by the gypsum board layer.
SUDDEN RISE IN TEMPERATURE IN THE BOARD
The intent with this fourth and final approach is to reduce the spread associated with the temperature criteria found and to overcome the lack of physical meaning seen with the above mentioned approaches that used averages of the thermocouple temperature readings. This is attempted by a microscopic study of the data recorded during the experiments.
For all thermocouples located on the back face of gypsum board layers (six for each layer), the mperature recorded was plotted against time. An important characteristic identified in these te
temperature history graphs was a sudden and significant increase in temperature over a period of one or a few minutes only (often an increase of more than 300°C over a period of a minute). As an example for the reader, a set of these temperature histories, from floor assembly FF-01A, is provided in Figure 40.
The sudden temperature rises observed seem to correspond to the increase in temperature caused by the fall-off of the gypsum board layer at the location of the thermocouple; the fallen board piece allowing heat to penetrate rapidly into the next layer of the assembly.
Some graphs did not display this expected sudden increase in temperature. A variety of factors can explain this phenomenon.
thermocouple studied. Another explication could be
board fall-off occurred at the location of the thermocouple, which would
ase over a longer period of time. Finally, it is possible that the gypsum board did not fall-off at that thermocouple location.
It is interesting to note that, for assembly FF-01A, no sudden increase in temperature is seen for thermocouple #26 (see Figure 40), which recorded a maximum temperature of 430°C before the recording instrument was turned off due to termination of test. All other thermocouples registered temperatures over 800°C after the 24th
minute. This observation suggests that gypsum board remained in place at the location of thermocouple #26, protecting the latter from a rapid temperature increase until data recording was ended.
The temperature at which gypsum board falls off for each thermocouple was thus established as the last temperature recorded before the sudden temperature rise in the layer. Circles were drawn around the selected values in Figure 40 for more clarity. In cases where the step in temperature was not as clearly defined as the ones seen in Figure 40, the average of the two
Temperature History Thermocouple #18 600 700 800 900 1000 e ra tur e ( °C ) 0 100 200 300 400 Te 5 0 5 10 15 20 25 30 35 m p 00 Time (min) Temperature History Thermocouple #22 700 800 900 1000 ( °C ) 0 100 200 300 400 Te m 500 600 0 5 10 15 20 25 30 35 p e rat ur e Time (min) Temperature History Thermocouple #26 350 400 450 500 ) 0 50 100 150 200 250 300 0 5 10 15 20 25 30 35 Time (min) T emp er at u re ( °C Temperature History Thermocouple #44 800 900 0 100 200 300 400 500 600 700 0 5 10 15 20 25 30 35 Time (min) T emp er at u re ( °C ) Temperature History Thermocouple #48 0 100 200 300 400 500 600 700 800 900 0 5 10 15 20 25 30 35 Time (min) Te m p e rat ur e ( °C ) Temperature History Thermocouple #52 0 100 200 300 400 500 600 700 800 900 0 5 10 15 20 25 30 35 Time (min) Te m p e rat ur e ( °C )
recordings bracketing the base of this sudden temperature rise was taken as the fall-off temperature. Temperature histories with no such sudden temperature increase or multiple temperature steps of same magnitude were ignored when fall-off temperatures were calculated. The fall-off temperature of each gypsum board layer was then computed as the average of the fall-off temperatures found for each layer. Certain subjectivity was used at this stage to ignore data points that seemed erroneous, most probably due to a dysfunction of the thermocouple. To ensure that this method gave results that were consistent with observations made during the experiments, the time corresponding to the temperature of fall-off selected was recorded for each thermocouple. Those times were then compared to the fall-off times reported in Table 2. It was seen that temperature increases often occurred up to a minute before the first piece fall-off was reported. This could be due to cracking in the gypsum board leading to gypsum board fall-off within a short period of time. The time range for fall-off was thus extented by a minute before the first piece fall-off. Temperatures from the thermocouples with fall-off times outside the expanded time range were discarded. Only 21 points out of 822 temperatures were disregarded due to this reason, which corresponds to 2.6% of the readings. The mean values of fall-off times corresponding to the temperatures selected with this approach are reported in Table 2 for comparison with the fall-off times observed by Elewini3.
The fall-off temperatures were determined using the procedure described above to ensure that the temperature increase caused by the fall-off of a piece would not be accounted for in the determination of the temperature causing the piece to fall off.
Figures 41 through 43 show the statistical analysis of the fall-off temperatures found for single layer assemblies without insulation, with insulation at the bottom of the cavity and with insulation at the top of the cavity, respectively. An important temperature difference is seen between non-insulated and non-insulated assemblies. This could be due to the added thermal resistance caused by the installation in floor cavity. The highest temperature is found for assemblies with insulation at the bottom of the cavity and the lowest for non-insulated assemblies.
Temperature Criteria For Sudden Temperature Rise At Single Layer Fall-Off
100 200 300 400 500 600 Te m p er at ur e ( °C)
Figure 41: Statistical Analysis for Non-Insulated Single Gypsum Layer Assemblies With Screw Spacing at 406 mm
0 FF-01A FF-02A FF-14 FF-30 FF-37 Assembly number Average: 439 Standard deviation: 58
Temperature Criteria For Sudden Temperature Rise At Single Layer Fall-Off 800 900 300 400 500 600 Te m p er at ur e ( °C) 700 0 100 200 FF-08 FF-09 FF-16 FF-25 FF-36 FF-38 FF-45 FF-66 Assembly number Average: 680 F Standard deviation: 53
igure 42: Statistical Analysis for Single Gypsum Layer Assemblies With Insulation against Gypsum Layer and Screw Spacing at 406 mm
Temperature Criteria For Sudden Temperature Rise At Single Layer Fall-Off
600 700 800 ( °C) 200 300 400 500 Te m p er at 0 100 FF-07 FF-19 FF-49 FF-50 FF-74 Assembly number ur e Average: 659 Standard F deviation: 45
igure 43: Statistical Analysis for Single Gypsum Layer Assemblies With Sprayed-On Insulation and Screw Spacing at 406 mm
igures 44 to 53 show the statistical analysis of temperatures found with this metho F
g
d for double ypsum board layer assemblies. Figures 44 through 47 and 48 through 51 show the impact of screw spacing on both face and base layer. Once again, gypsum board fall-off temperatures are highest in assemblies insulated at the bottom of the cavity and lowest in non-insulated assemblies. The base layer fall-off temperatures are found to be significantly lower than face layer fall-off temperatures. Reasons that could explain this phenomenon will be proposed in a later section. As in previous cases, fall-off temperatures are lower with assemblies using wider screw spacing. This difference seems to be more significant for base layer temperatures. This method shows the largest difference in temperature from one category to another or between base and face layers. On the other hand, all standard deviations reported for double layer assemblies, excluding Figures 44 and 45, are below 50°C.
Temperature Criteria For Sudden Temperature Rise At Face Layer Fall-Off 0 100 200 300 400 500 600 700 800 FF-03A FF-10 FF-11 FF-12 FF-13 FF-22 FF-26 FF-28 FF-31 FF-40 FF-41 FF-51 FF-56 FF-60 FF-77 Assembly number T e m p erat u re ( °C ) Average: 624 Standard deviation: 52
Figure 44: Statistical Analysis for Face Layer of Non-Insulated Double Gypsum Layer Assemblies With Screw Spacing at 406 mm
Temperature Criteria For Sudden Temperature Rise At Base Layer Fall-Off
0 100 200 300 400 500 600 700 FF-03A FF-10 FF-11 FF-12 FF-13 FF-22 FF-26 FF-28 FF-31 FF-40 FF-41 FF-51 FF-56 FF-60 FF-77 Assembly number T e m p erat u re ( °C ) Average: 428 Standard deviation: 88
Figure 45: Statistical Analysis for Base Layer of Non-Insulated Double Gypsum Layer Assemblies With Screw Spacing at 406 mm
Temperature Criteria For Sudden Temperature Rise At Face Layer Fall-Off
100 200 300 400 500 600 Te m p er at ur e ( °C)
Figure 46: Statistical Analysis for Face Layer of Non-Insulated Double Gypsum Layer Assemblies With Screw Spacing at 610 mm
0 FF-54 FF-62 FF-64 FF-71 Assembly number Average: 514 Standard deviation: 48