Publisher’s version / Version de l'éditeur:
Journal of the Acoustical Society of America, 123, 4, pp. 2064-2077, 2008-04-01
READ THESE TERMS AND CONDITIONS CAREFULLY BEFORE USING THIS WEBSITE. https://nrc-publications.canada.ca/eng/copyright
Vous avez des questions? Nous pouvons vous aider. Pour communiquer directement avec un auteur, consultez la
première page de la revue dans laquelle son article a été publié afin de trouver ses coordonnées. Si vous n’arrivez pas à les repérer, communiquez avec nous à PublicationsArchive-ArchivesPublications@nrc-cnrc.gc.ca.
Questions? Contact the NRC Publications Archive team at
PublicationsArchive-ArchivesPublications@nrc-cnrc.gc.ca. If you wish to email the authors directly, please see the first page of the publication for their contact information.
Archives des publications du CNRC
This publication could be one of several versions: author’s original, accepted manuscript or the publisher’s version. / La version de cette publication peut être l’une des suivantes : la version prépublication de l’auteur, la version acceptée du manuscrit ou la version de l’éditeur.
For the publisher’s version, please access the DOI link below./ Pour consulter la version de l’éditeur, utilisez le lien DOI ci-dessous.
https://doi.org/10.1121/1.2839283
Access and use of this website and the material on it are subject to the Terms and Conditions set forth at
Evaluation of acoustical conditions for speech communication in working elementary school classrooms
Sato, H.; Bradley, J. S.
https://publications-cnrc.canada.ca/fra/droits
L’accès à ce site Web et l’utilisation de son contenu sont assujettis aux conditions présentées dans le site
LISEZ CES CONDITIONS ATTENTIVEMENT AVANT D’UTILISER CE SITE WEB.
NRC Publications Record / Notice d'Archives des publications de CNRC:
https://nrc-publications.canada.ca/eng/view/object/?id=36be12ba-17a5-4f5c-a246-136de8dc8040 https://publications-cnrc.canada.ca/fra/voir/objet/?id=36be12ba-17a5-4f5c-a246-136de8dc8040
Eva luat ion of a c oust ic a l c ondit ions for
spe e ch c om m unic at ion in w ork ing e le m e nt a r y
school cla ssroom s
N R C - 5 0 0 7 2
S a t o , H . ; B r a d l e y , J . S .
A p r i l 2 0 0 8
A version of this document is published in / Une version de ce document se trouve dans: Journal of the Acoustical Society of America, 123, (4), pp. 2064-2077, DOI:
10.1121/1.2839283
The material in this document is covered by the provisions of the Copyright Act, by Canadian laws, policies, regulations and international agreements. Such provisions serve to identify the information source and, in specific instances, to prohibit reproduction of materials without
written permission. For more information visit http://laws.justice.gc.ca/en/showtdm/cs/C-42
Les renseignements dans ce document sont protégés par la Loi sur le droit d'auteur, par les lois, les politiques et les règlements du Canada et des accords internationaux. Ces dispositions permettent d'identifier la source de l'information et, dans certains cas, d'interdire la copie de
Evaluation of acoustical conditions for speech communication in active
elementary school classrooms
Hiroshi Sato
Institute for Human Science & Biomedical Engineering, National Institute of Advanced Industrial Science and Technology, 1-1-1 Higashi, Tsukuba, Ibaraki 305-8566, Japan, Electronic mail: sato.hiro@aist.go.jp
John S. Bradley
Institute for Research in Construction, National Research Council, Ottawa, K1A 0R6 Canada.
Running title: acoustical conditions in classrooms
Date of upload (submission): July X, 2007
ABSTRACT
Detailed acoustical measurements were made in 41 active elementary school classrooms near Ottawa, Canada to obtain more representative and more accurate indications of the acoustical quality of conditions for speech communication during actual teaching activities. This paper describes the room acoustics characteristics and noise environment of 27 traditional rectangular classrooms from the 41 measured rooms. The purpose of the work was to better understand how to improve speech communication between teachers and students. The study found that on average the students experienced: teacher speech levels of 60.4 dBA, noise levels of 49.1 dB and a mean speech-to-noise ratio of 11dBA during teaching activities. The mean reverberation time in the occupied classrooms was 0.41 s, which was 10% less than in the unoccupied rooms. The
reverberation time measurements were used to determine the average absorption added by each student. Detailed analyses of early and late-arriving speech sounds showed these sound levels could be predicted quite accurately and suggest improved approaches to room acoustics design.
I. INTRODUCTION
There have been many published studies of acoustical conditions in classrooms and a recent review [1] summarised the trends from many of these. Measurements of classroom noise levels were found to be highest for classes of the youngest children varying from means of about 60 dBA for kindergarten (5 year olds) to approximately 50 dBA for grade 12 classrooms (17 year olds). Fewer measurements of teachers’ voice levels, as heard by the students, were found and these varied from about 50 to 65 dBA, tending to decrease with increasing age of the students. Reported measurements of classroom reverberation times were mostly in the range between 0.4 and 1.2 s.
In an earlier study, Houtgast [2] determined from classroom measurements that a signal-to-noise ratio of 15 dB was desirable for good communication in classrooms. This was confirmed by acoustical measurements and related speech intelligibility tests in 10 classrooms by Bradley [3]. The mean measured reverberation time in the 10 classrooms was 0.7s ( at 1 kHz) and ambient noise levels (in occupied classrooms without student activity) varied from 38 to 45 dBA. He also reported values of various room acoustics parameters and related intelligibility scores to combinations of reverberation time and signal-to-noise ratios as well as to useful-to-detrimental sound ratios.
More recently Iannace et al. [4] published results for schools exposed to high outdoor noise levels with indoor background levels of 51 to 61 dBA and early decay times of 1.2 to 1.5 s. Another study of Italian schools [5] found similar quite reverberant conditions. More adverse conditions were also reported by Losso et al. [6] in Brazilian classrooms. They reported ambient noise levels varying from 51 to 70 dBA and
reverberation times ranging from 1.1 to 1.7 s. Results from Japanese schools indicated shorter reverberation times of 0.2 to 1.0 s [7, 8] and ambient noise levels between 22 and 59 dBA [8]. Ueno et al. [9] reported 30 s Leq values for various activities in Japanese schools varying from 45 dBA for ‘moral education’ to over 80 dBA for musical
activities. A recent US study [10] also reported less extreme results with ambient noise levels varying between 38 and 55 dBA (unoccupied) and reverberation times from 0.3 to 1.1 s (occupied).
While the published results represent a very wide range of conditions, few provide information on the acoustical conditions in occupied classrooms. Almost all reported that ambient noise levels exceed current recommendations such as those in the ANSI S12.60 classroom acoustics standard [11]. There is an obvious lack of information on what really matters, that is, the conditions in active classrooms, and there are strong indications that most classrooms have serious acoustical problems (usually in the form of excessive background noise levels). There is a clear need for better information on
acoustical conditions in classrooms when they are occupied and in operation. It is only by studying active classrooms that we can optimally refine our estimates of the required acoustical criteria for classrooms and learn how best to achieve these criteria.
II. Room acoustics measurements in classrooms A. Measured classrooms
In this project, 41 classrooms were investigated including 16 grade 1, 12 grade 3 and 13 grade 6. Of these, 30 conventional rectangular shaped classrooms were measured
to determine room acoustics properties and noise levels in unoccupied conditions. Of the 30 classrooms, 27 were also successfully evaluated when occupied to determine teachers’ voice levels as well as occupied noise levels and room acoustics properties. Data from 8 other classrooms with non-rectangular shapes, and which were in open-plan schools, were excluded from the current analyses.
B. Room acoustics measurement procedure
Room acoustics quantities were obtained from impulse response measurements in occupied and unoccupied classrooms. A sine sweep signal (covering the 6 octave bands from 125Hz to 4kHz) was used to obtain the impulse responses and was radiated into the classroom from a small loudspeaker with directional properties similar to a human talker. The loudspeaker was set 1.5 m above the floor at the front of the room where the teacher would frequently stand. Sound level meters, with digital wireless transmitters, were located 1.2 m above the floor at 4 locations evenly distributed among the seated students in each classroom. The outputs of the digital receivers were fed to an 8 channel sound card (Echo Layla 24/96) and processed on a laptop PC. The validity of the new measurement software was determined by comparison with our previously validated RAMSoft-3 room acoustics measurement software [12].
C. Results of room acoustics measurements
1. Reverberation time, Early Decay Time and Clarity in occupied and unoccupied classrooms
It is important to know room acoustics properties for both occupied and
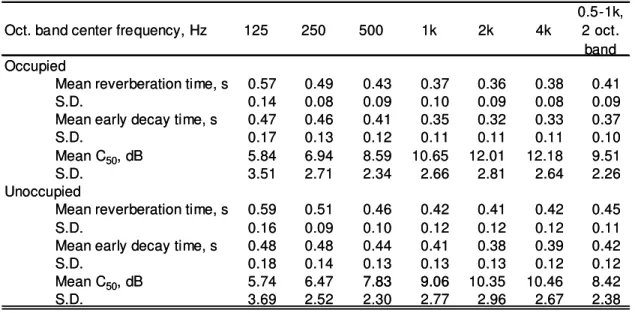
unoccupied classrooms to be able to determine the effects of students including the sound absorption that they add to the room. Table 2 shows reverberation times (T60), early decay times (EDT), and early-to-late energy ratios (C50) for both occupied and unoccupied classrooms. Results are given for the octave bands from 125 Hz to 4k Hz and also for a double-octave band representing mid-frequency results and including the 500 and 1k Hz bands. Because the loudspeaker used had directional characteristics similar to a human talker, these measured values should be representative of conditions in the classrooms when the teacher is talking. Reverberation times were calculated by backward
integration of the octave band filtered impulse responses and using the -5 to -35 dB range of the decay as recommended in ISO3382 [13]. More than a 45dB difference between the initial level and noise floor was found for all measured impulse responses and all octave bands.
For the unoccupied classrooms, mid-frequency reverberation times varied from 0.3 to 0.7 s with a mean of 0.45s. When the classrooms were occupied, reverberation times were decreased by approximately 10%. Early decay times also indicated similar results, but early decay times sometimes exceeded reverberation times due to strong flutter echoes observed in some classrooms. Furthermore, C50 values increased on average by 1.34 dBA when the rooms were occupied compared to the unoccupied conditions. This improvement consisted of a 0.49 dBA (S.D. = 0.54) decrease of early-reflection energy (including the direct sound) and a 1.84 dBA (S.D. = 0.79) decrease of late-arriving energy.
2. Sound absorption of students in classrooms
The sound absorption of the students was determined from the measured occupied and unoccupied reverberation times. For each condition, the total sound absorption was calculated using the Sabine equation (equation (1)).
A = 0.16V/T60 (1)
Where A is total sound absorption (m2), V is room volume (m3), and T60 is the
reverberation time (s).
Fig. 1 shows the relationship between sound absorption at mid-frequencies (i.e. in the double-octave band of 0.5 and 1kHz) for the occupied and unoccupied classrooms. These values were obtained from the measured reverberation times, room volumes and using equation (1). Each point is the room average of the 4 measurement points in one classroom. The regression line shows that occupied rooms have on average 5.83 m2 more sound absorption than the unoccupied rooms. The mean number of children in each classroom during the room acoustics measurements was 20.6 and hence the absorption per child was 0.28 m2 for the 500 and 1 kHz double-octave band. Table 3 also presents the sound absorption of the children in each of the 6 octave bands.
Because the sound source had directional characteristics similar to a human talker and classrooms may not have completely diffuse sound fields, these data should
realistically represent the added absorption of children in real classrooms. As Table 3 shows, sound absorption per student is lowest in the lowest two octave bands and highest in the 1 kHz band. The standard deviations are large because of variations among the rooms and differences in the distribution of children in the rooms relative to the positions
of the measurement microphones. These estimates of the absorption added per student, obtained from the differences of the mean sound absorption values in each octave band, should give values representative of the acoustical effect of children in this type of elementary school classroom.
3. Measured values of Strength (G) and their calibration
The sound strength, G, can be measured using a calibrated sound source, as the logarithmic ratio of the sound energy (integrated sound pressure squared) of the measured impulse response to that of the response of the same source measured at a distance of 10 m in a free field [13]. Strength is an important parameter that indicates how much the reflected sounds in the room enhance the direct sound from a source and increase the speech levels heard by students in classrooms. Here results for the mid-frequency range, obtained from the double-octave band including the 500 and 1k Hz octaves, are assumed to be important for speech. In addition to G values obtained from the complete impulse response, G50 values for the initial 50 ms of the impulse response and Glate values for the remaining part of the impulse responses were also determined (as described in [14]). Finally, the G value for the direct sound component, Gdirect was also determined to help in the calibration of the sound source. These are indicative of the relative levels of the direct sound (Gdirect), direct and early-arriving sound (G50), and late-arriving sound (Glate). The boundary between early reflections and late-arriving sound was 50ms after the direct sound arrival.
The sound power level of the sound source for the measurements was not successfully measured at the time of the classroom measurements and the following
process was used to later calibrate the output of the source. First, the directivity pattern of sound source was measured in 5 degree intervals in 3 dimensions. Second, typical
relationships between the locations of sound source and the microphones in the
classrooms were estimated by the following steps: 1) Use the mean floor dimensions of classrooms ( 9.3 m width and 7.7 m depth). 2) Microphones were typically set in the middle of each quarter of the seating area of the classroom and the sound source was located on the center line and 0.5 m away from front wall of the classroom. 3) From the floor dimensions, the mean angle from the central axis of the source to the two front microphones was estimated to be ±50 degrees and ±22 degrees for the two rear
microphones. 4) The height of the microphones were always 1.2 m and that of sound source 1.5 m and this height difference gives a mean vertical angle of 5.7 degrees with a S.D. of 1.6 degrees. This variation of the vertical angle would only lead to variations of the direct sound level within a 0.2 dB range. 5). The direct sound was selected from measured impulse responses using a 1 ms (44 points) time window from the peak of direct sound followed by a linear fade out for the next 1 ms (44 points). The direct sound energy was calculated from this windowed segment of the impulse response and
including the initial part of the impulse response before the arrival of the direct sound. That is, the initial part of the impulse response and a further 88 points starting from the peak of the direct sound arrival were included. Measurements in an anechoic room confirmed that this time window did not decrease direct sound energy in the 500 and 1 kHz double-octave band.
Since the same equipment and the same output sound levels were used in all classrooms, the sound power of the test signal was the same for all measurements. Microphones were calibrated at the beginning of measurements in each classroom.
The sound power level of the sound source was estimated by the following procedure: 1) The measured impulse responses were divided into two groups, those from the two closer microphones nearer the front of the classrooms and those from the two microphones nearer the rear of the classrooms. 2) Next, relative values for Gdirect were determined for all impulse responses. 3) Then the free field sound pressure levels (direct sound) were calculated for all measurement positions: for front microphones (horizontal angle, ±50 degrees), and for the rear microphones (horizontal angle ±22 degrees), and in all cases the vertical angles were calculated as a function of distance. 4) Determine the sound power level that minimizes the difference between free field calculated levels and measured direct sound levels. The least squares error fitting included all front and rear microphones at the same time. 5) The sound power level of the measurement source was estimated as 38 dB in the 500 and 1 kHz double-octave band.
This procedure was confirmed by new measurements with the same equipment in a meeting room with size and acoustical characteristics similar to the classrooms. For the meeting room measurements, the sound power level of the sound source was measured (in a reverberation chamber) and the calculation described above was again performed. In the meeting room the horizontal angle of the 6 microphones positions relative to the central axis of the sound source were measured and varied between 16 and 26 degrees. Both the horizontal and vertical measured angles were used for the estimation. The mean estimated sound power level was 0.73 dB more than the sound power level measured in
the reverberation chamber. Both estimated (y) and measured (x) sound pressure levels at the 6 measuring positions in the meeting room were well correlated (y = x-0.73) with r = 1.0, p < 0.001.
Fig. 2 presents the relationship between estimated Gdirect, calculated for free field conditions with Q = 1.83 (equivalent to assuming an average angle for the directivity index of 38.7 degrees from on-axis) and measured Gdirect. Equation (2) and equation (3) give the procedure for calculating Gdirect. The relative energy of the direct sound dr is proportional to the directivity index (Q) and inversely proportional to the distance squared. That is,
dr = 100Q/d2, (2)
Gdirect = 10log(dr), dB (3)
Where: d is the source-receiver distance (m) from sound source to the receiver. The value of Q = 1.83 was obtained by least squares regression analysis of the differences between the Gdirect values, measured in the classrooms and those predicted for free field conditions, as a function of Q values. This was done because the exact angles from the source to each receiver in the classrooms were not known and only approximate average angles for front and rear microphones were available. The value of Q = 1.83 is used throughout all further analyses of the classroom data in this paper. The scatter in the plots of the classroom data represents the individual differences between the actual Q values and the average best fit values of Q = 1.83.
4. Modification of Barron’s Revised theory for classroom acoustics
Barron and Lee [15] developed their revised theory for sound levels in concert spaces by calculating energy sums for the early (direct plus first 50 ms) and late parts of the sound reflections in impulse responses. Marshall applied the theory to predict C50
values for speech intelligibility [16]. In this section, energy sums of the early and late parts of the sound reflections in the impulse responses measured in the classrooms are compared with those predicted using Barron’s Revised theory.
As Barron and Lee proposed, three components of the relative sound energy are estimated: the direct sound (dr), the early reflected sound (up to 50 ms after the direct sound arrival, er), and late-reflected sound (more than 50ms after the direct sound arrival,
l). They produced the following equations to predict er and l values:
)
1
(
)
/
31200
(
0.04 / 60 0.0513.82/ 60 60 T T de
e
V
T
er
=
−−
− • (4) 60 60 0.0513.82/ / 04 . 0 60/
)
31200
(
T
V
e
d Te
Tl
=
− − • (5)Where: d, source-receiver distance (m), T60 reverberation time (s), V, room volume (m3).
The mean values of V and T60 of the measured classrooms (V = 198m3, T60 = 0.41s) are
used to calculate G values according to Barron’s revised theory. Strength G of each component is as follows;
Ger = 10log(er), dB (6),
where Ger is the G value for the early reflected sound.
G50 = 10log(dr+ er), dB (7)
Gtotal = 10log(dr+er+l), dB (9) Because measured and predicted Gdirect values are well related and both G50 and Gtotal are the result of summation of components of the reflected sound and the direct sound, Ger and Glate are selected to compare measured and predicted values from Barron’s revised theory. Fig. 3 presents Ger and Glate values as a function of distance and compares measured and predicted values of each.
In the revised theory, both Ger and Glate have the same slope with distance as equations (4) and (5) show. Because Ger values are less scattered than Glate values, and because Glate depends on Ger, the matching of the prediction line and the regression line for Ger values is examined.
The equation for the regression line for Ger versus distance in Fig. 3 is,
Ger = -0.84 d + 18.6 (r = 0.62, p < 0.001) (10)
The following regression equation fits the predicted values from Barron’s revised theory for mean V and T, with distance d varied from 1 m to 10 m in 0.5 m intervals,
Ger = -0.42 d + 17.2 (r = 1.0 p < 0.001) (11)
Comparing these two equations, the slope of the regression line for the measured data in equation (10) is twice that of the revised theory (i.e. –0.84 compared to –0.42). If the slope of the early reflection energy term in Barron’s revised theory is modified by a factor of 2, the average difference in measured and predicted values is 1.34 dB for Ger values and nothing for Glate values. Doubling the slope of the early-reflected energy and adding a constant of 1.34 dB results in the following modified versions of equation (4) and equation (5).
10 / 34 . 1 / 82 . 13 05 . 0 / 2 04 . 0 60
/
)
(
1
)
10
31200
(
'
=
T
V
e
− d• T60−
e
− • T60•
er
(4)’ 60 60 0.0513.82/ / 2 04 . 0 60/
)
31200
(
'
T
V
e
d Te
Tl
=
− • − • (5)’The result of these modifications adjust both of the prediction lines in Fig. 3 to be almost the same as the regression lines for the measured Ger and Glate values. The
modifications indicate that the early reflection energy decreases twice as rapidly with distance than the revised theory predicts. Barron and Lee noted that the slope is steeper in highly diffuse sound fields [15]. In the measured classrooms, floors were usually covered with chairs, desks and other furniture. The walls were usually covered with posters, cabinets and bookshelves. These would make the sound fields of classrooms more diffuse with more scattered early arriving sound. The possible reason for 1.34 dB addition is the difference in room size between classrooms and auditorium spaces and/or the directivity of the sound source. To explain these differences requires further detailed study which is beyond the scope of this paper that aims to describe the general trend of acoustical conditions in the measured classrooms.
Because the early and late parts of the reflected sound energy are well estimated by the modified revised theory, G50 and Gtotal predictions are also in good agreement with measurements when the modification is applied to the revised theory.
Using the various values measured in the classrooms in conjunction with equation (4)’ and equation (5)’, makes it possible to predict, Ger, G50, Glate and Gtotal quite
accurately. That is, values of er’ and l’ are used instead of er and l. Fig. 4 shows
measured versus predicted values of each of these four G values and hence validates the modification to Barron’s revised theory. All of parts of Fig. 4 show a diagonal line given
by y = x and all of the measured values are highly significantly correlated with the predicted values (p<0.001). The r.m.s. error of the estimate in each part of Fig. 4 are all about 1dB. It is clear that the modified version of Barron’s revised theory can be used to accurately predict conditions in these classrooms.
Fig. 5 shows predictions of various sound strength components (G values) using the modified version of the revised theory and as a function of source-receiver distance (d). For the predictions, mean values of V and T (V = 198m3, T60 = 0.41s) for measured
classrooms were used. For distances greater than about 5 m, the direct sound is lower than the late-arriving sound (Glate) and and G50 and Glate values tend to decrease in parallel as distance increases further. It is at these more distant listening positions that the useful speech sound (as measured by G50) is closest to the detrimental late-arriving speech sound (as measured by Glate). The most important room acoustics improvements to conditions for speech in the classroom could be achieved by reducing the late-arriving sound levels to extend better conditions to a larger portion of the classroom.
4. The relationship between early-arriving sound and reverberation time In the previous section, the modified version of Barron’s revised theory was shown to predict well both early and late-arriving components of the measured impulse responses from reverberation time, source-receiver distance and room volume as shown in Fig. 4. Fig. 5 shows the general trends of the variation of the sound strength
components with source-receiver distance using the mean room volume and reverberation time. Because optimum reverberation time is a key issue for classroom acoustics, the effects of reverberation time on each of the sound strength components was examined by
using the modified version of Barron’s revised theory. For these investigations, three distances (d = 2, 4, and 6 m), Q = 1.83 and V = 198 m3, were used.
The effect of reverberation time on early sound components
It is well known [17] that early-arriving reflections of speech sounds reaching the listener within 50 ms after the arrival of the direct sound are useful because they can help to increase the effective signal-to-noise ratio and hence the intelligibility of the speech.
G50 measures the relative energy of the direct sound and useful early-arriving reflections. As Fig. 5 shows, G50 is strongly related to the distance (d). Fig. 6 plots calculated G50 values versus reverberation time for r = 2, 4 and 6 m. G50 changes dramatically when reverberation time increases from 0.2 to 0.6 s and especially at the 6 m distance. This means that a room with shorter reverberation time will be lacking in early reflection energy (i.e. lower G50) at positions farther from the teacher where the early reflection energy would be most helpful to add to the weaker direct speech sound.
The authors have previously demonstrated the importance of early reflections and used the early reflection benefit (ERB) to assess their effectiveness [17]. ERB is given by the following,
ERB = G50 – Gdirect (12)
ERB is the relative increase in early arriving sound caused by the early reflection
energy arriving within 50 ms after the direct sound arrival and expressed relative to the direct sound strength. Barron referred to this same concept as an early reflection ratio [18]. Fig. 7 shows how ERB values increase with increasing distance and that this trend is the same as in the authors’ previous study [17]. Very steep changes in ERB values are
found at very short reverberation times and especially for d = 6 m. This means that early reflections can be most helpful for enhancing teachers voice levels at positions further from the teacher. For the mean measured reverberation time of 0.41 s, ERB values of up to 7 dB are expected according to Fig. 7. That is, a classrooms with the average
reverberation time for a listener located 6 m from the teacher, the voice level of the teacher would be enhanced 7 dB by the expected early arriving reflection energy.
Increasing the classroom reverberation time from 0.2 s to 0.4 s, for the same 6 m distance, would increase effective voice levels by about 4 dB. These predictions, based on the measurements in the 30 classrooms analyzed here, make it clear that very short reverberation times should be avoided so that the room can usefully enhance teacher voice levels and help to reduce voice strain for teachers.
The effect of reverberation time on late-arriving reflections
The late-arriving sound energy is relatively more diffuse than the early-arriving sound and Glate values do not correlate well with distance as seen in Fig. 3. However, Glate values are expected to correlate well with reverberation times. The relationship between reverberation times and Glate values is presented in Fig. 8 for 3 source-receiver distances. Fig. 8 shows that Glate values vary little with distance and vary more with reverberation time. Because Glate values have a steeper rate of change when plotted versus
reverberation time than the early components (Fig. 6), shorter reverberation times lead to higher early-to-late arriving sound ratios. This is confirmed in Fig. 9 that shows how C50 values decrease with increasing reverberation time. Fig. 9 indicates that C50 values will have their highest value for T60 = 0 s, which may lead to suggestions that T60 = 0 s is the
optimum reverberation time. This is incorrect because one must also consider how these room acoustic effects combine with speech and noise levels to determine speech
intelligibility scores. This is discussed later in this paper.
III Speech and noise level measurement during active classes
It is very important to know the levels of teachers’ voices and classroom noises during actual teaching activity. It is the resulting signal-to-noise ratios that will determine how intelligible the teacher’s speech will be to the students. To obtain the basic
information, background noise levels were first measured in each octave band during impulse response measurements in occupied and unoccupied classrooms under conditions without any student activity. Table 4 presents the measured octave band noise levels. The average noise levels in the unoccupied classrooms were more than the 35dBA
recommended by ANSI S12.60 [11]. Two of the classrooms had slightly lower average ambient levels for unoccupied conditions with averages of 34.8 and 33.0 dBA. In all others ambient noise levels exceeded 35 dBA.
A. Speech and Noise Level Measurements in Active Classrooms
Recordings of speech and noise levels in active classrooms were successfully completed in 27 rectangular shaped classrooms. The instruments used for the recording were the same as for the sound receiving part of the impulse response measurement system. Sound recording software (CoolEdit Pro Ver.1.5) was used for the PC based recordings using 16 bit integers and a sampling rate of 44.1 kHz. Typically 15 to 20
minutes of a teaching activity in which the teacher talked quite frequently to the children were recorded.
The processing of the recorded speech and noise levels first calculated A-weighted sound levels for each 200 ms interval of the recorded classroom sounds. Distributions of these levels were used to estimate separate speech and noise levels as suggested by Hodgson [19]. Two normal distributions were fitted to each histogram of the combined A-weighted levels. One distribution identified the noise and the other the teachers’ voice levels. In some cases, Hodgson describes using 3 distributions (to identify speech, ventilation noise, and student activity noise) for university classroom
measurements, but only two distributions were used in the present study because the main purpose was to measure teachers’ voice levels relative to all other sounds. In addition, the activity noises of children in elementary schools have a wide range of levels and are difficult to differentiate from other noise sources with this technique. Fig. 10 describes the fitting of two normal distributions to the recorded combined speech and noise levels.
This technique could not be applied to the seven open-plan classrooms. Because of poor isolation between adjacent classrooms, wanted and unwanted speech sounds could not be separated using this technique. That is, frequently the voice level of the teacher in the next classroom was of a similar level to the voice of the teacher in the classroom being measured. These analyses were completed for 27 of the enclosed rectangular classrooms.
1. Noise levels and teachers’ voice levels in active classrooms
Fig. 11 presents distributions of the measured speech and noise levels for 108 cases (4 microphone positions x 27 rooms). For this data the mean speech level was 60.4 dBA (S.D. = 4.4 dBA) and the mean ambient noise level 49.1 dBA (S.D.= 4.3 dBA).
2. Speech-to-noise ratios in active classrooms
The distribution of mean speech-to-noise ratios in the 27 classrooms is shown in Fig. 12. These results ignore variations with time within each recording and average over the 4 measurement positions in each classroom. Fig. 12 shows that in these results only 6.25% of the active class situations satisfy the S/N ≥ 15dBA requirement for 12-13 year old children to get near perfect word recognition scores [3]. The standard deviation of speech-to-noise ratios is smaller than for the noise and speech levels. This suggests that teachers’ voice levels tend to increase with increasing noise levels as would be predicted by the Lombard effect [20].
IV. DISCUSSION
1. Estimation of voice levels 1 m from the teachers’ mouth and evidence of the Lombard Effect
The corresponding free field speech level 1m from the talker, was estimated from the impulse responses and the distance from the measurement loudspeaker to each
microphone. The effect of sound reflections was estimated by subtracting the direct sound energy from total energy of the impulse response. The direct sound energy was calculated as described Chapter II Section 3. This process assumes that the teacher
always talked from the same position as the location of the measurement loudspeaker. These calculations were carried out for the results of the A-weighted speech levels.
The mean voice level of the 27 teachers was estimated to be 65.3 dBA for a position 1m from the mouth of the teacher in a free field and the standard deviation of these voice levels was 3.69 dBA. The average difference between the highest and the lowest voice levels, from the 4 measurement positions in each classroom, was 2.8 dBA, varying from a maximum of a difference of 12.5dBA to a minimum of 0.6 dBA.
The average voice level of 65.3 dB corresponds to being between Pearsons’ categories [21] for ‘Raised’ and ‘Loud’ speech for female talkers. (Most but not all teachers were female). Pearsons also reported that teachers’ voice levels were 62 to 66dBA at positions near the front of classrooms (2 m). If one adjusts our result to an increased distance of 2 m (-6 dB) and adds on the expected increase due to room reflections (+2.89 dB) our mean voice level would approximate 62.1 dBA at 2 m in a classroom, which is in the range reported by Pearsons et al.
Fig. 13 shows the relation between room-average speech and noise levels. They are well correlated (correlation coefficient, r = 0.82, p < 0.001). These speech levels, obtained by the distribution technique, were the average of measurements from the 4 individual measurement points in each classroom. The increasing teacher voice levels with increasing noise levels shown here, are an example of the Lombard effect. Lane and Tranel found a 0.5dB increase of speech level per 1dB increase of noise level [20] and Pearson’s found 1dB increase of speech levels per 1dB increase of noise level [21]. Fig. 13 shows a 0.75dB increase of speech level per 1dB increase of noise level.
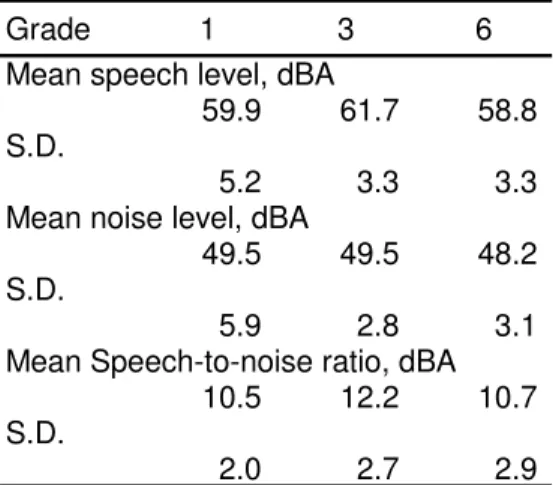
2. Variations of speech-to-noise ratios in active classes among grade levels Table 5 presents speech levels, noise levels and speech-to-noise ratios (SNR) averaged over the results for each grade level and obtained from recordings of teaching activities.There are not large differences between the results for the three different grades. The speech level and SNR of the grade 3 group is a couple of dB higher than the other grades because there was one especially loud voiced teacher in this group. The S.D. of SNR of grade 1 classes is smallest even though both the speech levels and noise levels for the grade ones have the largest standard deviations. This suggests that teachers of the grade 1 classes better controlled their voice level relative to the ambient noise level than the other teachers. As Fig. 13 demonstrated, speech and noise levels are correlated due to the Lombard effect. Grade 1 children may be distracted by noise more easily than older students and this may be evidence that teachers of the grade 1 students try harder to keep their attention by adjusting their voice levels to the ambient noise level.
3. Comparison of background noise levels in active classrooms with those in inactive classrooms
Fig. 14 shows the relation between noise levels in active classrooms and those in the same classrooms for quiet but occupied conditions. On average, in the active
classrooms, the noise generated by children increases the noise level by 5 dBA and the increases vary up to a maximum of 10 dBA relative to the occupied levels in the same classrooms without student activity.
There is an obvious trend in Fig. 14 for the student activity noise levels to increase with increasing ambient noise levels in the rooms without any student activity. This is another example of the Lombard effect. Most of the student activity noise was low level talking among the students. The level of this chatter increases with the general level of ambient noise in the room. That is, the children talk loud enough to be heard over the ambient noise from other sources such as heating and ventilating equipment or sounds from adjacent spaces. Thus reducing the ambient noise levels as measured in the unoccupied conditions is expected to also reduce the levels measured in active classrooms.
Student activity noise can also be reduced by controlling the student activities generating the noise. It is therefore very important that teachers appreciate the importance of controlling student activity noise when important information is to be orally
communicated. Since most of the noise from the students will arrive as direct sound or early reflections, adding sound absorbing material in the classrooms is not likely to be particularly effective for reducing student activity noise.
4. The combined effect of room acoustics and background noise
Useful-to-detrimental sounds ratios (U50(A)) values depend on both the speech-to-noise ratios and measured C50 values. Fig. 15 shows the distribution of A-weighted useful-to-detrimental sound ratios, U50(A) calculated from A-weighted C50 and A-weighted speech-to-noise ratios obtained during the recorded teaching activities. (The relation between C50(mid) and C50(A) is C50(A) = 0.98*C50(mid) + 1.9, r = 0.92, p < 0.001).
Fig. 16 shows the relationship between U50(A) values and SNR values. The scatter in the plot is due to room acoustics effects that are reflected in U50(A) values but not in
SNR(A) values. The grey triangles in Fig. 16 were measured in rooms in which T60 was
greater than 0.55s. These rooms had painted concrete ceilings and walls. Such relatively longer reverberation times cause the obvious reduction in U50(A) values by about 2 dBA relative to other rooms with similar SNR values. Because the results in the current analyses include only A-weighted SNR values obtained from the distribution technique, further work is required to obtain signal-to-noise ratios in octave bands and other
measures combining signal-to-noise ratios and room acoustics factors, such as the Speech Transmission Index [22].
The mean U50(A) value in these classrooms is expected to correspond to a 97% speech intelligibility score and a 24% listening difficulty rating measured using a rhyme test with young adult subjects [23]. Of course lower scores are expected for the young children in the current study and intelligibility scores will be presented in a second paper. Mean SNR(A) and mean U50(A) are 11 dBA and 8.4 dBA respectively.
5. Relationships between room acoustics factors, speech and noise levels
The measured speech levels of teachers in the active classes did not correlate significantly with ERB values (r = -0.085, n.s.). Speech levels were only weakly related to C50 values (r = -0.34, p<0.01.) and reverberation times (r = 0.48, p<0.01) because of the effect of reverberation time on late-arriving speech energy. These weak relationships are of course largely due to the limited range of acoustical conditions found in the measured classrooms. Similarly, noise levels were not related to ERB values and were
weakly correlated with C50 values(r = -0.24, p < 0.05) and reverberation times (r = 0.33, p < 0.01). The measured noise level can be predicted as 15.7 times the reverberation time plus 42.7dB. However, the r.m.s. error for the prediction of noise levels from
reverberation times is ± 4.11 dB and the correlation coefficient is small. This estimation is not practically useful.
Even though very short reverberation times are sometimes recommended [24] to control noise levels, the new results in this study suggest that values between 0.3 and 0.6 s have no significant effect on noise levels. That is, adding absorption would not be expected to reduce these noise levels. This indicates that noise levels are mostly due to the direct sound and early reflections from the noise sources.
This is illustrated by Fig. 5, which indicates that for a noise source, the direct sound and early reflections of the noise source would be dominant. Hence, adding
absorption to reduce the later-arriving sound will have little effect on the total noise level. In the classrooms, the late-arriving reflections of noise sources, as indicated by the low
Glate values, are not so important even though they are related to measured reverberation times. Noise control should be focused on the sources of the noise.
Fig. 5 shows how the early part of the sound energy (G50) decreases rapidly with increasing distance and how Glate values are more gradually reduced with increasing distance. It is therefore at larger distances that the detrimental late arriving speech sounds are most likely to interfere with the useful direct and early-reflected speech sounds. The result is seen in the rapidly decreasing C50 values with increasing distance shown in Fig. 9.
Determining an optimum reverberation time for a classroom must include consideration of a number of factors. Increased reverberation times will have a negative effect on speech intelligibility because of the related decreases in C50 values. At the same time increased reverberation times will lead to increased intelligibility because of the increasing levels of early arriving speech sounds (Fig. 6). In general such increases in reverberation times will have little effect on the ambient noise levels largely produced by the students and so the effective speech-to-noise ratios will increase with increasing reverberation times. However, at some point increasing reverberation times will lead to large increase in late arriving speech sounds and much larger Glate values. The
combination of these effects is best understood by calculating the related useful-to-detrimental sound ratios (e.g. U50(A)) that combine all of the important parameters influencing the expected speech intelligibility into a single measure. This is discussed in the following section.
6. Optimum reverberation time for classrooms
Classrooms are often designed to meet an optimum reverberation time goal. However, the calculated results in Fig. 5 illustrate, that ideal room acoustics for speech might be more directly achieved by designing to ensure that G50 values are sufficiently larger than Glate values at more distant listening positions in classrooms. The
intelligibility of speech is degraded when the late-arriving speech sound begins to mask the direct and early-arriving speech sounds. Sound absorption treatments should be designed to reduce late-arriving sound levels sufficiently at locations where students will
be located. Although late-arriving sound levels are related to reverberation times, they are also related to room volume and source-receiver distance.
Fig. 5 also shows that when students move closer to the teacher, the negative effects of reverberant sound are minimized. Moving closer does not reduce the
reverberation time; it reduces the relative importance of the late-arriving speech sounds that are detrimental to speech intelligibility. Practical application of this solution was found in the classrooms for the grade one students who frequently sat in a circle close to the teacher while the teacher talked to them.
Fig. 17 illustrates an approach to the acoustical design of classrooms that would aim to optimize conditions at a 6 m distance from the teacher. A 6 m distance is assumed to represent the more distant listening locations in a typical elementary school classroom. Fig. 17 shows how the early and late-arriving components of the speech level will vary with reverberation time for an average classroom. The calculations used the mean measured speech source level in classrooms (65.3 dBA), the mean level of background noise (49.1 dBA), the mean room volume (V = 198 m3) and the modified revised theory. The Figure also shows A-weighted useful-to-detrimental energy ratios (U50(A)). It was confirmed that the calculated A-weighted Gtotal was very similar to the mean measured
Gtotal at mid-frequencies from the data presented in Fig. 4.
The proposed design approach is to use information in the form of Fig. 17 to select the optimum reverberation time as the one that maximizes U50(A) values. U50(A) values are used because they combine the detrimental effects of late-arriving speech and ambient noise relative to the useful direct and early-reflected speech sounds. For the case of the average of the measured conditions, Fig. 17 suggests an optimum reverberation
time of about 0.3s. However, reducing the reverberation time to 0.2 s or increasing it to about 0.5 s only reduces U50(A) values by slightly over 1 dBA and hence near ideal conditions can be achieved over quite a broad range of reverberation time values. Of course this analysis ignores the benefit of early reflections to listeners who are not directly in front of the talker and for whom the direct sound would be diminished. For listeners located where the direct sound is reduced, more early reflected sound energy and hence somewhat increased reverberation times would be better. In no situation would T60
= 0 s be the optimum reverberation time and very short reverberation times should be avoided.
The reverberation time, which leads to the maximum useful-to-detrimental ratio, varies when speech and noise levels are changed. Lower background noise levels allow shorter reverberation times because adequate speech-to-noise ratios can be achieved with the help of less early-reflection energy. The optimum useful-to-detrimental ratio will also vary with varied voice level. The mean voice level measured in this study was 65.3 dBA. A lower speech level would shift the optimum U50(A) value to a longer reverberation time to increase the early sound component.
Although the concept illustrated in Fig. 17 may be clear, there are a number of details that need further investigation. The simple U50(A) measure used here assumes a particular combination of room acoustics and SNR values is best correlated with speech intelligibility scores. Other combinations might be more successful. Although one
previous study concluded that a simple abrupt boundary at 50 ms for early speech energy was appropriate [3], Lochner and Burger [25] originally proposed a more complex procedure for weighting the importance of early reflections to speech intelligibility. The
time window used to define ‘early-arriving’ sound needs further investigation. These initial analyses have been in terms of weighted speech and noise levels and A-weighted useful-to-detrimental sound ratios. Many studies have shown that using
frequency weightings more appropriate for speech intelligibility than A-weightings, leads to better relationships with speech intelligibility scores. Finally, Kobayashi et. al have suggested that a 55 dBA speech level can minimize listening difficulty ratings [26] and might indicate a preference for lower speech levels from teachers in classrooms if noise levels can also be lowered to maintain optimum SNR values.
V. Conclusions
In the measured classrooms, excessive noise levels were a much more significant problem than poor room acoustics. Even in unoccupied classrooms measured ambient noise levels were almost always greater than the 35 dBA recommend in ANSI S12.60. In active classrooms (i.e. while the teacher was teaching) the average measured noise level was 49.1 dB. Excessive noise levels make it impossible to achieve ideal signal-to-noise ratios and near ideal speech communication conditions. From various previous studies in classrooms (see the review in the Introduction) this is generally true for most classrooms. Student activity is the dominant noise source in active classrooms even when the children are quite well behaved. Student activity increases noise levels by an average of 5 dBA and as much as 10 dBA in some classrooms. The noise levels measured in active
classrooms are related to those in classrooms without student activities. That is, because of the Lombard effect the student noise, which is mostly due to talking, increases with the general level of ambient noise from other sources. Therefore, it is very important for unoccupied noise levels in classrooms to be very low. In addition, there is no evidence
that added absorption would decrease these noise levels. The measured noise levels in occupied classrooms are largely due to the direct and early-reflected sound from nearby student activity and can only be controlled at the source. It is therefore important that teachers appreciate the need to control student noise when important information is to be orally communicated.
Teachers’ voice levels were similar to those previously reported by Pearsons and the average measured teacher voice level would correspond to being between Pearsons’ categoreies for ‘Raised’ and ‘Loud’ speech for female talkers. Students experienced and average speech level of 60.4 dBA from teachers and there is clear evidence that teachers increase their voice level to overcome ambient noise as predicted by the Lombard effect. In these classrooms, effective speech levels are enhanced by early reflection energy. The new results give a better understanding of the inter-relationships of various room acoustic parameters in classrooms.
The measurements found an average mid-frequency reverberation time of 0.41 s and the reverberation times were about 10% greater in the unoccupied condition. By combining the occupied and unoccupied reverberations times it was possible to determine the average absorption per student in each octave band.
Detailed analyses of early and late-arriving sound levels showed that these could be quite accurately predicted by a modified version of Barron’s revised theory for sound levels in concert halls. The modifications are thought to adapt the theory to the acoustical conditions typical of the elementary school classrooms that were measured in this work.
Analyses of early and late-arriving sound levels also suggest that the room acoustics design of classrooms should aim to reduce late-arriving sound levels at more
distant listening positions to acceptable values that are well below the levels of the useful direct and early reflections of the speech sound. This would more directly ensure
optimum conditions for speech communication than designing for an optimum reverberation time.
REFERENCES
[1] M. Picard and J.S. Bradley, “Revisiting Speech Interference and Remedial Solutions in Classrooms”, Audiology, Journal of Auditory Communication, 40 (5) 221-244 (2001).
[2] T. Houtgast, “The Effect if Ambient Noise on Speech Intelligibility in Classrooms”, App. Acoust. 14, 15-25 (1981).
[3] J.S. Bradley, “Speech Intelligibility Studies in Classrooms”, J. Acoust. Soc. Am., 80 (3) 846-854 (1986).
[4] G. Iannace, L. Maffei, C. Ianniello and R. Romano, “Noise Problems In side Schools in Densely Built and Temperate Climate Urban Area”, Proceed. Inter Noise (2002). [5] A. Astolfi and V. Corrado, “Acoustical Quality Assessment of Italian School
Classrooms”, Proceed. Inter Noise (2002).
[6] M. Losso, E. Viveiros and T. Figueiredo, “An Overview of Acoustical Features in Brazilian School Buildings”, Proceed. Inter Noise (2004).
[7] H. Tachibana, K. Ueno and A. Aoki, “Study of Acoustical Conditions in Elementary Schools of Open-Plan Type in Japan, Part 1: Plan Features and Acoustic Properties of Schoolrooms”, Proceed. Inter Noise (2002).
[8] K. Nishizawa, J. Munakata and T. Sakuma, “Survey on Acoustic Environments for Hearing Impaired Students at Schools in Japan”, Proceed. 18th International Congress on Acoustics, Kyoto, Paper Tu2.B1.5, (2004).
[9] K. Ueno, H. Tachibana and A. Aoki, “Study of Acoustical Conditions in Elementary Schools of Open-Plan Type in Japan, Part 1: Observation of Classworks and
Inquiring Survey”, Proceed. Inter Noise (2002).
[10] E.E. Bowden, L.M. Wang and D. Bradley, “Classroom Acoustics in Omaha, Nebraska: Measurements and Outreach”, Proceed. First Pan-American/Iberian Meeting on Acoustics, Cancún (2004).
[11] Anon, “Acoustical Performance Criteria, Design Requirements, and Guidelines for Schools”, American National Standards Institute (ANSI) Standard S12.60 (2004). [12] Bradley, J.S., "An International Comparison of Room Acoustics Measurements
Systems", IRC Internal Report No. 714, National Research Council, Ottawa (January 1996).
[13] ISO3382, Acoustics — Measurement of the reverberation time of rooms with reference to other acoustical parameters, International Organisation for
Standardisation, Geneva, Switzerland (1998).
[14] Bradley, J.S., “Using ISO3382 measures, and their extensions, to evaluate acoustical conditions in concert halls”, Acoustical Science and Technology, 26 (2) 170-178 (2005).
[15] M. Barron and L-J. Lee, “Energy relations in concert auditoriums. I,” J. Acoust. Soc. Am., 84(2), 618-628 (1988).
[16] L. Gerald Marshall, “Speech intelligibility prediction from calculated C50 values,” J. Acoust. Soc. Am., 98(5), 2845-2847(1995).
[17] J.S. Bradley, H. Sato and M. Picard., “On the Importance of Early Reflections for Speech in Rooms”, J. Acoust. Soc. Am., 113 (6) 3233-3244 (2003).
[18] Barron, M., “Auditorium Acoustics and Architectural Design”, E. & FN. Spon, London, (1993).
[19] M. R. Hodgson, R. Rempel and S. Kennedy, “Measurement and prediction of typical speech and background-noise levels in university classrooms during lectures”, J. Acoust. Soc. Am., 105, 226-233 (1999).
[20] Lane, H. L., and Tranel B., “The Lombard sign and the role of hearing in speech”, J. Speech Hear. Res., (14), 677-709. (1971).
[21] Pearsons, K.S., Bennett, R.L. and Fidell,S., “Speech levels in various noise environments” (Report No. EPA-600/1-77-025). Washington (1977).
Summarised in: Olsen, W.O., “Average Speech Levels and Spectra in Various Speaking/Listening Conditions: A Summary of the Pearsons, Bennett, and Fidell (1977) Report”, Journal of Audiology, vol. 7, 1-5 (October 1998).
[22] Herman J. M. Steeneken , Tammo Houtgast, “Mutual dependence of the octave-band weights in predicting speech intelligibility,” Speech Communication 28(2), 109-123, (1999).
[23] Hiroshi Sato, John S. Bradley and Masayuki Morimoto, “Using listening
difficulty ratings of conditions for speech communication in rooms”, J. Acoust. Soc. Am., 117(3), 1157-1167 (2005).
[24] M.R. Hodgson and Eva-Marie Nosal, “Effect of noise and occupancy on optimal reverberation times for speech intelligibility in classrooms”, J. Acoust. Soc. Am., 111, 931-939 (1999).
[25] J.P.A. Lochner and J.F Burger, “The influence of reflections on auditorium acoustics”. J. Sound Vibr., 1 (4) 426-454 (1964).
[26] Masaaki Kobayashi, Masayuki Morimoto Hiroshi Sato and Hayato Sato,
“Optimum speech level to minimize listening difficulty in public spaces”, J. Acoust. Soc. Am., 121(1), 251-256 (2007).
TABLE I. Mean dimensions of the 30 classrooms and the number of children present.
Width, m Depth, m Height, m Floor
area, m2 Surface area, m2 Volume, m3 Number of student Average 9.3 7.7 2.8 71 236 198 20.6 S.D. 0.9 0.7 0.2 7.3 21.6 28.0 4.5 MAX 10.6 9.6 3.4 97 314 293 30 MIN 7.0 6.6 2.3 50 176 136 13
Width, m Depth, m Height, m Floor
area, m2 Surface area, m2 Volume, m3 Number of student Average 9.3 7.7 2.8 71 236 198 20.6 S.D. 0.9 0.7 0.2 7.3 21.6 28.0 4.5 MAX 10.6 9.6 3.4 97 314 293 30 MIN 7.0 6.6 2.3 50 176 136 13
TABLE II. Reverberation times (T60), early decay time (EDT), and early-to-late energy ratios (C50) for both occupied and unoccupied classrooms.
125 250 500 1k 2k 4k 0.5-1k, 2 oct. band Occupied
Mean reverberation time, s 0.57 0.49 0.43 0.37 0.36 0.38 0.41
S.D. 0.14 0.08 0.09 0.10 0.09 0.08 0.09
Mean early decay time, s 0.47 0.46 0.41 0.35 0.32 0.33 0.37
S.D. 0.17 0.13 0.12 0.11 0.11 0.11 0.10
Mean C50, dB 5.84 6.94 8.59 10.65 12.01 12.18 9.51
S.D. 3.51 2.71 2.34 2.66 2.81 2.64 2.26
Unoccupied
Mean reverberation time, s 0.59 0.51 0.46 0.42 0.41 0.42 0.45
S.D. 0.16 0.09 0.10 0.12 0.12 0.12 0.11
Mean early decay time, s 0.48 0.48 0.44 0.41 0.38 0.39 0.42
S.D. 0.18 0.14 0.13 0.13 0.13 0.12 0.12 Mean C50, dB 5.74 6.47 7.83 9.06 125 250 500 1k 2k 4k 0.5-1k, 2 oct. band Occupied
Mean reverberation time, s 0.57 0.49 0.43 0.37 0.36 0.38 0.41
S.D. 0.14 0.08 0.09 0.10 0.09 0.08 0.09
Mean early decay time, s 0.47 0.46 0.41 0.35 0.32 0.33 0.37
S.D. 0.17 0.13 0.12 0.11 0.11 0.11 0.10
Mean C50, dB 5.84 6.94 8.59 10.65 12.01 12.18 9.51
S.D. 3.51 2.71 2.34 2.66 2.81 2.64 2.26
Unoccupied
Mean reverberation time, s 0.59 0.51 0.46 0.42 0.41 0.42 0.45
S.D. 0.16 0.09 0.10 0.12 0.12 0.12 0.11
Mean early decay time, s 0.48 0.48 0.44 0.41 0.38 0.39 0.42
S.D. 0.18 0.14 0.13 0.13 0.13 0.12 0.12
Mean C50, dB 5.74 6.47 7.83 9.06 10.35 10.46 8.42
S.D. 3.69 2.52 2.30 2.77 2.96 2.67 2.38
Oct. band center frequency, Hz
7.83 9.06 10.35 10.46 8.42
S.D. 3.69 2.52 2.30 2.77 2.96 2.67 2.38
TABLE III. Mean measured sound absorption (m2) for occupied and unoccupied classrooms and the mean absorption per student from these measured values in the 27 classrooms. 125 250 500 1k 2k 4k 0.5-1k, 2 oct. band Occupied
Mean sound absorption, m2 57.5 65.8 75.4 89.6 90.8 86.1 79.5 Unoccupied
Mean sound absorption, m2 55. 8 63. 8 70. 6 80. 0 82. 4 79. 7 73. 7 Difference of sound absorption (Occupied-Unoccupied), m2
1.67 2.06 4.81 9.50 8.43 6.35 5.83 Sound absorption per child from mean sound absorption, m2/person
0.08 0.10 0.23 0.46 0.41 0.31 0.28 Oct. band center frequency, Hz
TABLE IV. Mean background noise levels in occupied classrooms without student activity and in unoccupied classrooms in each octave band along with the overall A-weighted noise levels for each condition.
Frequency, Hz 125 250 500 1000 2000 4000 A-weighted Occupied Mean 48.0 44.1 41.4 38.0 35.2 31.8 44.4 S.D. 5.9 4.1 3.7 3.6 3.3 3.2 3.5 Unoccupied Mean 47.1 42.2 39.7 36.0 31.7 27.0 42.2 S.D. 5.3 4.6 4.9 5.0 4.7 3.8 4.4
TABLE V. Average speech levels, noise levels and speech-to-noise ratios for each grade measured in an active class.
Grade 1 3 6
Mean speech level, dBA
59.9 61.7 58.8
S.D.
5.2 3.3 3.3
Mean noise level, dBA
49.5 49.5 48.2
S.D.
5.9 2.8 3.1
Mean Speech-to-noise ratio, dBA
10.5 12.2 10.7
S.D.
List of Figures: FIG. 1
The relationship between the sound absorption of the occupied classrooms and that of the unoccupied rooms in the 500 and 1k Hz double-octave band.
FIG. 2
The relationship between predicted Gdirect values for free field conditions with Q = 1.83 and measured Gdirect values in the classrooms. The least squares best fit regression line was given by, y=x (r = 0.99, r.m.s.=1.0).
FIG. 3
Ger (open circles) and Glate (filled triangles) as a function of source-receiver distance. Solid lines represent the least squares regression lines (r = 0.62 for Ger and r = 0.36 for Glate). The dashed lines are the predictions of Barron’s revised theory.
FIG. 4
Comparison of measured and predicted sound strength components, Ger, G50, Glate and
Gtotal using a modified version of Barron’s revised theory. The correlation coefficients r
and r.m.s. errors of the estimates are included in each panel of the Figure.
FIG. 5
Predictions of various components of sound strength, Ger, G50, Glate and Gtotal using the modified version of Barron’s revised theory presented as a function of source-receiver distance (d). V = 198m3
, T60 = 0.41s were used as the mean values for the measured
classrooms.
FIG. 6
Relationship between reverberation time and G50 for d =2, 4 and 6 m.
FIG. 7
Relationship between reverberation time and ERB for d =2, 4 and 6 m.
FIG. 8
The relationship between reverberation time and Glate values. FIG. 9
The relationship between reverberation time and C50 values.FIG. 10
Example frequency distribution of r.m.s. sound pressure levels of the recorded 200 ms segments and the fitting of two normal distributions to the data. The left part of the
distribution includes the predominantly noise segments (mean 43.6 dBA, S.D. 2.8) and right part the predominantly speech segments (mean 58.0 dBA, S.D. 6.7). Summation of both normal distributions is shown by the solid line and is seen to approximate the measured data.
FIG. 11
Frequency distributions of the speech and noise levels of 108 points in 27 active classrooms.
FIG. 12
Frequency distribution of mean speech–to-noise ratios for the 108 points in the 27 active classrooms.
FIG. 13
Relationship between room average teachers’ voice levels and noise levels during an active class. Each point is from the average of the measurements at the 4 microphone positions in each classroom.
FIG. 14
The relationship between noise levels in active classrooms and those in quiet but occupied conditions.
FIG. 15
Frequency distribution of U50(A) values from the 108 measurement points in 27 active classrooms
FIG. 16
Open-circles are measured points with T60 less than 0.5 s. Filled-triangles are for conditions with T60 < 0.55 s.
FIG. 17
between reverberation time and early speech level, late speech level, background noise level, detrimental sound energy level and U50.
y = x + 5.83 R = 0.97 0 20 40 60 80 100 120 0 20 40 60 80 100 120
Total sound absorption of
unoccupied classroom, m2 T o tal s o und abs o rp ti on of oc c u pi ed c las s room , m 2 y = x + 5.83 R = 0.97 0 20 40 60 80 100 120 0 20 40 60 80 100 120
Total sound absorption of
unoccupied classroom, m2 T o tal s o und abs o rp ti on of oc c u pi ed c las s room , m 2 FIG 1
FIG. 2
r = 0.99, r.m.s.=1.0
0
2
4
6
8
10
12
14
16
18
20
0
2
4
6
8 10 12 14 16 18 20
G(direct) in free field (Q=1.83), dB
M
e
as
ur
e
d
G
(d
ire
c
t)
in c
lass
roo
m
s
, dB
r = 0.99, r.m.s.=1.0
0
2
4
6
8
10
12
14
16
18
20
0
2
4
6
8 10 12 14 16 18 20
G(direct) in free field (Q=1.83), dB
M
e
as
ur
e
d
G
(d
ire
c
t)
in c
lass
roo
m
s
, dB
25
0
5
10
15
20
0
2
4
6
8
Distance, m
G
x(0
.5
-1
k
H
z),
d
B
G
erG
latePrediction of G
erPrediction of G
lateRegression
Regression
25
0
5
10
15
20
0
2
4
6
8
Distance, m
G
x(0
.5
-1
k
H
z),
d
B
G
erG
latePrediction of G
erPrediction of G
lateRegression
Regression
FIG. 3FIG. 4 5 10 15 20 5 10 15 20 Predicted, dB M e as ur ed , dB y = x r = 0.99 r.m.s. = 1.19 Ger 10 15 20 25 10 15 20 25 Predicted, dB M e as ur ed , dB y = x r = 1.0 r.m.s. = 1.00 G50 10 15 20 25 10 15 20 25 Predicted, dB M e as ur ed , dB y = x r = 1.0 r.m.s. = 1.00 G50 10 15 20 25 10 15 20 25 Predicted, dB M e as ur ed , dB y= 0.97x R = 0.99 r.m.s. = 1.06 G(total) 10 15 20 25 10 15 20 25 Predicted, dB M e as ur ed , dB y= 0.97x R = 0.99 r.m.s. = 1.06 G(total) 10 15 20 25 10 15 20 25 Predicted, dB M e as ur ed , dB y= 0.97x r = 0.99 r.m.s. = 1.00 Gtotal 10 15 20 25 10 15 20 25 Predicted, dB M e as ur ed , dB y= 0.97x r = 0.99 r.m.s. = 1.00 Gtotal 0 5 10 15 0 5 10 15 Predicted, dB M e as ur ed , dB y = x r = 1.0 r.m.s. = 1.49 Glate 0 5 10 15 0 5 10 15 Predicted, dB M e as ur ed , dB y = x r = 1.0 r.m.s. = 1.49 Glate
0
5
10
15
20
25
0
1
2
3
4
5
6
7
8
9
10
Distance, m
Gx
(0.5-1kHz), dB
G
direct, Q=1.85
G
erG
50G
lateG
total0
5
10
15
20
25
0
1
2
3
4
5
6
7
8
9
10
Distance, m
Gx
(0.5-1kHz), dB
G
direct, Q=1.85
G
erG
50G
lateG
total FIG. 510 12 14 16 18 20 22 0.0 0.2 0.4 0.6 0.8 1.0 Reverberation time, s G50 , d B 2m 4m 6m 10 12 14 16 18 20 22 0.0 0.2 0.4 0.6 0.8 1.0 Reverberation time, s G50 , d B 2m 4m 6m 2m 4m 6m FIG. 6
0 2 4 6 8 10 12 0.0 0.2 0.4 0.6 0.8 1.0 Reverberation time, s ER B, d B 6m 4m 2m 0 2 4 6 8 10 12 0.0 0.2 0.4 0.6 0.8 1.0 Reverberation time, s ER B, d B 6m 4m 2m 6m 4m 2m FIG. 7