Publisher’s version / Version de l'éditeur:
Coastlab 2012 : 4th International Conference on the Application of Physical
Modelling to Port and Coastal Protection Book of Abstracts, 2012-10-01
READ THESE TERMS AND CONDITIONS CAREFULLY BEFORE USING THIS WEBSITE. https://nrc-publications.canada.ca/eng/copyright
Vous avez des questions? Nous pouvons vous aider. Pour communiquer directement avec un auteur, consultez la première page de la revue dans laquelle son article a été publié afin de trouver ses coordonnées. Si vous n’arrivez pas à les repérer, communiquez avec nous à [email protected].
Questions? Contact the NRC Publications Archive team at
[email protected]. If you wish to email the authors directly, please see the first page of the publication for their contact information.
NRC Publications Archive
Archives des publications du CNRC
This publication could be one of several versions: author’s original, accepted manuscript or the publisher’s version. / La version de cette publication peut être l’une des suivantes : la version prépublication de l’auteur, la version acceptée du manuscrit ou la version de l’éditeur.
Access and use of this website and the material on it are subject to the Terms and Conditions set forth at
3D hydraulic model studies of pipeline secondary stabilization
measures
Baker, Scott; Cornett, Andrew; Knox, Paul
https://publications-cnrc.canada.ca/fra/droits
L’accès à ce site Web et l’utilisation de son contenu sont assujettis aux conditions présentées dans le site LISEZ CES CONDITIONS ATTENTIVEMENT AVANT D’UTILISER CE SITE WEB.
NRC Publications Record / Notice d'Archives des publications de CNRC:
https://nrc-publications.canada.ca/eng/view/object/?id=45349460-4e14-45ef-bf00-432d65ffabff
https://publications-cnrc.canada.ca/fra/voir/objet/?id=45349460-4e14-45ef-bf00-432d65ffabff
3D HYDRAULIC MODEL STUDIES OF PIPELINE SECONDARY
STABILIZATION MEASURES
SCOTT BAKER (1), ANDREW CORNETT (2) & PAUL KNOX (3)
NRC – Ocean, Coastal & River Engineering, 1200 Montreal Road, Bldg. M-32, Ottawa, K1A 0R6, Canada
(1) [email protected] (2) [email protected]
Abstract
A 3D physical modelling campaign has been conducted to support the efficient and reliable design of secondary stabilization measures for subsea pipelines to be installed as part of the Browse LNG project. Many different secondary stabilization designs were assessed including static and dynamically re-shaping rock berms, gravity anchors, and V-shaped trenches. Modelled rock berm structures were constructed underwater to simulate prototype construction by fallpipe. This study generated a large amount of data and new information concerning the behaviour and reliability of pipeline stabilization measures in shallow water under extreme short-crested waves and currents.
1. Introduction
Pipelines lying on the seabed are subject to forces imposed by hydrodynamic activity. A cyclone passing over a pipeline will generate waves that will exert lift and drag forces on the pipeline, and near-bottom currents will impose additional hydrodynamic forcing. If the submerged weight and frictional resistance between the pipeline and the seabed is too low, the pipeline will move, which could have numerous problematic consequences.
There are two general methods to prevent pipeline movement due to hydrodynamic forcing: primary and secondary stabilization. Primary stabilization methods are techniques that raise the frictional resistance between the pipeline and the seabed by increasing the submerged weight of the pipeline, most often accomplished by adding a concrete armouring coat to the pipeline. Secondary stabilization methods shelter the pipeline from some or all hydrodynamic forcing. This can be accomplished by lowering the pipeline into trenches, using gravity anchors to restrict motion, or dumping rock to cover the pipeline. Each of these alternative approaches bears its own pros and cons in the real world, and provide some unique challenges to the modeller concerned with accurately simulating their performance in a physical model.
Previous research dealing with submerged pipelines has mainly been undertaken in 2D flumes, with some studies only considering the effect of regular waves, and many excluding the effect of currents. In many studies, pipeline models are only oriented perpendicular to the flume, and relatively small scale models are used. Nearly all previous research considers either statically stable rubble mound protection or complete burial of submerged pipelines.
The present study offers several unique aspects. A range of alternative secondary stabilization measures, including rock berms, trenching and gravity anchors, have been modelled and assessed over a wide range of water depths using extreme short-crested waves and non-collinear currents. The angle between the pipeline and the wave and current forcing
was also varied over a wide range. The rock berm models were constructed under water to simulate prototype construction by fallpipe, and many dynamically stable, but statically unstable, rock berm designs were modelled and assessed.
2. Project Background
The Browse LNG development is located approximately 400 km off the Western Australia coast. The development concept includes three floating gas and liquids platforms, an offshore central processing facility (CPF), and onshore facilities for liquid natural gas production and export. These facilities are linked by an extensive network of subsea pipelines, including a 350 km long 42” export pipeline from the CPF to shore.
The water depths along the pipeline route from the CPF to shore vary from approximately 110 m near the CPF to approximately 10 m near shore. Extreme wave conditions and near-bed velocities have been calculated along the pipeline route for various return periods. The design wave conditions for these waters are generated by intense tropical cyclones passing through or near to the area. Extreme seastates generated by intense local cyclones generally feature very steep waves and a moderate to high degree of directional spreading. The design wave conditions associated with a particular return period vary somewhat over the project area, depending on the local water depth and other factors, but include significant wave heights in excess of 17 m and peak periods up to ~17 s.
The extreme steady currents along the pipeline route (due to wind and tide) generally vary over the range of 0.7 – 2.3 m/s, depending on location, water depth and return period. Significant near-bed velocities (due to the combined effect of significant waves plus wind plus tide) in excess of ~4 m/s are expected.
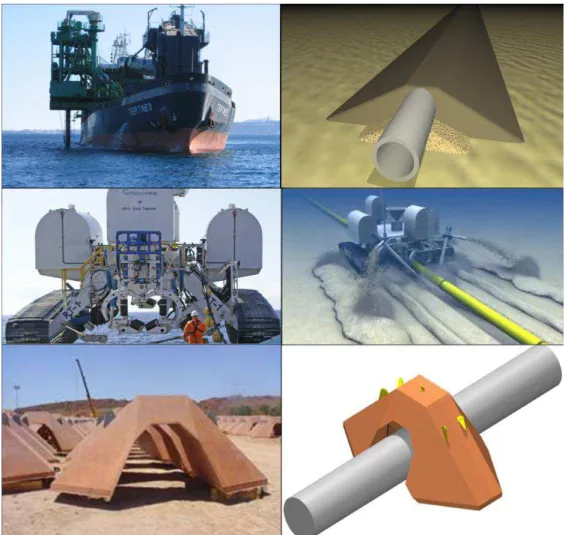
2.1 Proposed Stabilization Measures
Preliminary analyses indicated that substantial secondary stabilization of the Browse pipelines would be required. Among the methods being considered were rock berms of various types and sizes, gravity anchors, and trenching (see Figure 1). Physical modelling was subsequently used to help select the most appropriate approach for each part of the pipeline route and to help refine and optimize the design of the various stabilization measures. It is likely that a combination of two or perhaps all three of these general approaches may be used at various locations along the pipeline routes, depending on the local water depth, the seabed properties, and the performance and economics of each alternative.
In many locations, pipeline will be laid directly on the seabed and protected by a rock berm. In order to facilitate placement by fallpipe, the full scale rock material should have a maximum size (D100) smaller than 400 mm to prevent clogging of the pipe. Economic
considerations emphasized the importance of minimizing rock volumes and rock sizes as much as possible. Hence, numerous berm sizes and rock sizes were tested throughout the physical modelling study. In other locations, pipeline might be laid in a V-shaped trench dredged into the seabed by a trenching machine. Several trench depths were tested for two pipeline sizes during the modelling study. Pipelines can also be stabilized by fabricating and installing gravity anchors, which are special concrete blocks designed to straddle the pipeline and prevent it from moving under hydrodynamic forcing. The gravity anchors must have sufficient mass for self stability, and must have sufficient reserve stability to resist any additional forcing transmitted through the pipelines. Five alternative gravity anchor designs were modelled and assessed during the study.
Figure 1. Examples of secondary stabilization measures: rock dumping, trenching and gravity anchors.
3. Physical Modelling General Approach
Three-dimensional simulations of the extreme metocean conditions (irregular short-crested waves and non-collinear current) and the behavior of the proposed pipeline stabilization measures were undertaken in the Multidirectional Wave Basin (MWB) facility of the National Research Council Canada, at a geometric scale of 1:40. The modelling was conducted in a manner such that the real-world behavior of the stabilization measures could be extrapolated from their behavior in the physical model with as little uncertainty as possible. Similitude of the Froude number, which represents the relative magnitude of gravitational and inertial forces, was used to convert quantities measured in the model to full scale values.
The MWB consists of a 30 m by 36 m by up to 3 m deep rectangular wave basin, where a wide range of regular, irregular and multi-directional wave conditions can be generated using a powerful and flexible 60-segment wave generator. Highly efficient dissipative wave
absorbers are installed around the perimeter of the basin to control unwanted wave reflections, thereby enhancing the quality and realism of the simulated sea states.
A sloping (1:200) concrete sub-floor was constructed to represent typical seabed conditions along the pipeline routes. This sub-floor was built above a short 1:20 slope leading down to the wave generator. The extra water depth at the wave machine made it possible to generate the high and steep shallow water waves required for this study. For some wave directions, the quality of the waves at the test site was also improved by purposely reflecting waves from wave guides installed at either end of the wave machine.
Non-collinear currents were generated by using variable-speed thrusters to force water to flow through a series of tunnels installed below the sub-floor. This forced a circulation within the basin above the tunnels that could be adjusted by regulating the speed (rpm) of the thrusters. A rectangular test area with approximate dimensions of 6 m by 9 m was established on the mildly sloping sub-floor above the tunnels were reasonably uniform waves and currents could be obtained. Different water depths were simulated by varying the water level in the basin.
3.1 Calibration of Waves and Currents
Undisturbed wave tests were conducted to obtain and verify the wave machine command signals required to produce the desired wave conditions at the test site, and to measure the wave properties in the absence of current. An iterative procedure was followed to obtain command signals that were tuned so that spatially averaged conditions around the test site were in excellent agreement with specifications.
Undisturbed current tests were performed to determine rating curves describing the relationship between the thruster setting and the resulting current velocity at the test site for each water depth, without waves. The rating curves were then used to determine the thruster setting required to generate a particular current at the test site. The resulting current field was neither perfectly steady nor perfectly uniform, since natural turbulent fluctuations and unsteady eddies were observed whenever the current system was running. However, the time-averaged near-bed velocities were in good agreement with specifications.
Nine high-precision capacitance wave gauges and six current meters (three electromagnetic velocimeters and three acoustic Doppler velocimeters) were installed and continuously monitored to measure wave conditions and near-bed velocities across the test area during all tests. The instruments were suspended from a support frame that was erected to span the test area without interfering with the waves or currents.
3.2 Model Setup
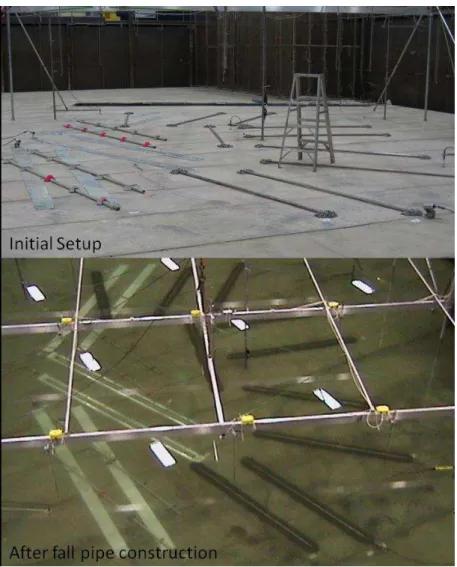
Multiple (up to sixteen) different models were usually tested at the same time. Tests were conducted wherein a cluster of model structures were exposed to a sequence of metocean conditions that became progressively more severe over time. The models were distributed over the rectangular test area and each model represented a length of pipeline (typically 2.4 m long in the model) fit with one of the stabilization measures under investigation (see Figure 2).
All tests involving model structures were performed with currents and waves acting together. The metocean conditions were scaled reproductions of the design currents and design waves that had been established for each water depth along different parts of the pipeline route. When the waves and currents were generated together, due to the interaction between them, the wave conditions and currents realized at the test site differed from what was achieved when each was generated independently, as expected. It is important to consider this
wave-current interaction process when specifying flow conditions for use in a physical model study and when tuning/calibrating the flow conditions. Nine wave gauges and six current meters were used to monitor the combined wave-current flows across the test site. Three underwater video cameras were used to observe the response of the models during testing. These cameras provided valuable insight into the mechanisms responsible for the movement of rock material on various structures, and in some cases for the displacement of pipelines. An underwater video survey of every model structure was conducted after each storm event using a submersible video camera fixed to the end of a pole held by an operator. A small video screen was mounted on the pole so that the operator could view the camera output.
Figure 2. Typical test series model setup with gravity anchors, trenches and rock berms.
Throughout the course of the modelling campaign, a total of 297 model structures were modelled and assessed in 21 separate test series. Each model structure represented a particular secondary stabilization alternative, at a particular orientation relative to incident waves and
currents, at a particular water depth. More than 250 rock berm structures were tested, representing nearly 27 km of full scale pipeline. More than 4,250 kg of model rock material (272,000 tonnes at full scale) was placed using the fallpipe construction method.
4. Construction of Model Structures 4.1 Preparation of Model Pipelines
Two different pipeline sizes (with prototype outer diameters of 1,270 and 635 mm, respectively) were simulated in these studies, represented by lengths of sealed pipe selected and prepared to replicate the outside diameter and submerged weight of the prototype pipelines, including the concrete weight coating. Steel rod was used for ballast, held firmly in place at the center of the pipeline by foam plugs inserted approximately every 30 cm inside the pipe. Fine silica sand with a particle diameter of ~0.2 mm was applied to the surface of the pipeline in order to simulate marine growth on the external concrete coating.
Since freshwater was used in this study to represent seawater, the model pipelines were designed and fabricated to have the same submerged stability in freshwater as the prototype units would have in typical seawater. This was accomplished by decreasing the density of the model pipelines compared to their prototype counterparts.
4.2 Rock Berm Structures
Numerous rock berm designs were tested in order to assess the influence of the many parameters that can influence the stability, performance and/or cost of this type of stabilization:
Size of rock, denoted by the median diameter D50;
Density of rock, ρa;
Gradation of the rock material; Diameter or size of the pipeline; Density of the pipeline;
Nominal width of the berm crest, W; Nominal height of the berm, h;
Volume (V), or weight of rock material per meter; Symmetry and uniformity of rock material placement; Orientation of the pipeline relative to the waves and currents.
Model rock materials and gradations were prepared to replicate the characteristics of the prototype materials under consideration for use in construction. Three different rock densities (2.49, 2.65 and 3.01 g/cm3) were used in the model study. The raw materials were sieved and
the particles retained on each screen were stored in separate stockpiles. The specific rock gradations to be used in constructing the model structures were prepared by blending together pre-calculated quantities (by weight) from each pre-sorted stockpile. Bulk density checks were performed on several occasions, and the measured bulk densities were used as a basis to calculate the weight of material required to construct each model rock berm.
Representative structures were carefully hand-built in dry conditions using templates, and the amount of material required to build the structure was precisely measured. A comparison of the weight required to build the structure by hand versus theoretical calculations based on bulk density revealed that hand-built structures tended to be slightly heavier due to unintentional packing of material.
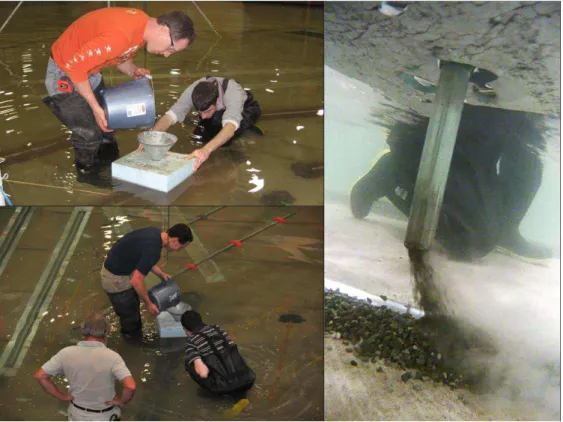
Construction by fallpipe would yield more realistic and representative rock berm structures, and therefore a method was devised to accurately simulate this process in the physical model (see Figure 3). A simple model scale fallpipe device, consisting of a funnel feeding a vertical pipe suspended from a float was used to place all rock materials in this study. The fallpipe diameter was approximately 1 m at full scale, and the lower end of the pipe was located approximately 5 m (full scale) above the seabed.
The volume of rock material required for each structure was pre-determined (by weight) and set aside in buckets. Two operators were involved in the material placement: one guided the fallpipe “vessel” from above water, while the other gradually fed material into the funnel. All the material was placed in several passes in order to achieve a nearly uniform distribution along both sides of the model pipeline. This method of placement produced rock berms which had slightly irregular cross-sections that were generally wider and had shallower side slopes than idealized design sections constructed in the dry. These structures were quite representative of real-world conditions.
Figure 3. Example of fallpipe construction method for rock berms.
4.3 Preparation of Model Gravity Anchors
The stability of five gravity anchor designs was investigated in some tests by observing the stability/mobility of the model gravity anchors straddling a length of model pipeline. Scaled replicas of five different types of gravity anchor were fabricated with moulds using non-shrink concrete grout which was infused with lead-shot to achieve the desired density.
To investigate self-stability of the various anchors, one gravity anchor of each type was placed over a single length of pipeline that was securely fixed to the floor. To encourage instability, one corner of each gravity anchor rested on a small nut glued to the floor on the upstream side of the pipe, simulating the potential real world situation in which the gravity anchor would sit perched on a protruding rock. To investigate the stability of the anchors including the influence of the pipeline, several gravity anchors of one type were distributed evenly along a single length of pipeline that was tethered by a string to the floor, allowing it some range of motion. The initial position of each gravity anchor as well as the initial position of the pipeline was marked on the floor to facilitate visual assessment of movement.
4.4 Preparation of Pipeline Trenches
The option of laying a pipeline in a narrow V-shaped trench without rock material cover was investigated in several test series. Six 3.66 m long rectangular slots were cut into the bathymetry inside the test area, two each at three different orientations relative to the incident current. These slots were filled with sheet metal inserts representing V-shaped trenches of varying depths. Thin metal plates were used to cover the trenches when not in use.
Five different trench depths were modelled, representing partial, intermediate and full depth trenches for the two pipeline sizes considered in the study. These trench depths simulated different scenarios where the rock trenching machine could not achieve the full depth of cut as desired. Since only three of the pipeline-in-trench models could be monitored by underwater video cameras at any time, a simple tell-tale system involving a brightly-coloured tether was developed to indicate whether the pipeline model was temporarily or permanently displaced by the wave-current forcing.
5. Classification of Damage
The acceptance criteria defined by the client was as follows: rock berms should remain dynamically stable even after the 1,000-year event, entrenched pipelines should remain in their trench, and gravity anchors should remain stable while limiting pipeline movement. Unlike breakwater structures, there is no universally accepted definition of damage appropriate for submerged rock berms. Hence, it was necessary to develop a suitable classification system to assess the performance of the various rock berm structures that were modelled.
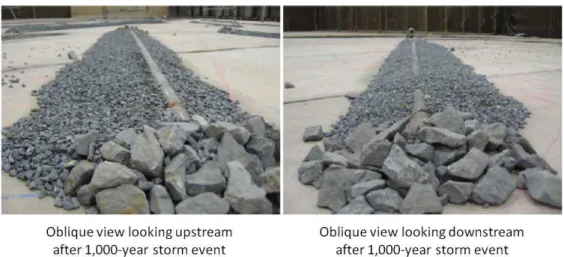
The assessment of damage relied heavily on photographic and video analysis, backed by visual observations during testing (see Figure 4). Re-shaping of the rock berm and loss of rock material were tolerated, so long as the volume of rock material surrounding the pipeline remained sufficient to prevent pipeline movement. In general, the rock berms were judged to be acceptable even when the crown of the pipeline became exposed after the design event. Rock berm designs that were found to be overly stable were typically optimized to reduce rock size, rock density and/or rock volume.
6. Results and Observations
Analysis of the rock berms after fallpipe construction revealed that some over-dump of material was required to conform to rock berm construction specifications (1:3 side slopes with rock adjacent to the pipeline reaching the crown level).
A range of rock berm designs that were dynamically stable (but statically unstable) under design conditions were developed and verified for the various water depths along the pipeline route. The optimization typically involved minimizing rock size, rock density, rock volume, or
all three parameters. For the “optimized” designs, the rock berm initially formed by fallpipe construction was re-shaped by the hydrodynamic forcing such that streamlined wedges of rock were formed on both sides of the pipeline (see Figure 4). A net migration of material from the upstream side to the downstream side of the pipeline was commonly observed, and a small portion of the rock material was typically removed from the berm entirely.
Dynamically stable rock berm solutions using rock material that could be installed by fallpipe methodwere developed for the larger pipeline in all water depths; however, the initial volume of material varied with the intensity of the near-bottom kinematics. For some depths, slightly larger rock material was required to ensure adequate stability for the smaller pipeline, due to the lower berm profile. The denser rock material was found to be more stable, while the less dense rock was found to be less stable, as expected. The rock sizes and rock volumes could be reduced in deeper water as expected.
For pipelines located in trenches, when the pipeline axis was approximately collinear with the incident wave direction, lift forces were only generated over a small area at a time and thus the pipelines rarely moved. However, when the pipeline axis was approximately perpendicular to the incident wave direction, lift forces could act against longer sections at a time, and pipelines were more prone to failure by lift-out. As expected, pipelines in reduced depth trenches were more prone to failure compared to those in full depth trenches.
Gravity anchors with a lower profile tended to be more stable than those with a higher profile, and as expected, denser units had a greater self-stability. The required unit spacing to achieve minimal pipeline movement was found to be highly dependent on the local depth and storm conditions.
Figure 4. Typical damage analysis photographs collected after each test series.
7. Conclusions
Innovative methods to accurately model and assess the performance of several different approaches to pipeline secondary stabilization have been developed in the course of conducting this unique study. The instrumentation setup allowed for the reliable and accurate measurement of wave and current forcing with minimal interference. The use of real-time underwater video monitoring provided valuable insight into the movement of rock material, rock berm re-shaping, and pipeline lift-out. The fallpipe construction method was shown to
deliver a more authentic model structure which leads to more realistic simulations and more reliable performance assessments. A new classification system was developed to categorize and help assess the performance of dynamically re-shaping rock berms. These tests have generated a large amount of data and new information concerning the behaviour and reliability of secondary pipeline stabilization measures in shallow water under extreme short-crested waves and currents.
References
Baker & Cornett (2011). ‘3D Hydraulic Model Studies of Pipeline Stabilization Measures for the Browse Project’, NRC-OCRE Controlled Report, Ottawa.
Damgaard & Whitehouse (1999). ‘Evaluation of Marine Pipeline On-Bottom Stability’. Pipeline
and Gas Journal, (226), Number 3 & 4.
Hinwood & Lipski (2002). ‘Failure Modes of Rock Berms for Offshore Pipeline Protection’, Proc.
12th International Offshore and Polar Engineering Conference, Kitakyushu, Japan.
Jayewardene, Modra, Campbell & Chamizo (2011). ‘2D and 3D Physical Modelling of Current and Wave Interactions for Rock Berm Design’. Proc. Coasts and Ports 2011, Australia. Lomónaco (1994). ‘Design of Rock Cover for Underwater Pipelines’. MSc Thesis, Delft
University of Technology, Netherlands.
Lomónaco & Klomp (1997). ‘Pipeline cover damage assessment’. Proc. 8th International
Conference on the behaviour of offshore structures, Delft, The Netherlands.
Lomónaco, Vidal, Revilla & Losada (2002). ‘Flow and pressure distribution around rubble mound protected pipelines’. Proc. 2nd International Conference on Marine Waste Water
Discharges, Istanbul, Turkey.
McDougal, Mizutani & Mostafa (1998). ‘Nonlinear wave forces on a rubble covered pipeline’.
Proc. 26th International Conference on Coastal Engineering, Copenhagen, Denmark.
Neelamani & Al-Banaa (2012). ‘Wave force variation due to burial of submarine pipelines in uniformly graded and low hydraulic conductivity soil’. Journal of Applied Ocean Research (35), pp 47-55.
Tørum, Arntsen & Kuester (2010). ‘Stability against waves and currents of gravel rubble mounds over pipelines and flat gravel beds’. Proc. 32nd International Conference on Coastal
Engineering, Shanghai, China.
Van den Bos (2006). ‘Design of granular near-bed structures in waves and currents’. MSc Thesis, Delft University of Technology, Netherlands.
Vidal, Lomónaco & Martin (2002). ‘Prototype analysis of stability of rubble mound protections for submarine outfalls’. Proc. 28th International Conference on Coastal Engineering, Cardiff,
Wales.
Vijaya kumar, Neelamani & Narasimha Rao (2003). ‘Wave pressures and uplift forces on and scour around submarine pipeline in clayey soil’. Journal of Ocean Engineering (30), pp 271-295.
Zeitoun et al. (2009). ‘Advanced dynamic stability analysis’. Proc. 28th International Conference on