An Analysis of Motor Vehicle Assembly Plant Complexity:
Developing a Framework to Evaluate the Existence of a Complexity Threshold By
Matthew J. Hasik
Bachelor of Science in Civil and Environmental Engineering, Duke University, 1998 Master of Science in Mechanical Engineering, Duke University, 1999
Submitted to the Sloan School of Management and the Department of Civil and Environmental Engineering in Partial Fulfillment of the Requirements for the Degrees of
Master of Business Administration and
Master of Science in Civil and Environmental Engineering in conjunction with the Leaders for Manufacturing Program at the
Massachusetts Institute of Technology, June 2006
D 2006 Massachusetts Institute of Technology. All Rights Reserved.
Signature of Author .* Matthew J. Hasik
Sloan School of Management Department of Civil and Environmental Engineering May 1, 2006 Certified by
Stephen C. Graves, Thesis Advisor Abraham Siegel Professor 9f Management Certified by
SRaIddolph
E.Kirchain,
Jr., Thesis Advisor Assistant Professor, Materials Science & Engineering and Engineering Systems Division Certified byj2ynthia Barnhart, Thesis Reader Professor of Civ Anviqok1mentaj Engineering Accepted by
~7-.
V V "L41I' .WhittleChairman, Departmental Committee on Graduate Students, Civil and Environmental Engineering
Accepted by
Debbie Berechman Executive Director, Sloan MBA Program
MASSACHUSETTSRIS1TTfEOF TECHNOLOGY
JUN 0 7 2006
BARKER
An Analysis of Motor Vehicle Assembly Plant Complexity:
Developing a Framework to Evaluate the Existence of a Complexity Threshold
by Matthew J. Hasik
Submitted to the Sloan School of Management and the Department of Civil and Environmental Engineering on May 12, 2006 in Partial Fulfillment of the Requirements for the Degrees of
Master of Business Administration and
Master of Science in Civil and Environmental Engineering
Abstract
An automotive manufacturer facing decreasing average product volumes as a result of market
fragmentation while simultaneously reducing its manufacturing plant footprint must adapt to the difficult challenge of increased product mix within its manufacturing system. The increase in complexity resulting from greater product mix is considered to be a significant driver in increasing plant investment cost and reducing plant operating effectiveness. Thus, the ability to fully understand and more effectively balance the complexity trade-offs associated with different product-to-manufacturing plant allocation scenarios is critically important, as the manufacturer formulates its strategy and analyzes the associated costs and benefits. The ultimate question to be addressed is whether there exists a "complexity threshold" in terms of the maximum number of differentiated body styles (unique vehicle models) to be produced inside a single assembly plant.
This thesis analyzes the challenge of manufacturing system and plant complexity by first developing a competitive benchmark study of body-style complexity at the major North American OEMs' plants. Then, manufacturing and operations data is analyzed for evidence of a "complexity threshold" in one manufacturer's operations. Finally, a linear-program based optimization model is developed to enable a Manufacturing Planning group to better understand the company's tolerance for plant complexity by quantifying manufacturing costs associated with various product-to-manufacturing plant allocation scenarios. This tool enables the planner to simultaneously consider thousands of different possible combinations of which products to produce in which plants, by analyzing manufacturing investment and per-vehicle operating cost estimates for each combination. The ability to impose constraints on the maximum number of body styles produced at any one plant yields insight on the value of pursuing a higher-mix (in terms of body styles) manufacturing strategy in particular plants, or across the entire plant footprint.
Thesis Supervisor: Stephen C. Graves
Title: Abraham Siegel Professor of Management Thesis Supervisor: Randolph E. Kirchain, Jr.
Table of Contents
Abstract ... 2
A cknow ledgem ents... 5
A cknow ledgem ents ... 5
Biographical N ote ... 6
Introduction & Problem context ... 7
Literature Review ... 9
D efinitions of Com plexity... 9
Product Variety, Option Variability, and Impact on Manufacturing Operations ... 11
Evaluating Com plexity... 13
Flexibility and Com plexity... 14
A Question of Com plexity: H ow m any vehicles to build in one plant?... . . .. . .. . .. . .. . .. .. . .. . . 15
Research M ethodology ... 16
Analysis, Part I: Competitive Benchmark of North American OEM Assembly Plant Complexity ... 17
Introduction & Background... 17
Honda's H igh-M ix M anufacturing Strategy... 23
Detail-level V ehicle Content ... 25
Inside the Plant: Operational and Strategic D ifferences ... 30
A Transitioning Marketplace: Increased Product Proliferation, Falling Average Volumes, and Lessons from the European Passenger Car M arket ... 32
Analysis, Part II: Developing Insight on the Existence of a Complexity Threshold in High-Mix Autom otive A ssem bly Plants...33
Introduction ... 33
Challenges of H igher-Com plexity A ssem bly ... 34
Addressing the Idea of a Com plexity Threshold ... 35
Part A : Analysis of a M anufacturer's Operating Data... 36
Part B : M odeling ... 37
M odel N otation ... 39
M odel Form ulation... 39
M odel Form ulation...40
M odel D escription...40
D iscussion of M odel Form ulation... 41
An Exam ple M odel - Optim ization Scenario ... 42
Shadow Price Analysis...44
Tolerance of A dded Com plexity-Driven Operating Costs... 44
Suggested Future Model Extension: Effects of Uncertainty in Volume Estimates on Manufacturing Strategy and Plant Com plexity Evaluation ... 45
Learnings...46
Conclusions...47
List of Tables and Figures
Table 1: Study of European Passenger Car Platforms, Body Styles, and Volumes (1990-2002)...7
Figure 1: European Passenger Car Market: Platforms, Body Styles, and Volumes 1990-2002 ... 8
Figure 2: Simple Bar Chart Complexity Scale, NA Passenger Car Plants ... 20
Figure 3: Simple Bar Chart Complexity Scale, NA Truck-Van-SUV Plants ... 21
Figure 4: Plant View of Product Complexity, NA Passenger Car Plants ... 22
Figure 5: Plant View of Produce Complexity, NA Truck-Van-SUV Plants...23
Figure 6: Honda's NA Manufacturing Strategy (Passenger Car) -- Recent Model Changes ... 24
Figure 7: Honda's NA Manufacturing Strategy (Passenger Car) -- Future Model Changes... 24
Figure 8: Platforms and Body Styles per Plant, by NA Manufacturer... 25
Figure 9: Vehicle Content Comparison -- Small Car Segment...26
Figure 10: Vehicle Content Comparison -- Mid-Size Car Segment ... 27
Figure 11: Vehicle Content Comparison -- Luxury Car ... 27
Figure 12: Option Content Analysis -- Small Car Segment...28
Figure 13: Option Content Analysis -- Mid-Size Car Segment ... 29
Figure 14: Option Content Analysis -- Luxury Car Segment ... 29
Figure 15: Sub-Assembly Operations Performed Inside OEM Plants...31
Table 2: Comparison of North American and European Automotive Market Characteristics ... 32
Acknowledgements
I would like to recognize the contributions of the many people who helped me over the course of this research work. First and foremost, a sincere thank-you to General Motors Corporation, both for the opportunity to conduct my LFM internship with the company and for their continued support of the LFM program at MIT. Special thanks to Mike Peterson, who tirelessly works on behalf of both GM and LFM; Len Baxter, the project's champion; Chris Williams and Ron Scholl, my supervisors; finally, Jay Ewing and Ed Zamanian, who served as professional mentors throughout my internship.
Thanks to my academic advisors, Dr. Stephen Graves (Sloan) and Dr. Randy Kirchain (ESD) for their help in the development of this work.
Most important, special thanks to my wife Randy, who has adapted to different jobs and environments
-first at MIT, then in Michigan, then back at MIT as I pursued my education through the LFM program
Biographical Note
A native of St. Louis, Missouri, Matthew J. Hasik graduated magna cum laude from Duke University in 1998, receiving his Bachelor of Science in Engineering degree with dual majors in Civil & Environmental Engineering and Public Policy Studies. He was commissioned an officer in the United States Navy, and entered active-duty service.
Matt was the recipient of both a Fulbright Scholarship and a Duke University Graduate School Fellowship, and earned his M.S. in Mechanical Engineering from Duke University in December 1999, completing a research program in the areas of acoustics and ultrasound. He was published in November 2002 as principal author of Evaluation of Phospholipid Ultrasound Contrast Agents in the journal
Ultrasonics.
Matt completed the Navy's Surface Warfare Officers School in Newport, RI, and spent about two years onboard USS ELROD (FFG-55) in Norfolk Virginia as Main Propulsion Assistant. He qualified as Engineering Officer of the Watch, Officer of the Deck, and Surface Warfare Officer, and completed a deployment to the Mediterranean Sea as part of the Standing NATO Force Mediterranean following 9.11.01. He was selected as Destroyer Squadron Twenty-Eight's Shiphandler of the Year in 2001.
Matt then took a position at the Supervisor of Shipbuilding, Newport News, Virginia as Assistant Project Manager (Combat Systems) for the refueling and complex overhaul (RCOH) of USS DWIGHT D. EISENHOWER (CVN-69). During this time he qualified as an Engineering Duty Officer, including Docking Officer certification.
Matt left active-duty military service to pursue his MBA and Masters Degree in Engineering at the Massachusetts Institute of Technology, under the auspices of the Leaders for Manufacturing (LFM) Program. He completed a seven month internship at a major automotive manufacturer in their Manufacturing Planning and Advanced Vehicle Development groups, developing the research work
described herein.
Introduction & Problem context
Increased competition, shifting customer preferences, and changing marketplace dynamics in the motor vehicle industry have led to increased product proliferation around the world, including North America, widely regarded as the most competitive among the major automotive markets. Responding to market trends in this highly competitive arena has forced the Original Equipment Manufacturers (OEMs), such as
General Motors (GM), Ford, DaimlerChrysler (DCX), Toyota, and Honda, to increasingly offer more and more unique vehicles to suit a widening array of customer needs. Branching out beyond traditional
sedans, wagons, and sports cars,
OEMs
began selling minivans and sport utility vehicles (SUVs) in the 1980s and 1990s, adding multiple truck-product entries (regular cab, extended cab, crew cab, short box, etc.), and rounding out their product offering with mid-size and small SUVs in the late1990s.
More recently, manufacturers have begun designing crossover utility vehicles (CUVs), essentially sport wagons built on car platforms.From the customer's perspective, the trend has led to greatly increased consumer choice for both the function and styling of a desired vehicle. And while certain manufacturers have established first-to-market presence in particular new segments, the other
OEMs
typically quickly followed, bringing even further innovation, differentiation, and competitive prices with them in the rush to offer new and profitable products.This trend has, however, presented a number of manufacturing challenges for the OEMs, especially in mature markets such as North America and Europe, as they have added new products proportionally faster than the overall rate of sales growth in the industry. The result has been the decrease in the average volume per vehicle body style produced and sold, as customer demand has spread across more product segments, more manufacturers, and more types of body styles. In fact, Pil and Holweg studied the European passenger car market from 1990-2002 and concluded just that (see Table
1
and Figure 1). The number of body styles offered in this mature market has doubled in this time period, while the average production volume per body style has fallen by nearly 50%, to just 69,000 units annually.'Given the relatively strong economies of scale which exist in the automotive industry, the challenge has been to meet market demand for different customer preferences without resorting to a manufacturing system that sacrificed these economies, while meeting increasingly stringent demands for high quality.
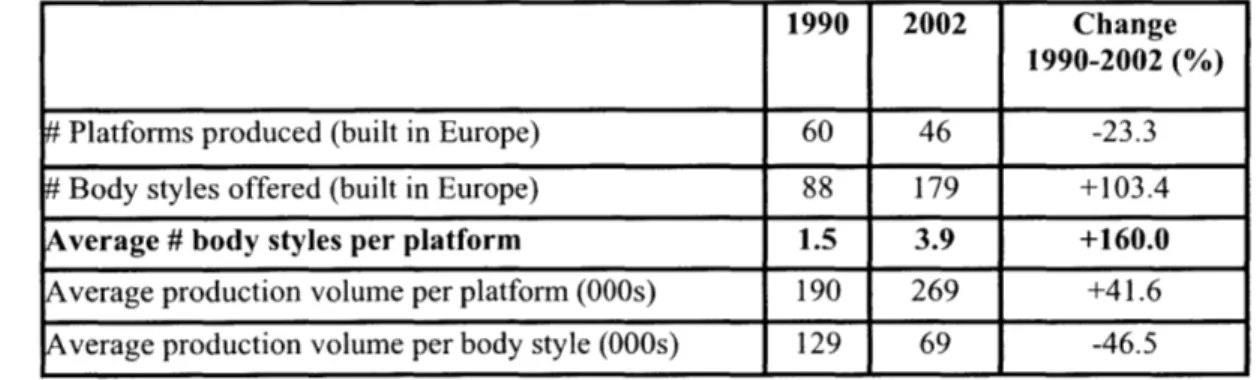
Table 1: Study of European Passenger Car Platforms, Body Styles, and Volumes (1990-2002)2
1990 2002 Change
1990-2002 (%)
# Platforms produced (built in Europe) 60 46 -23.3
# Body styles offered (built in Europe) 88 179 +103.4
Average # body styles per platform 1.5 3.9 +160.0
Average production volume per platform (000s) 190 269 +41.6 verage production volume per body style (000s) 129 69 -46.5
Pil and Holweg, p. 399. 2 Pil and Holweg, p. 399.
Data reflects products built in Europe; does not include products built elsewhere but sold in Europe
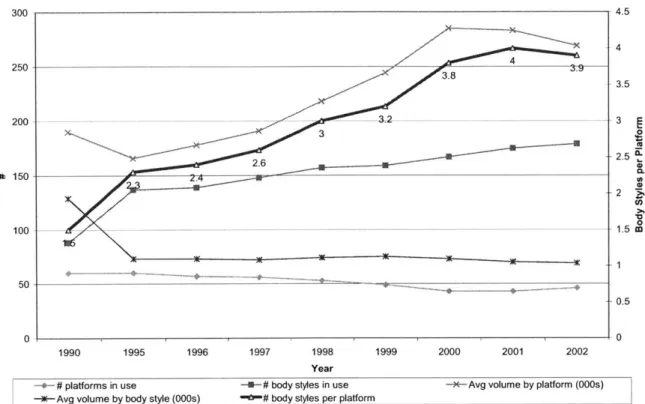
European Passenger Car Market: Platforms, Body Styles, Volumes
300 4.5 4 44 250 3.8 3.9 3.5 2.5 2.6. k 150 2 4 0 100 -______ 1.5 to --0.5 0 A10 1990 1995 1996 1997 1998 1999 2000 2001 2002 Year
-+-# platforms in use -U-# body styles in use -- Avg volume by platform (000s) -*-Avg volume by body style (000s) "'"# body styles per platform
Figure 1: European Passenger Car Market: Platforms, Body Styles, and Volumes 1990-20023
To accommodate the competing priorities of customer preference for vehicle variety and the market and manufacturer's requirements for cost competitiveness, OEMs have long utilized a strategy of product platforms to varying degrees. Multiple products are designed based on the same key structures (platform
or underbody), incorporating different body sides, top-level structure, and interiors to turn what is one set of major designs and components into multiple vehicles, for instance, a sedan, coupe, and convertible all based on the same underlying engineering and components. The key to this strategy is that not only can engineering costs be shared more widely across multiple vehicles, but manufacturing facilities can be designed based on this platform-sharing commonality.
The trend towards increased product proliferation and decreased average volumes seems only to be accelerating with the aforementioned wide introduction of car-based crossovers across OEMs. Thus, firms must critically evaluate their manufacturing strategy and determine how to adapt to these challenges, including a look at both the macro (across the entire enterprise of plants) and micro (inside a particular plant) levels.
A cost-effective manufacturing strategy typically attempts to drive plant utilization up towards or beyond 100% in order to achieve maximum scale economies, while minimizing manufacturing capital investment
necessary to produce the required vehicles. This effort becomes even more critical when labor is considered a fixed cost due to the long term and relatively inflexible nature of contracts typical in the traditional auto industry. Ideally, a manufacturing facility would be able to produce a wide variety of different styles of vehicle, up to and beyond its volume capacity maximum, and thus easily satisfy the market's requirements, whether they be low-mix, high-volume or higher-mix, lower average volume manufacturing. (Note that product mix in this text refers to the number of different body styles or models produced by the manufacturing facility).
Flexibility plays a key role here, enabling the manufacturer to respond to two primary challenges. First, uncertainty in the marketplace for particular vehicles is mitigated by configuring the manufacturing system to be able to produce different types of vehicles, so that production can quickly be shifted, whether in the short (timeframe of weeks) or medium (timeframe of months) term to the correct product mix with minimal penalties in time, cost, and quality. Second, flexibility in the manufacturing system enables the firm to more easily and cost-effectively transition between generations of vehicles. In essence, flexibility is an "investment that creates options for the company".4 While flexibility plays a role in the evaluation of the manufacturing strategy necessary to achieve production of increasingly differentiated products, this text will not directly address the topic, as a wide body of literature exists on the subject. Instead, flexibility will only be addressed in terms of its relationship to and impact on manufacturing plant complexity.
Yet producing a wide array of products in a single facility presents significant challenges, many of which can be described by the term "complexity". For instance, designing a manufacturing system that is able to handle multiple unique parts that must be fitted to an assembly at the same point in the assembly sequence presents significant challenges in material flow and presentation, automated conveyance, scheduling, assembly time constraints, and labor skill. Designing machine tools that are able to
manufacture multiple types of products leads to increasingly complicated fixturing and control systems. However, configuring a manufacturing plant to produce each unique product on a dedicated line with its
own equipment, tooling, and labor can itself lead to system-level complexities and associated higher costs. As a manufacturer strives to increase the number of vehicles it is producing in a single plant in order to
meet customer demand for differentiated vehicles while balancing the need to achieve scale economies and minimize capital investment, it will experience increased assembly plant complexity. Complexity has been addressed in a wide variety of academic and business literature; several pertinent concepts are
described in the following section. Literature Review
A literature review was conducted in order to determine which previous work performed in the area of complexity analysis and management would be useful in guiding this study. These references were used to help frame the challenge of evaluating a manufacturing plant complexity threshold. The most pertinent are reviewed here.
Definitions of Complexity
First, the literature review focused on the definition of the word complexity, and how it relates to the manufacturing system. An excellent overview of several relevant definitions is developed by Sussman, who evaluated about twenty different texts.
Among these works, Joel Moses describes "complexity and flexibility" as "a system.. .composed of many
parts interconnected in intricate ways...." and defines the "...complexity of a system simply as the
number of interconnections between the parts."5
Lovejoy and Sethuraman discuss "complexity costs" of performing a heterogeneous rather than
homogeneous set of tasks. They state "...task variety alone, even absent time pressures, can cause direct quality problems. It is recognized in the human factors literature that managing a wider array of stimuli can decrease performance. These quality effects can impose rework that amplifies time pressures. Therefore, it can be difficult to untangle the effects of time-based and quality-based complexity
phenomena, because behaviors will adjust to substitute one for the other."6 Additionally, they point out that the cost of complexity can be seen through the concept of dis-economies of scope, the difference between performing heterogeneous and homogeneous tasks.
Ziegler's thesis for the Ford Motor Company "Complexity Reduction in Automotive Design and Development" essentially comes to three conclusions; the first surrounding the use of design structure matrix (DSM) and axiomatic design concepts (ADC); the second concerning the existing management of information; and finally, the need to reduce complexity and complicatedness through reuse.7
His work focuses on how to apply DSM and ADC to product development in order to yield benefits of reduced complexity. A short case-study of complexity using a system dynamics model of the Ford Taurus reveals that simplification is achieved through re-use. Thus, sharing parts and engineering
solutions (reuse) lowers manufacturing complexity.
Calinescu et al. define manufacturing complexity as a "systemic characteristic which integrates several key dimensions of the manufacturing environment which include size, variety, concurrency, objectives,
information, variability, uncertainty, control, cost and value." They note that process and equipment complexity drive costs higher because of the required flexibility in handling components or subassemblies of different shapes or configurations. Due to the differences in the number of components, additional assembly stations and floor space may be required, with the potential for low utilization at the facility. As a result, line balancing can be quite difficult. They summarize that some of the direct impacts of variety (in this case, increased product mix) on manufacturing are complexity in material processing, excessive capital investment, changes in assembly sequence, and complexity in line balancing.8
Saeed and Young define complexity in companies as the "...systemic effect that numerous products, customers, markets, processes, parts, and organizational entities have on activities, overhead structures, and information flows." They believe the main problem triggered by excess complexity is the appearance of hidden costs, which are generally not visible and can negatively affect the competitive advantage of the enterprise.9
The challenge, as Blecker et al. point out, is to determine how much complexity is optimal.'0 Saeed and Young propose to identify the complexity the customer rewards and the complexity for which the market is not willing to pay." One might term the former "good complexity" and the latter "bad complexity".
' Sussman, p. 3.
6 Lovejoy and Sethuranan, p. 222-223.
7 Ziegler.
8 Calinescu, p. 1.
9 Saeed & Young, p. 1. '0 Blecker, et al.
These authors all point to several key themes in their research work on complexity: * Sharing and re-use of resources reduces complexity
* Complexity arises due to the non-homogeneity of tasks to be performed
* Complexity has system or enterprise-wide effects that are not always seen nor well-understood Product Variety, Option Variability, and Impact on Manufacturing Operations
There is a large body of research work focused on the automotive sector, much conducted under the auspices of the International Motor Vehicle Program affiliated with the Massachusetts Institute of Technology (MIT) over the last 15+ years. Several of these works have specific relevance here.
First, MacDuffie, Sethuraman, and Fisher's work of "Product Variety and Manufacturing Performance. Evidence
from
the International Automotive Assembly Plant Study" examines the effects of product variety on labor productivity and consumer-perceived quality measures. They conclude that the impact of product variety on manufacturing performance varies, and seems to be "much less than conventional manufacturing wisdom would predict".12 They break product variety into several categories, including fundamental variety (model mix complexity: platforms, body styles, drivetrain configurations), intermediate variety (parts complexity: engine/transmission configurations, parts, percent shared parts, suppliers), and peripheral variety (option content, variability).In particular, they found no statistically significant effect of their various measures of product variety (complexity) on product quality. They did find a consistent and negative relationship between parts complexity and labor productivity (higher complexity leading to lower productivity). 3 This is revealing in that it agrees with conclusions drawn from other researchers (above) that using different assemblies increases complexity in vehicle manufacturing operations, and sharing or re-using parts and engineering solutions reduces complexity.
Further, MacDuffie et al. conclude that the presence of lean systems greatly enhances the ability of the manufacturing organization to adapt to and handle increased product complexity. In fact, they believe that investments in such systems can render handling increased variety and complexity "free", much as lean systems can yield quality improvements that are "free".'
There has been ongoing discussion among automotive industry professionals concerning the validity of using part counts (or cost-weighted part counts) vs. the number of build combinations as an indication of manufacturing plant and system complexity. Some argue that part counts are a better measure, as they may provide more insight on the total system costs, including design, development, manufacturing, logistics, etc. This may seem counter-intuitive, in that many on a first analysis would conclude that a greater number of possible combinations of the product's features would indicate just how complex the product, and therefore the manufacturing system, truly is. However, consider the following example. A vehicle that offers power windows and aluminum wheels as "free-flow" options (ie, available on any vehicle regardless of option package selected) has 4 possible combinations (neither option, both options,
or one of either options). A vehicle that offered those two options only as an "option package", i.e., " Saeed and Young, p. 2.
2 Macuffie, et aL., p. 350. "2 MacDuffie, et. al, p. 362.
bundled together, would only show two combinations (both installed, or neither installed). If one were to compare the number of combinations as a measure of the complexity in building that vehicle, he may conclude that the first vehicle is perhaps twice as complex as the second. Yet the vehicles have the same content (namely, power windows and aluminum wheels), and require basically the same amount of direct labor to install those options. In fact, the installation of the power window and the special wheel/tire set typically occurs at very different assembly stations inside the plant, and the workers performing these tasks are not affected by the presence or lack of the other item of vehicle content.
In fact, a simplistic view of combinations may not reveal the full impact of complexity on a plant's operations. A more detailed look at option variability within particular assembly stations is necessary. For instance, the variability in an assembly worker's installation of either a power window or a manual window (when installed at the same station) may have an impact not only on the particular station worker, but also on the plant's logistics and support structures that provide the correct array of parts for each vehicle. In fact, Fisher and Ittner argue that the introduction of option content variability into a plant makes planning and scheduling more complex, delivering parts to the line more difficult, and increases the chance of assembly errors, leading to higher overhead and rework requirements."
MacDuffie et al. reported that option variability actually had a positive correlation with labor
productivity. In other words, higher variability was associated in their study with higher productivity, not the outcome many would expect. The authors believe that this is due to the fact that plants which
processed more highly variable products operated on a different, more flexible production frontier than did the others, and were perhaps less affected by such variability."
Fisher and Ittner, in a somewhat more in-depth study of a single assembly plant, concluded that product variety, as seen through option variability, increases indirect costs (including overhead hours, rework, and inventory) and adds excess labor capacity at work stations (required as a buffer against variability). They determined that option variability does not affect direct labor significantly, as the assembly line tends to be buffered (provided with excess capacity) at the particular stations where variability is a real problem. However, that means the manufacturer is paying for this variability inherently in his overall industrial engineering design. While the results are limited to a single plant, the authors believe that their results suggest product mix variability is a better indicator of product variety in mixed-model assembly operations than measures such as part counts.'7
Reducing option variability through option-package bundling reduces "external variety", as seen by the customer, helping firms to reduce forecast error and the obsolescence risk of inventory, as well as
simplifying a product's choices for the customer. However, reducing external variety may not necessarily lead to a commensurate reduction in "internal variety" or complexity, as the content specified by these options still must be installed on the vehicle. If the OEM is able to install this content with lower variability, Fisher and Ittner's results would suggest that the OEM would reduce his indirect costs. Late-point configuration of vehicles may also reduce assembly complexity by taking parts out of the assembly plant, but other reasons to employ this strategy include more flexibly meeting customer requirements.
It should be pointed out that Fisher and Ittner's work concluded that product variety is not a critical issue for the body shop and paint processes, as their automation and flexibility levels are adequate to handle the
15 Fisher and Ittner, p. 779.
16 MacDuffie, et al., p. 367. 17 Fisher and Ittner, p. 785. 18 Pil and Holweg, p. 398.
limited variety (predominantly body style) they encounter. Further, they did not include in their cost analysis the fixed investments in systems or automation which may help handle variety and complexity.'9 Thus, there appear to be no definitive conclusions concerning the impact of product variety, and thus complexity driven by variety, on manufacturing operations. While combinations and option variability likely contribute to complexity, it is difficult to conclude with certainty whether they contribute significantly or are perhaps second-order effects.
Pil and Holweg point out that "reducing or delaying variety decreases manufacturing and logistics costs, but may also affect design costs and reduce revenue by limiting the offerings in the marketplace." Other researchers have explored ways to determine the optimum level of variety, but as Pil and Holweg note, MacDuffie, et al. found that they "have reached no definitive conclusions on product variety's impact on manufacturing operations."2 While the context of this comment applies to the offering of differentiated product content (attribute variety in products), at a more general level it may apply to the offering of variety across differentiated products in a firm's product portfolio.
Evaluating Complexity
Raphel deals with the question of complexity management in terms of the decisions made to identify and weigh the costs and benefits of product line expansion. He defines complexity as the proliferation of suppliers, materials, products, processes, and customers that result from customer requirements, revenue
and growth targets, competition, outdated or ineffective business policies, and a failure to communicate. His research work at Hewlett-Packard centered on the development of a model that enabled managers at the firm to more thoroughly populate and evaluate the cost-benefit analysis for the introduction of a new product. He explicitly deals with such things as parts sharing and inventory holding costs resulting from product introductions, and their effects across the supply chain. He further details the hidden costs of
individual managers optimizing their product portfolio at the expense of a firm-wide optimization of product strategy. His basic rule of thumb is that complexity should be added to the product line only when its benefits outweigh its costs, a simple application of economic theory on the trade-off between marginal cost and marginal benefit. He notes that detailing some of these costs can be quite difficult.2 2 Raphel describes two ways in which firms respond to complexity: trimming their product portfolio, thereby reducing system complexity, and ensuring they are able to cover their costs when introducing any new product that adds complexity to their system. In this vein he develops a recommended approach for decision-making about the introduction of new products, using the concept of a "contribution margin threshold". Essentially, through his modeling efforts, he is able to determine a relevant minimum threshold that any new product must meet in order to be considered to be a positive business case for the firm.23
Finally, Raphel notes that the real difficulty in managing complexity is to separate the "good complexity" that customers are willing to pay for from the "bad complexity" that needlessly increases costs and jeopardizes profitability. This will be quite useful in evaluating the question posed as to whether a complexity threshold exists in a plant. Certainly some manufacturing professionals might tell you that
'9 Fisher and Ittner, p. 775.
20 Pil and Holweg, p. 394. 2 Raphel.
22 Raphel.
simplicity is the best way to run a manufacturing operation, similar to Henry Ford's famous statement that "they can have any color they want, as long as it is black". However, manufacturing complexity driven by product complexity that yields profits in the marketplace is a critical part of any manufacturer's strategy, especially in a highly competitive arena like the North American motor vehicle market. These papers lead us to several additional summary points:
1.
There is some disagreement on measuring product variety and manufacturing systemcomplexity. Combinations may be misleading; part counts may provide more insight on total system costs; option variability may enable better analysis in the general assembly area. 2. The impact of product variety on manufacturing system performance varies, and in fact may
have different impacts across particular aspects of the manufacturing process
3. A manufacturer must evaluate the complexity customers will pay for vs. that which they won't, and make business case decisions for products based on both revenue and cost implications.
Manufacturing complexity, and its associated costs, must be evaluated against the revenues realized by the production and sale of those products driving complexity. In fact, it is not a question of "how much complexity can we accommodate", but rather, how much must we accommodate in order to profitably build and sell our products? Though slightly nuanced, the difference in approach is significant. Rather than focusing this research work solely on the question of whether some firm limit to the number of body styles a plant can produce exists, it makes sense to develop a framework for the evaluation of complexity, enabling the consideration of each strategic situation relatively, from the standpoint of potential business results. Estimates of product revenues can then be compared to estimates of production costs (and associated complexity-related costs) to determine the most effective manufacturing strategy, in other words, the one that yields the highest profits.
Flexibility and Complexity
The concept of complexity is tied to notions of manufacturing flexibility. Two authors suggest particularly useful frameworks for considering such flexibility.
Upton characterizes flexibility as "the ability to change or react with little penalty in time, effort, cost, or performance." He proposes to characterize flexibility along three axes: dimensions (what needs to change
or be adapted to), time (over what time period), and elements (what is most important - range, mobility, etc.). 24
Gerwin defines flexibility as an investment that creates options for a firm. He cites previous research work in suggesting that flexibility be measured through economic value or cost, due to the difficulty of
assigning other physical units. He goes on to point out that changes in flexibility must be measured against the trade-offs in cost, productivity, quality, and other objectives. Further, while manufacturing flexibility is viewed by some as an unqualified good, he notes that it is possible for "too much" flexibility to encourage waste, including adapting to uncertainties that should have been eliminated rather than dealt
with.
Gerwin's approach is quite useful in this context, as the view of flexibility as a trade-off is much the same way that we propose to view complexity: a trade-off the firm makes in cost, productivity, quality, and to a
24 Upton, p. 73.
lesser extent other objectives, in developing its market and manufacturing strategies. Flexibility may in fact enable the greater accommodation of complexity, essentially buying the firm a real option to adapt to changing market demands.
A Question of Complexity: How many vehicles to build in one plant?
A leading OEM has identified complexity as a critical, potentially limiting factor in its consideration of determining the optimal number of vehicles to produce in a single manufacturing facility, which will in turn influence its enterprise-wide manufacturing strategy. Balancing the number of vehicle entries (number of unique body styles) with the capabilities of its assembly plants, both in terms of volume and product mix capacities, is a critical part of the manufacturing planning process.
Typically the manufacturing planning process proceeds in two manners. First, an overall plan is developed, with the intent of developing a high-level strategy for the number of plants to operate, the product mix and volume capability of each plant, and whether to consider building new plants or closing existing plants in order to meet the requirements of the product plan. The second is driven by marginal analyses: given a desire to design, produce, and sell a new product, where shall it be built? What is the most cost-effective solution considering the total manufacturing system, its capabilities and constraints, and the best known range of information about future requirements?
In evaluating how many vehicles to produce in a single manufacturing facility, many factors are considered, including both aspects of the manufacturing system (floorspace, material flow, conveyance and carrier/locating strategies, etc.) and the product (degree to which the assembly sequence meets
standard specifications, adherence to standard assembly locating strategies, etc.). The overall evaluation at a high level considers on one hand the complexity of producing multiple products using shared
facilities and equipment, and on the other the cost associated with doing so.
At a fundamental level, the question boils down to one of scale economies and complexity. A manufacturer realizes scale economies by producing a volume of products using the same resources. However at some point, the manufacturer may begin to experience dis-economies related to the
complexity of his operations: an increase in costs associated with the production of related products using the same resources. Analyzing the point at which these complexity costs become prohibitive is one way to frame the critical question in this research effort: is there a complexity threshold, and if so, where (how many body styles in a plant)?
With the above introduction to the problem landscape, we establish a multi-part hypothesis:
1.
Automotive OEM's manufacturing complexity accommodation strategies are driven by their product portfolio (range, volume, and design), their manufacturing footprint (plants, capacities, and manufacturing flexibility), and their vision of how to approach the marketplace, both today and in the future.2. A complexity threshold capable of driving management decisions on assembly plant capital investment (decisions of hundreds of millions of dollars) cannot be established through empirical data analysis.
3. Assembly plant complexity can be evaluated from the perspective of the manufacturing strategist or planner as a trade-off, using a capital investment and production allocation optimization model that seeks to minimize total manufacturing cost.
a. Specifically, analysis of model constraints directly related to plant complexity (ie, the number of body styles able to be produced in the plant) allows the financial evaluation of various complexity accommodation strategies.
b. A portfolio allocation across several different constraint scenarios reveals the incremental value of relaxing these complexity-related constraints. This in turn yields an order-of-magnitude estimate for the amount of complexity-related operating impact/cost that the manufacturer is willing to tolerate in the transition to a less-constrained manufacturing
system.
c. In particular, a manufacturer can determine the capital investment savings associated with a higher-mix manufacturing strategy, and then evaluate those savings against the
anticipated increase in operating costs associated with complexity and plant congestion. This evaluation improves understanding of whether and where a complexity threshold exists both at a macro, manufacturing system level, and a micro, or individual plant level. This hypothesis shall be explored in more detail in the following sections.
Research Methodology
In order to address this question, it is useful to establish a competitive map of what every major
automotive manufacturer produces in each of its assembly plants. This enables two key steps to be taken. First, a benchmark was established to describe the level of product-mix complexity currently being handled across the industry, for each competitor and plant. Second, an evaluation of certain competitor strategies for meeting increased marketplace differentiation demands was performed. This analysis was conducted using all publicly available information.
Beyond understanding what dynamics exist in the industry in terms of both an overall picture and that of individual competitor strategies, it is necessary to evaluate the question of a complexity accommodation limit or complexity threshold specific to the manufacturer in question. This effort takes into account the appropriate and specific details of the products, current manufacturing system design and constraints, and the firm's vision of the future to determine whether a complexity threshold exists for the manufacturer's system, and the plants within that manufacturing system. If the threshold does indeed exist, it must be evaluated in terms of its impact on the overall manufacturing system, and plans made to balance future product volume and mix strategies against the costs associated with the complexity threshold.
In fact, it may be quite difficult to establish a specific threshold based on historical, empirical data analysis. This is true for the following reasons:
" The threshold may be beyond the capability which currently exists in any plant, thus precluding the existence of data to analyze whether and where the threshold exists
" The threshold may not be an "absolute" matter, but rather an element of the relative analysis of alternatives that is considered in making manufacturing investment and product allocation decisions
* The data to examine whether the threshold exists within the realm of currently operational plants may not reveal the specific existence of a complexity threshold. In reality, the data to be
analyzed (manufacturing costs, labor productivity, etc.) that would allow a comparison of the impact of complexity in different product-mix scenarios at a plant have a number of factors
affecting them, including the element of increased complexity. Thus, separating out the effects related to complexity vs. those related to product design, labor contracts, or plant management may be quite difficult if not impossible to achieve.
Thus, an alternative and parallel approach was developed in order to help provide insight on the question of the complexity threshold: analytical modeling.
In fact, a modeling approach is often used in situations where data analysis, statistical or otherwise, is perhaps not available, confusing, or more detailed than necessary to develop the understanding necessary to achieve the stated goal. Typically, a model will be developed using the best available data with a number of reasonable and simplifying assumptions intended to enable the accomplishment of the analytical objective with a high degree of confidence. The model can then be subjected to validation testing against real-world scenarios to determine the level of uncertainty associated with the model results. Management users of the model are then armed with not only the results, but the relative confidence with which to use the results in making business decisions.
The model constructed for the purpose of developing insight on and evaluating the existence of a complexity threshold in the manufacturing system and/or particular plants is a linear-program based
optimization. It was written in Microsoft Excel with the use of Frontline Systems' Premium Solver Platform engine. The model optimizes the allocation of products to plants by minimizing the total manufacturing cost (capital investment and operating expense) associated with the production of the input
vehicle quantities, by platform and body style.
Each of these three methods will be defined in further detail in the following sections: " Competitive benchmark study
* Empirical data analysis * Model development
Analysis, Part I: Competitive Benchmark of North American OEM Assembly
Plant Complexity
Introduction & Background
The initial analysis step was to benchmark competitors' manufacturing strategies. This was done in order to develop an understanding of their individual approaches to the challenges of scale economies and complexity costs, as well as to determine whether there are trends across the several major automotive
OEMs.
This analysis was conducted at a macro-level for three primary reasons:I. Data availability: publicly available information on each OEM's scale economies and complexity accommodation strategies is limited to data on which products and platforms are produced in particular plants, and in what volumes. There is some further information available concerning how these strategies are executed, including the use of sub-assembly and sequencing strategies, labor practices, and particular manufacturing engineering technologies in use by certain OEMs. 2. Manufacturing technologies and processes: the fundamental elements of motor vehicle
manufacture do not vary widely by OEM, as each typically configures their plants using technologies that are widely available from industry-wide suppliers. Macro-level processing
techniques are generally well-known and repeated across the industry, but differences exist in the details of the plant configuration, operations, utilization of labor, utilization of automation, etc. Therefore, it is useful to start with a look at how the various OEMs have utilized the similar building blocks of vehicle manufacturing process and technology to meet the requirements for producing their particular array of models and products.
3. Part differences relationship to complexity: as discussed previously, major part differences between vehicles are a reasonable first-cut indicator of the complexity level in an assembly plant, given the requirements these differences drive in capital investment, handling, logistics, labor skill levels, etc. While detail on parts-level engineering is difficult to obtain, these part
differences can be viewed at a high level by the major sub-assemblies in which they "roll-up", in other words, the major pieces that comprise a motor vehicle: platform, body style, chassis, engine, and transmission. Thus, differences between vehicles viewed from these high-level
sub-assemblies gives some indication of differences at the lower, component-level, leading in turn to requirements from differences in processing, handling, labor skill, etc.
Each OEM's North American plants were studied to determine how these plants ranked on a simple "complexity scale" which summed the number of platforms, body styles, chassis, engines, and transmissions being used in the manufacture of these products at each plant. Each plant was then
compared on the basis of the products it produces, and how those products do or do not share these major sub-assemblies.
North America was chosen as the focus of the analysis effort for several important reasons: first, data was readily available to support the effort; second, it is one of the most competitive automotive markets, and the basis for many of the OEM's profits and losses; and third, there are indications that the North American market will continue to fragment in the coming years similar to the trend in Europe discussed earlier. This gives further evidence to the need to understand each OEM's manufacturing strategy in this market.
The data was gathered from several key industry sources, including Ward's Automotive Database, The 2005 Harbour Report, The Prudential Securities Automotive Database, and the AutoSitePro Database. Though there are disagreements between these various sources in some specific instances, every effort was made to ensure that the best synthesis was developed from among the sources. These differences between the data sources will not change the overall, qualitative understanding that the competitive benchmark study is intended to develop.
The competitive benchmark charts display the data separated into two primary market segments:
passenger car, and Truck-Van-SUV. This latter category includes minivans, full-size vans, and mid- and full-size SUVs. This distinction was made for two primary reasons:
1. All major
OEMs,
with the exception of Honda, produce pickup trucks that are body-on-frame construction. This assembly method is inherently different enough from the manufacture of body-frame integral vehicles that only one OEM builds both in a single facility: Nissan. 2. Many of the OEMs build SUVs based on either their pickup truck and/or minivan platforms.There are a couple of vehicles known today as small SUVs that are built from car platforms (for instance, Honda's CRV and Element); these are included in the passenger car tallies, and will increasingly be referred to as "crossover utility vehicles" (those based on car platforms, as
opposed to trucks or vans) as this market segment picks up steam among both customers and manufacturers in the near future.
Two formats were chosen in order to most effectively display the data. Each shows a slightly different view of the same information, painting part of the overall picture of the competitive landscape.
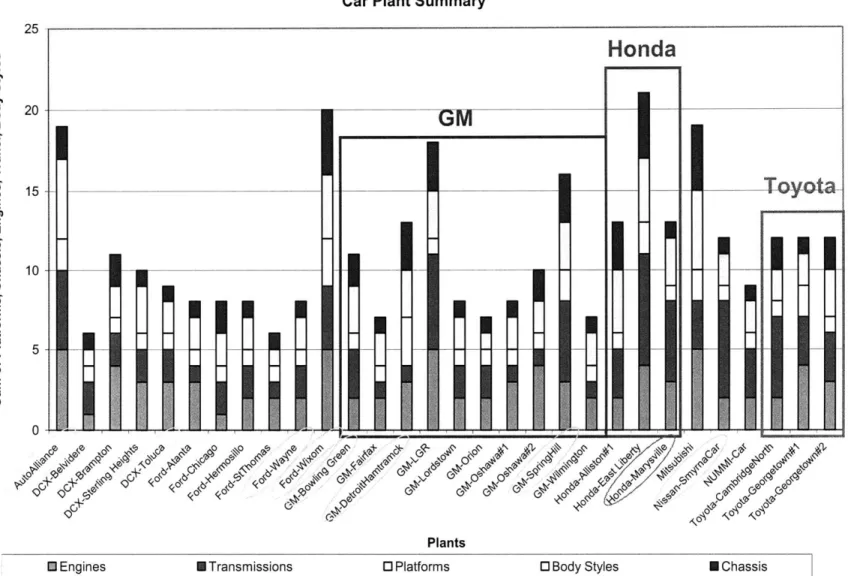
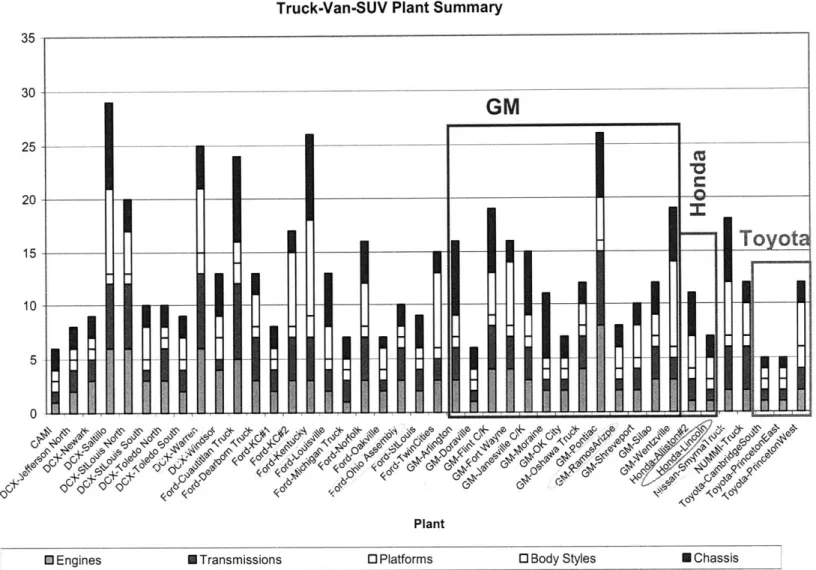
1.
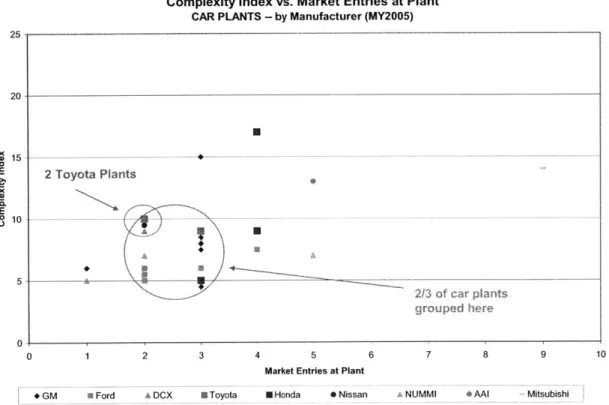
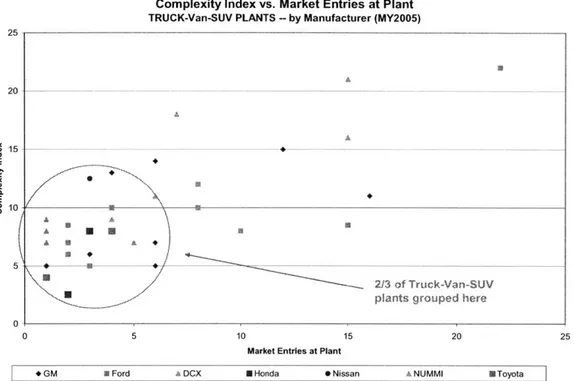
Simple Bar Chart: raw data for each plant, summed and grouped by manufacturer2. Plant View of Product Complexity: Complexity vs. Market Entries at Plant. This chart shows the sum of platforms, chassis, engines, transmissions vs. the number of unique products (body style and nameplate), giving a plant-level view of the complexity associated with building its assigned products. [Note that the number of body styles produced in a plant, while shown on the y-axis of the Simple Bar Chart, is now displayed as part of the x-axis. Thus, the "complexity" scale shown along the y-axis of these two charts is different.]
Consideration was given to whether the data should be scaled, perhaps based on a minimum/maximum scale or an arbitrary
1
to 10 scale. However, it was decided that the choice of scaling factor may obscure the data unnecessarily. Second, consideration was given to normalizing the data based on the number of assembly lines in a plant. A correction factor was introduced as follows:1.
Simple Bar Chart: no normalization made2. Plant View of Product Complexity: the summed complexity score was divided by the number of "complete" assembly lines in a plant. For instance, a plant with
1
body shop,1
paint shop, and1
final trim area has 1 (3/3) "complete" assembly line, where a plant with 2 body shops,
1
paint shop, and 2 trim areas has 1.67 (5/3) "complete" assembly lines.There do not appear to be any clear trends among the
OEMs
concerning what level of complexity, as it is measured here, is ideally handled in a single assembly plant (refer to Figures 2 and 3). It is interesting to note that all three Toyota car plants in the study show similar levels of complexity; GM's plants arewidely varied; and Ford and DCX's plants exhibit, on average, lower levels of complexity than do GM, Honda, or Toyota.
Car Plant Summary 25
Honda
15 0 0.M E E 0 PlantsE
Engines U Transmissions 0 Platforms 0 Body Styles U ChassisTruck-Van-SUV Plant Summary LO 0 0 0 E __ I 1w
GM
-V
I
LI
I
M
fl
01
UUUI
[I
I
IM,
M, M, U1, va, M, " M M Emu MA MAM -- = ==.-Toyota
C~~\4 ,""~/
q,'W~
~
&
- 0 r 0 0n~
~<o
o 0~
0 PlantM Engines U Transmissions 0 Platforms 0 Body Styles N Chassis
Figure 3: Simple Bar Chart Complexity Scale, NA Truck-Van-SUV Plants 35 30 25 20 15 - 10-
5-0
I I -4 F ----q
Because the data presented Figures 2 and 3 are not normalized by the number of assembly lines that exist within a given facility (as noted), those facilities with multiple lines have been circled along the x-axis to point them out. While the use of multiple assembly lines (whether in part - ie, 2 body shops with one common paint and general assembly line - or whole - ie, multiple complete lines) within some facilities seems to be more clearly a complexity accommodation strategy, some are clearly not.
For instance, the Ford-Mazda joint venture plant known as Auto Alliance builds the Ford Mustang and Mazda 6 using separate body shops, but then combines these models through common paint and final trim areas. In contrast. Honda's Marysville plant does have multiple lines, however, each of these lines is capable of building any of the vehicles that Honda produces at the facility - clearly not a complexity accommodation strategy, but perhaps more a strategy to produce vehicles in volume and achieve economies of scale in one plant building.
Figure 4 shows a reasonable grouping of over 2/3 of all North American OEM passenger-car plants in one spot on the chart. This may indicate some level of current consensus about the best operational strategies, but it may also simply reflect the market reality of which manufacturers are able to sell their products in
high volumes, while others currently have chosen or are forced to compete with lower volume product entries. Figure 5, which presents the same data for the subset of North American OEM plants in the Truck, Van, and Sport Utility Vehicle (SUV) segment, shows a similar grouping.
There may be an element of historical bias included in this data, as North American plants have typically been able to configure themselves for fewer products at higher volumes given the dynamics of the market in recent history.
Complexity Index vs. Market Entries at Plant CAR PLANTS - by Manufacturer (MY2005)
25 20 X v 15 0 5 0 1 2 3 4 5
Market Entries at Plant
6 7 8
a Ford A DCX 3 Toyota U Honda 0 Nissan A NUMMI AAI Mitsubishi
Figure 4: Plant View of Product Complexity, NA Passenger Car Plants U 2 Toyota Plants 2/3 of car plants grouped here 0 * M_ 10
Complexity Index vs. Market Entries at Plant TRUCK-Van-SUV PLANTS -- by Manufacturer (MY2005)
25 A 20 ________ o15 - ______________ O 10 --A . 213 of Truck-Van-SUV
plants grouped here
0
0 5 10 15 20 25
Market Entries at Plant
+GM a Ford ADCX Honda 0 Nissan A NUMMI Toyot
Figure 5: Plant View of Produce Complexity, NA Truck-Van-SUV Plants
Honda's High-Mix Manufacturing Strategy
As noted, one of the challenges facing all vehicle manufacturers in North America is dealing with
customers' increasing desire for differentiated products, yet demand for competitive pricing, coupled with the manufacturer's challenge to make the most optimal use of its manufacturing plants. Thus, as product entries increase and average volumes decrease, manufacturers will increasingly look to build more styles of vehicle in a single plant, in order to achieve volumes in line with typical scale economies in the industry (roughly 200k - 250k units annually). The competitive benchmark analysis reveals that one
OEM in particular has already embarked on this journey, and is in the process of configuing its plants for
high-mix flexible operations: Honda.
Figures 6 and 7 describe visually some of the changes made at Honda's North American assembly plants recently, and changes to be made in the coming months. Its East Liberty plant in Ohio recently produced
Accords, and is expected to build the CRV in 2006. Thus this plant is moving from building 4 entries to 6
entries, putting it squarely at the
leading
edge of high-mix manufacturinang ok the major NAOEM
plants. In addition, its Alliston rder Ontario is adding capability to produce the Civic Si in 2006, bringing this plant's capabilities to 5 entries. And Honda's Marysville plant in Ohio is expected to begin production of the Acura RDX
crossover
vehicle in 2006, b n s t erianes. Even Honda's SUV and Truck plants are following suit: the Alliston #2 plant began producing the Ridgeline pickup truck for 2005 after moving the Odyssey minivan to the Lincoln plant, and the Lincoln plant is slated to produce a new crossover vehicle in the future.Complexity Index vs. Market Entries at Plant
CAR PLANTS - by Manufacturer (MY2005)
25-E.Liberty & Alliston#1 Honda East Liberty 20 recently added entries to existing (Civic Coupe/Sedan,
Element, Accord)
facilities
Z, ---
----Honda Alliston #1
10 (Civic C/S, Acura EL,
Civic Si) 5-Honda Marysville (Accord C/S, Acura TL) 0 0 1 2 3 4 5 6 7 8 9 10
Market Entries at Plant
*GM U Ford A DCX U Toyota N Honda 0 Nissan ANUMMI 0AAI Mitsubishi
Figure 6: Honda's NA Manufacturing Strategy (Passenger Car) -- Recent Model Changes Complexity Index vs. Market Entries at Plant
CAR PLANTS - by Manufacturer (MY2005)
25
E. Liberty & Honda East Liberty
Marysville (Civic, Element,
20-in near future E Accord, )
x= w 15 -- _ -0 S 0. E UO10
I
0 1 2 0 4 891 AA Honda Marysville (Accord, Acura TL 0 0 1 2 3 4 5 6 7 8 9 10Market Entries at Plant
* GM a Ford A DCX 8 Toyota U Honda 0 Nissan A NUMMI 0 AAI Mitsubishi
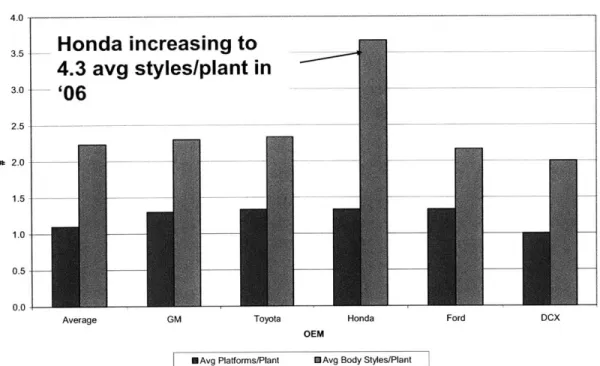
Honda is pushing the edge of the standard envelope of body-style complexity in its North American assembly plants. The conclusion is that a higher-mix (body styles) manufacturing strategy is not only possible, but being executed by Honda today. Figure 8 (below) makes the contrast quite clear: Honda, more than any other North American manufacturer, produces more body styles per plant than any of its major competitors, and this will become more pronounced in 2006.
If the trend towards increased marketplace fragmentation continues to drive the need for manufacturers to offer more differentiated products, yet do so with smaller volumes, Honda seems to have a competitive advantage in executing a strategy to effectively compete in this changing marketplace. Other OEMs faced with the challenge of more effectively utilizing their existing plant assets in response to increased proliferation and falling average volumes could likely learn from Honda's strategy and approach in their manufacturing system.
NA OEM Plants: Platforms & Body Styles
4.0-Honda increasing to
4.3 avg styles/plant in
30-'06 2.5 - -* 2.0-- 1.5- 1.0- 0.5-0.0-Average GM Toyota Honda Ford DCX
OEM
NAvg Platforms/Plant *Avg Body Styes/Plant
Figure 8: Platforms and Body Styles per Plant, by NA Manufacturer
Detail-level Vehicle Content
The analysis thus far does not consider more detailed levels of vehicle content, and the associated complexity driven by that content. For instance, while we have analyzed at a high level some of the major building blocks of the vehicle (platform, chassis, engine), we have not yet considered differences at the level of such items as sunroofs, stereos, and seats. The question is whether this level of analysis would yield additional information on how the major vehicle manufacturers design their products and operate their plants in light of our bigger challenge to evaluate the existence of a complexity threshold.
As stated earlier, Fisher and Ittner's research concludes, based on a single plant's data, that option variability drives higher indirect costs, and typically is accompanied by the addition of excess buffer capacity (direct labor) into assembly stations. MacDuffie, et al.'s research across some seventy assembly plants indicates that increased parts complexity is associated with lower labor productivity, but the effects of option variability are not correlated to lower productivity. Lacking specific data across several
manufacturers and plants to compare to either of these results, it seemed appropriate to instead conduct a small case-study of option content in order to make a gross assessment of detail-level content-driven complexity.
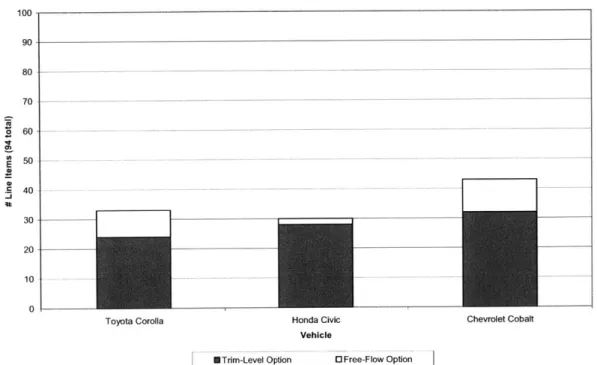
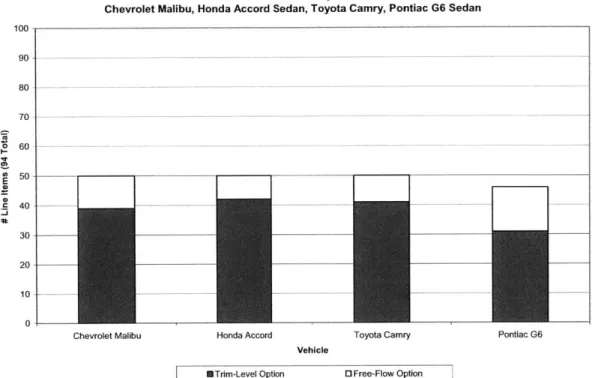
Three segments of vehicles were chosen (small, mid-size, and mid-size Luxury), and vehicles from GM, Toyota, and Honda were selected within these categories. Then, from over 125 different types of vehicle content (listed in the AutoSitePro database), 94 were selected as appropriate for these classes of passenger car. (For instance, items specific to pickup trucks and minivans were eliminated, including sliding side doors and sliding rear windows).
The number of line items of content offered on each vehicle was counted, and then classified as either a "trim-level" or "free-flow" option. Trim-level options are those items of vehicle content that come as part of a trim or option package (i.e., part of the manufacturer's bundling of options in its LX or EX trim levels), and are not available as stand-alone options. For example, if power windows are a "trim-level" option, they are only available on a vehicle of a particular trim level, and cannot be ordered for the vehicle regardless of trim level. Free-flow options are available to be put on any vehicle, no matter the trim level ordered (by the customer or dealer, depending on the circumstance). This resulting data is
shown in Figures 9-11.
Vehicle Content Comparison Toyota Corolla, Honda Civic, Chevrolet Cobalt 100-90 80 70-20 -30 10
Toyota Corolla Honda Civic Chevrolet Cobalt Vehicle
K
Trm-Level Option 0 Free-Flow OptionVehicle Content Comparison
Chevrolet Malibu, Honda Accord Sedan, Toyota Camry, Pontiac G6 Sedan
I
I
100- 90-80 -70 60- 50-40 -30 -20 -10 - 0-I -Honda Accord VehicleI
I
Toyota Carnry Pontiac G6
*Trim-Level Option 0 Free-Flow Option
Figure 10: Vehicle Content Comparison -- Mid-Size Car Segment
Vehicle Content Comparison
Toyota Avalon, Acura TL, Buick LaCrosse, Buick Lucerne
I
Acura TL
Vehi
Buick LaCrosse cle
*Trim-Level Option O Free-Flow Option
Figure 11: Vehicle Content Comparison -- Luxury Car
Chevrolet Malibu E *k 100 90- 80-70 -60 - 50-40 30 20-10 0 E
Toyota Avalon Buick Lucerne

![[PDF] Manuel de cours pour developper les connaissances en J2EE [Eng] | Cours j2ee](data:image/gif;base64,R0lGODlhAQABAIAAAP///wAAACH5BAEAAAAALAAAAAABAAEAAAICRAEAOw==)