IntroductIon
The prevalence of obesity and metabolic syndrome is increas-ing at an alarmincreas-ing rate all over the world. Once obesity is installed, energy restriction is frequently used to reduce body fat, leading also to a fat free mass loss (1). However, this loss of active tissue and muscle should be minimized.
It is admitted that fat free mass is better preserved in humans when protein intake is 22–29% of energy intake than when it is 12–20% (2). Still, protein quality has not been studied in the context of energy restriction. It was shown in animals and in humans that for a given amount of nitrogen intake, protein anabolism is not the same with amino acid mixtures, peptides, or different native proteins (3). In particular, casein, a slowly digested protein, promotes a higher whole-body anabolism than milk soluble proteins (MSP) that are rapidly digested in humans (4,5). The proposed mechanism is linked to the characteristics of apparition of amino acids in plasma: rapid, with high levels of total and branched-chain amino acids, for a limited time period for MSP, and lower levels for a prolonged time period for casein. In these healthy adults, the results are a
more prolonged inhibition of the whole-body proteolysis and a lower postprandial amino acid oxidation after casein feeding than after MSP feeding, although MSP transiently stimulate protein synthesis rates (4,5). Interestingly, these results are in opposite to what is observed in elderly subjects: MSP induce a better whole-body leucine balance than casein does in old subjects (6). Rat studies have shown that old muscle anabolism needs higher levels of plasma amino acids, especially leucine, to be triggered (7,8). This phenomenon could be due to the increased systemic inflammation with aging (9–11).
To our knowledge, casein and MSP were not compared in overweight subjects during energy restriction. When energy is limited, more amino acids are oxidized to produce energy. A limitation of this oxidation could be beneficial in order to direct amino acids toward the maintenance of the lean body mass. In that case, casein could be the best choice to feed energy restricted overweight subjects. Conversely, it is possible that, as observed in aging, more amino acid could be necessary to trigger protein anabolism during obesity. Indeed, obesity is often associated with insulin resistance and inflammation (12).
The Nature of the Ingested Protein Has
No Effect on Lean Body Mass During Energy
Restriction in Overweight Rats
Solange Adechian
1,2, Didier Rémond
1,2, Claire Gaudichon
3, Dominique Dardevet
1,2and Laurent Mosoni
1,2Severe energy restriction in obesity not only leads to fat mass loss but also to lean mass loss. The aim of this study was to compare the capacity of casein, a slowly digested protein, and milk soluble proteins (MSP; rapidly digested) to limit the loss of lean mass induced by energy restriction. Obesity was first induced in male Wistar rats by a 5-week feeding with a high-fat high-sucrose diet. The impact of energy restriction was then studied with high-protein (32%) diets containing either casein, MSP, or a 50/50 mixture of both proteins for 3 weeks (n = 10 per group). Food intake, body weight, nitrogen balance, creatinine, and 3-methyl-histidine excretion were measured during energy restriction. Then, tissue weights, plasma metabolic parameters (amino acids, glucose, insulin, cholesterol, triglycerides), and
in vivo liver and extensor digitorum longus (EDL) muscle protein synthesis rates were measured in postabsorptive state at the end of the experimental period. Although significant differences relevant to protein metabolism were observed between groups (protein intake, plasma amino acid concentrations, fecal nitrogen excretion, muscle protein synthesis rates), week per week, there were no significant differences in nitrogen balance whatever the protein used. In conclusion, our results show that in young overweight energy restricted rats, using a high-protein diet, the nature of protein intake has no influence on body protein retention.
Obesity (2011) 19, 1137–1144. doi:10.1038/oby.2010.260
1INRA, UMR 1019 Nutrition Humaine, F-63122, Saint Genès Champanelle, France; 2Univ Clermont 1, UFR Médecine, UMR 1019 Nutrition Humaine, F-63000, Clermont-Ferrand, France; 3INRA, UMR 0914, UMR INRA/INA-PG/AgroParisTech : Physiologie de la Nutrition et du Comportement Alimentaire, Alimentation Humaine, Centre de Recherche de Paris, Paris Cédex 05, F-75231, Paris, France. Correspondence: Laurent Mosoni (laurent.mosoni@clermont.inra.fr)
Then, MSP could be more efficient to spare fat free mass in low-calorie diets. Alternatively, a combination of casein and MSP could also be an even better choice, with a possible syn-ergic effect of fast and slow proteins, minimizing protein losses and stimulating protein synthesis.
Thus, the objective of this study was to test whether casein, MSP, or a 50/50 mixture of both could induce a better pro-tein anabolism to limit the loss of fat free mass during energy restriction. So far all the data obtained in other contexts sug-gest that differential effect should be obtain but it is difficult to predict which combination will be most efficient.
To answer this question, we developed a rat model of induced obesity (13) and used this model to compare the capacity of casein, MSP, or a 50/50 mixture of both to limit the loss of fat free mass during energy restriction by modulating protein anabolism.
Methods and Procedures animals and experimental diets
These experiments were conducted according to the guidelines formu-lated by the European Community for the use of experimental animals (L358-86/609/EEc). Male Wistar rats (n = 30) from Harlan (Gannat, France), weighing 315.3 ± 1.8 g (means ± s.e.) were housed in individual metabolic cages during the whole experiment, under controlled envi-ronment conditions (temperature 20 ± 1 °C, humidity 50 ± 5%) with a 12 h inverse light:dark cycle (light on at 1700 h) and water ad libitum. On arrival, rats were acclimatized for 4 days and fed commercial laboratory pellets (UAR 04, UAR, Villemoisson sur Orge, France). Then, animals were fed a high-fat, high-sucrose diet for 5 weeks (see Supplementary Table S1 online for detailed diet composition). Diets were prepared by a specialized unit of INRA (UPAE, INRA, Jouy-en-Josas, France) as dry powders which were mixed with tap water extemporaneously and given on a semi-liquid form. During the last 4 days of this period, urine and feces were collected and pooled. Then, animals were ran-domly divided into three groups (n = 10 per group) of equal weights (420.5 ± 8.6, 420.5 ± 8.8, and 420.8 ± 7.5 g) that consumed for the next 3 weeks a restricted amount of the high-protein diets containing as the only source of proteins either casein (casein group), MSP (MSP group), or a 50/50 mixture of both (mix group—see Supplementary Table S1 online). Our aim was to mimic in rats a human low-calorie high-protein diet in terms of duration (3 weeks equivalent to more than 6 months for humans), energy restriction (~40%), and protein intake (~35% of energy intake). These conditions are commonly used in humans within weight loss diets (14). The program of food restriction was determined from data obtained in a previous experiment (S. Adechian, D. Rémond, C. Gaudichon, D. Dardevet, and L. Mosoni, unpublished data). Rats in both experiments were pair fed, with a progressive increase of food intake to the desired level. Rats were offered an increasing amount of dry matter from 4 to 13 g (before restriction, ad libitum fed animals consumed 17.3 ± 0.3 g of dry matter). Urine and feces were collected during the 21 days of energy restriction and were pooled per week.
Body weights were recorded three times a week. Food was distributed in individual ramekins and changed daily at the beginning of the dark period. Food intake was precisely recorded during the last 4 days of the high-fat feeding period and during the whole energy restriction period by measuring daily the dry matter intake.
Killing and sampling
After 3 weeks of energy restriction, tissue protein synthesis rates were measured in vivo using the flooding dose method (13). The day before the terminal experiment, animals were fed as usual but the ramekin was removed in the evening. On the next morning, 20 min before killing, each fasted rat was injected, in a lateral tail vein under a light gaseous
anesthesia (isoflurane, Baxter, Mauripas, France) with a flooding dose of valine (150 μmol/100 g body weight) to flood the precursor pools, with 50% of l-[1-13C] valine (99%, Cambridge Isotope Laboratories,
Andover, MA). Then, a lethal anesthesia was induced by intraperitoneal injection of pentobarbital sodium (Sanofi, Libourne, France) just before killing by exsanguination. Blood was rapidly collected in heparinized tubes and centrifuged at 3000g for 10 min. Plasma was collected and frozen in liquid nitrogen before storing at −80 °C until further analy-sis. Liver, kidneys, small intestine, right gastrocnemius, right and left extensor digitorum longus (EDL), right tibialis anterior and right soleus muscles were excised and quickly chilled on ice to stop tracer incorpo-ration. The liver was cut into small pieces, rinsed in cold saline (NaCl 9 g/l solution) and wiped. The small intestine was emptied, rinsed with cold trichloroacetic acid (0.12 mol/l) and dried. The epididymal and renal fat pads were carefully removed. All these tissues were weighed, frozen in liquid nitrogen 3–5 min after exsanguination and stored at −20 °C until analysis. Spleen was only weighed.
Measurements of in vivo tissue protein synthesis rates
Measurements of valine enrichments. Enrichments of free and protein-bound valine were determined as previously described (13). Briefly, liver was powdered in liquid nitrogen in a ball mill ( Dangoumeau, Prolabo, Paris, France). A 0.2 g aliquot of frozen liver powder or whole EDL muscle were homogenized in 8 volumes of ice-cold 0.61 mol/l trichloroacetic acid (Potter, Bosch, France). Homogenates were centrifuged (5000g, 15 min, 4 °C) and superna-tants, containing free amino acids, were desalted by cation-exchange chromatography (AG 50 × 8, 100–200 mesh, H+ form Bio-Rad,
Rich-mond, CA). Trichloroacetic acid–insoluble proteins were washed again in trichloroacetic acid and three times in four volumes of 0.2 mol/l perchloric acid. Pellets were then solubilized in 0.3 mol/l NaOH acid (Sigma Aldrich, Chesnes, France), incubated at 37 °C for 1 h, and protein concentrations were determined in an aliquot using bicinchoninic acid (15). Proteins were precipitated again at 4 °C with 1.99 mol/l perchloric acid overnight. Then, samples were centrifuged
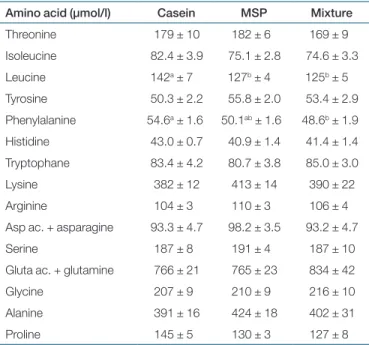
table 1 Postabsorptive plasma amino acid concentrations
Amino acid (µmol/l) Casein MSP Mixture
Threonine 179 ± 10 182 ± 6 169 ± 9 Isoleucine 82.4 ± 3.9 75.1 ± 2.8 74.6 ± 3.3 Leucine 142a ± 7 127b ± 4 125b ± 5 Tyrosine 50.3 ± 2.2 55.8 ± 2.0 53.4 ± 2.9 Phenylalanine 54.6a ± 1.6 50.1ab ± 1.6 48.6b ± 1.9 Histidine 43.0 ± 0.7 40.9 ± 1.4 41.4 ± 1.4 Tryptophane 83.4 ± 4.2 80.7 ± 3.8 85.0 ± 3.0 Lysine 382 ± 12 413 ± 14 390 ± 22 Arginine 104 ± 3 110 ± 3 106 ± 4
Asp ac. + asparagine 93.3 ± 4.7 98.2 ± 3.5 93.2 ± 4.7
Serine 187 ± 8 191 ± 4 187 ± 10
Gluta ac. + glutamine 766 ± 21 765 ± 23 834 ± 42
Glycine 207 ± 9 210 ± 9 216 ± 10
Alanine 391 ± 16 424 ± 18 402 ± 31
Proline 145 ± 5 130 ± 3 127 ± 8
Male Wistar rats were fed ad libitum during 5 weeks with a high-fat high-sucrose diet and were then fed a restricted amount of a high-protein diet containing either casein, milk soluble proteins (MSP), or a 50/50 mixture of both (n = 10 per group) for 3 weeks. Mean values (± s.e.) obtained for postabsorptive amino acid con-centrations are given. a, b, c: when a significant group effect was detected, means were affected with letters: means affected by the same letter were not significantly different (P < 0.05).
(10,000g, 5 min, 4 °C) and RNA content was determined spectro-photometrically in the supernatant as previously described (13). The protein pellet was hydrolyzed in 6 mol/l HCl at 110 °C for 48 h. The 13C
enrichment of free valine was determined as its t-butyldimethylsilyl derivative with gas chromatography/mass spectrometry (GC-MS): gas chromatograph (HP-5890) coupled to a organic quadrupole mass spectrometer (HP-5972; Hewlett-Packard, Paris, France) operated under electron impact ionization. The ions m/z 288 and 289 were monitored by selective ion recording. The enrichment of [13C]valine
into protein was determined as its N-acetyl-propyl derivative by gas chromatography-combustion-isotope ratio mass spectrometry (GC-C-IRMS, Micromass Isochrom II, Fisons Instruments, Middlewitch, UK) which measured the 13CO
2/12CO2 ratio.
Calculations. In vivo fractional synthesis rates (FSR, %.d−1) of tissue proteins were calculated as: FSR = 100 × (EP − EN)/(EA × t) where t is the incorporation time, expressed in days, EP and EA are the 13C enrichments at the end of the incorporation time of protein-bound valine and of free valine respectively. Incorporation time was deter-mined for each rat as the difference between the time of injection and the time of exsanguination and averaged 20.6 ± 0.2 min (mean ± s.e.). EN is an estimation of the natural 13C enrichment of protein-bound valine and was determined in samples from rats not injected with the flooding dose (two rats/group). EP, EN, and EA were expressed in AP (atom %). The absolute synthesis rate was calculated from the product of FSR and tissue protein content and expressed in milligram or gram per day. Ribosomal capacity was estimated as the ratio of RNA to pro-tein (mg RNA/g propro-tein) because most of the RNA in tissues are ribo-somal. Translational efficiency was calculated as the amount of protein synthesized (mg) per day per mg RNA.
urine and feces collection and nitrogen, 3-methyl-histidine and creatinine measurements
On each day of urine collection, 5 ml of 1 mol/l HCl was added to the empty tube as a preservative. A new tube was used every day. Urine and feces collected during the last 4 days of the high-fat feeding period, and during the 1st, 2nd, and 3rd week of energy restriction were pooled for each period, kept at +4 °C and frozen at −20 °C as soon as the last sample was added. The nitrogen content in urine and feces was measured with the Kjeldhal method and the protein balance was calculated as the difference between the amount of ingested protein and of protein ( nitrogen × 6.25) excreted in urine and feces. The urine 3-methyl- histidine content was measured after deproteinization with 2% sulfosalicylic acid and hydrolysis with 6 mol/l HCl at 110 °C for 2 h by liquid chromato graphy with an automatic amino acid analyzer. The urine creatinine content was obtained after reaction with picric acid and measurement of absorbance at 492 nm (kit ABX, Montpellier, France).
Plasma assays
Plasma insulin levels were quantified using a commercial RIA kit (LINCO Research, Labodia, France). All other plasma measurements were performed using commercial kit from Horiba ABX (Montpellier, France): glucose using an enzyme-linked procedure based on a glucose oxidase/peroxidase method, triglycerides, enzymatically, total choles-terol, and high-density lipoprotein cholescholes-terol, colorimetrically, with a cholesterol oxidase method “CHOD-PAP” (16).
Plasma amino acids were purified by ion exchange chromatography after protein precipitation as previously described (13). Norleucine was added as an internal standard. Amino acid concentrations were deter-mined by ion exchange chromatography on an HPLC system (Biotek instruments, St Quentin en Yvelines, France) using post-column derivatization with ninhydrine.
statistical analysis
Values are presented as means ± s.e. Statistical evaluation of the data was performed by variance analysis or repeated measure variance analysis. When significant effects were detected, means were compared
with Tukey post-test (SAS, SAS Institute, Cary, NC). The level of signifi-cance was set at P < 0.05.
results
Food and protein intake
Food intake was not different between groups during the high-fat high-sucrose feeding period, before energy restriction (Figure 1). Then, we drastically reduced the amount of food given to the rats and food intake (as well as energy intake) remained significantly lower than during the high-fat feed-ing period (Figure 1). Durfeed-ing energy restriction, small (4 to 11%) but significant differences in food intake were observed between groups (Figure 1). Mean food intakes over the restric-tion period were: mix: 10.98 ± 0.13; casein: 10.55 ± 0.06; MSP: 9.78 ± 0.10 g dry matter per day. These differences were signifi-cant because of the very low standard error. Indeed, rats were severely restricted and food intake was globally homogenous. Overall, the biggest difference was between the mix and the MSP group. However, for all the other measured parameters, no significant difference was observed between these two groups, except for fecal nitrogen excretion, which was proportional to casein intake and not to food intake. Thus, we believe that these differences in food intake had little physiological impact.
Similarly, protein intake before energy restriction was homogenous between groups (Figure 1). Protein intake was
Food intake 0 2 4 6 8 10 12 14 16 18 20 g Dry matter * * * * * * † † † †† † † † † † † Protein intake 0.0 0.5 1.0 1.5 2.0 2.5 3.0 3.5 4.0 4.5 g protein * * * * * † † † † † †† † † † † † Days Casein MSP Mixture −5 0 5 10 15 20 25
Figure 1 Evolution of food and protein intake before and during energy
restriction. Male Wistar rats were fed ad libitum during 5 weeks with a high-fat high-sucrose diet and were then fed a restricted amount of a high-protein diet containing either casein, milk soluble proteins (MSP), or a 50/50 mixture of both (n = 10 per group) for 3 weeks. A semi-liquid diet was used. Food intake was measured every day (beginning 4 days before energy restriction) after drying and measuring dry matter content of the diet. Means (± s.e.) obtained in each group are presented. *MSP < Cas = Mix; †All means are significantly different (P < 0.05).
then significantly decreased during the first 3 days of restric-tion. However, since restricted diets were high in proteins, it became significantly higher from days 4–21 of the restric-tion period than during the high-fat diet. Over the restricrestric-tion period, mean protein intakes were: mix: 3.51 ± 0.04; casein: 3.33 ± 0.02; MSP: 3.16 ± 0.03 g/day. Although very close (5 to 10% difference), these values were significantly different. Body weight
Body weight (Figure 2) increased steadily during the high-fat high-sucrose feeding period (6.3 g/day). Energy restriction induced not only an arrest in rat growth but also a signifi-cant 7.5% decrease in body weight. Considering each day of measurement, no significant difference in body weight was observed between groups. However, during the period of energy restriction, a significant interaction was detected between time and group. It could be due to the fact that body weight seemed to decrease slightly faster in the MSP group than in the two other groups and could be associated to the slight differences in food intake.
tissue weights
The weights of peri-renal and peri-genital adipose tissue deposit, liver, hindlimb muscles (individually or the sum of all of them) and kidney were not different between groups at the end of the energy restriction period (Figure 3). For the spleen, there was only a trend (P = 0.07) for an effect. Just the weight of the intestine varied significantly and was higher in the casein group than in the other two groups (Figure 3). When expressed as the percent body weight, no significant group effect was observed in any tissue (data not shown). There was also no effect on the weight of the individual hindlimb muscles (data not shown).
Plasma measurements
Plasma amino acid concentrations measured in the postab-sorptive state at the end of the restriction period (Table 1) were not different between groups except for leucine (cas > MSP = Mix) and phenylalanine (Cas > Mix; MSP = Cas; MSP = Mix).
Concentration of all other measured parameters (glucose, insulin, triglycerides, total cholesterol, high-density lipo-protein cholesterol, and low-density lipolipo-protein cholesterol) did not differ between groups (See Supplementary Table S2 online).
urinary measurements
Urinary measurements were performed during four periods: the last four days of the high-fat diet, and the 1st, 2nd, and 3rd week of energy restriction.
Nitrogen balance. Compared to the high-fat feeding period, pro-tein intake was first significantly reduced during the first week of energy restriction and then significantly increased during the week 2 and 3. As previously mentioned, it was not homogenous between groups (Table 2).
Compared to the high-fat feeding period, the excretion of proteins (nitrogen × 6.25) in urine was significantly increased during energy restriction, even during the first week when the protein intake was low. There was no significant difference between groups in urine protein excretion (nitrogen × 6.25) despite the differences in protein intake.
Body weight 300 320 340 360 380 400 420 440 460 480 −50 −40 −30 −20 −10 0 10 20 30 Days g Casein MSP Mixture *
Figure 2 Evolution of body weight before and during energy restriction.
Male Wistar rats were fed ad libitum during 5 weeks with a fat high-sucrose diet and were then fed a restricted amount of a high-protein diet containing either casein, milk soluble proteins (MSP), or a 50/50 mixture of both (n = 10 per group) for 3 weeks. Body weight was recorded three times a week during the whole experiment. Means (± s.e.) obtained in each group are presented. There was no significant difference between groups. *P < 0.05 vs. before energy restriction for all groups at all dates.
Tissue weight 0 5 10 15 20 25 30
Fat deposits Liver Intestine
g Casein MSP Mixture a b ab 1 2 3 4
Muscles Kidney Spleen
Figure 3 Tissue weights. Male Wistar rats were fed ad libitum during 5 weeks with a high-fat high-sucrose diet and were then fed a restricted amount
of a high-protein diet containing either casein, milk soluble proteins (MSP), or a 50/50 mixture of both (n = 10 per group) for 3 weeks. Final weights of peri-renal and peri-genital adipose tissues (=fat deposits), liver, intestine, gastrocnemius, extensor digitorum longus (EDL), tibialis anterior and soleus muscle (=Muscle), kidney and spleen were measured. Means (± s.e.) obtained in each group are presented. a, b, c: means affected with the same letter are not significantly different (P < 0.05).
Compared to the high-fat feeding period, fecal excretion of proteins (nitrogen × 6.25) was first significantly reduced during week 1, and then significantly increased during week 2 and 3 in all groups. It was also significantly different between all groups during week 1, 2, and 3 of energy restriction with the highest value in casein group, intermediate in the mix group, and low-est in the MSP group. Thus, the apparent diglow-estibility (=100 × (ingested proteins − excreted proteins in feces)/ingested pro-teins), was lower in the casein group (88%) than in the other groups (93%).
Finally, nitrogen balance was significantly reduced during the first week of energy restriction compared to the high-fat feeding period but remained positive in all groups. During week 2, it was still significantly lower than during the high-fat feeding period but then it tended to be higher (P = 0.06) during week 3. There were no significant differences between groups.
3-Methyl-histidine excretion. Overall, energy restriction induced a decrease in 3-methyl-histidine excretion (significant effect of time). There was no significant group effect; however there was a significant interaction between the effect of time and group. Indeed, during the first week of energy restriction, 3-methyl-histidine excretion decreased only in casein fed rats whereas it remained stable in the other two groups. It was then reduced to the same value in all groups during week 2 and 3 (Figure 4).
edl and liver protein metabolism
EDL muscle weight, total protein mass, and ribosomal capac-ity were not different between groups at the end of the experi-mental period (Table 3). However, EDL protein synthesis rates expressed either as fractional synthesis rates (FSR), absolute synthesis rates (ASR) or in term of ribosomal efficiency were significantly higher in the casein group than in the other two groups (Table 3).
In liver, weight, total protein, ribosomal capacity, FSR, ASR, and ribosomal efficiency were not different between groups (Table 4).
dIscussIon
The aim of this work was to compare the capacity of casein, a slowly digested protein, and MSPs (rapidly digested) to pre-vent the loss of lean body mass induced by energy restriction. We followed the evolution of nitrogen balance during 3 weeks of energy restriction in overweight rats fed with casein, MSP or a mixture of both and measured final protein metabolism in liver and muscle. Although protein metabolism adaptation was probably different depending on the nature of the ingested proteins, there were no differences, week per week, in nitrogen balance and in final liver and muscle protein mass.
Nitrogen balance can be precisely measured in rats using metabolic cages. Using a semi-liquid diet, given the configura-tion of the trough, no spillage is possible, and dry matter intake table 2 nitrogen balance
Group
HF feeding Dietary restriction RMVA
S. Eff.
Last 4 days Week 1 Week 2 Week 3
Protein ingested (g/day) Cas 2.46 ± 0.06 2.31a ± 0.01 3.76a ± 0.01 4.06a ± 0.03 T, G, T × G
MSP 2.44 ± 0.07 2.00b ± 0.05 3.67b ± 0.02 3.92a ± 0.04
Mix 2.44 ± 0.05 2.46c ± 0.02 3.93c ± 0.04 4.23b ± 0.07
All 2.45 2.25* 3.79* 4.07*
Protein excreted in urine (g/day) Cas 1.48 ± 0.07 1.98 ± 0.07 2.80 ± 0.06 2.83 ± 0.15 T
MSP 1.43 ± 0.06 1.75 ± 0.06 2.80 ± 0.10 2.65 ± 0.17
Mix 1.46 ± 0.06 2.06 ± 0.05 2.93 ± 0.11 2.81 ± 0.17
All 1.46 1.93* 2.84* 2.76*
Protein excreted in feces (g/day) Cas 0.26 ± 0.01 0.29a ± 0.01 0.45a ± 0.02 0.42a ± 0.02 T, G, T × G
MSP 0.26 ± 0.01 0.18b ± 0.01 0.28b ± 0.02 0.23b ± 0.01
Mix 0.26 ± 0.01 0.24c ± 0.01 0.38c ± 0.01 0.33c ± 0.01
All 0.26 0.24* 0.37* 0.33*
Protein retained (g/day) Cas 0.72 ± 0.05 0.04 ± 0.07 0.51 ± 0.05 0.80 ± 0.17 T
MSP 0.76 ± 0.07 0.07 ± 0.04 0.60 ± 0.08 1.04 ± 0.16
Mix 0.72 ± 0.06 0.16 ± 0.06 0.60 ± 0.11 1.09 ± 0.19
All 0.73 0.09* 0.57* 0.98†
Male Wistar rats were fed ad libitum during 5 weeks with a high-fat high-sucrose diet (=HF feeding) and were then fed a restricted amount of a high-protein diet con-taining either casein (Cas), milk soluble proteins (MSP), or a 50/50 mixture of both (n = 10 per group) for 3 weeks. Urine and feces were collected continuously from 4 days before the restriction to the end of the restriction period, samples were pooled before the restriction and then per week of restriction. Nitrogen content of urine and feces were measured and used to calculate nitrogen balance (=protein retained) calculated as the difference between the ingested proteins and the protein (N × 6.25) excreted in urine and feces. Mean values (± s.e.) obtained per week for each group are presented. In addition, mean values obtained for all the rats (=All) were calculated. Data were analyzed by repeated measure variance analysis (=RMVA) to analyze the effect of time (T), of group (G) and the interaction (T×G). Significant main effects (=S. Eff.) are given. a, b, c: means affected with the same letter are not significantly different (P < 0.05). *P < 0.05 vs. before energy restriction. †P = 0.06 vs. before energy restriction.
can be precisely measured. Urine and feces are also completely collected. It gave us a sensitive and precise measurement of the evolution of body protein mass (the overall balance between body protein synthesis and body protein degradation) during energy restriction. We showed that there was no difference between groups. Despite the results obtained in normally fed humans showing different postprandial short-term nitrogen utilization with casein or MSP (4–6), after 3 weeks of energy restriction, rats could adapt to maintain their body protein mass similarly independently of the nature of protein ingested.
This result is concordant with what is observed for postab-sorptive liver protein metabolism. Liver protein contents and synthesis rates were not different after 3 weeks of feeding with the different proteins, although the delivery of amino acids to this organ must have been very different with casein and MSP. To our knowledge, no similar studies investigated liver pro-tein metabolism response to casein or MSP, in particular dur-ing energy restriction. Other nitrogen sources were compared
(whey vs. peptide hydrolysate; casein vs. soy protein; casein vs. amino acid mixture…) and there was often little effects on rat liver metabolism (17,18). Other studies directly compared casein and whey as protein sources (15–30%) in rats during 2 to 7 weeks and measured liver weight, obtaining conflicting results (19–21). Thus it seems that for a same total amount of proteins, liver can adapt to different timing of protein intake during energy restriction.
Given the slow growth rate of muscle, it was unlikely to obtain a significant effect on muscle protein mass after only 3 weeks of consumption of different proteins. However, if one of the tested proteins had allowed a better preservation of muscle mass, it could have been detected by nitrogen balance because it is cumulating all body muscles, which represent the main component of the total body protein mass. Since nitrogen balance was unchanged between groups, and since there was no tendency in any muscle sampled, it is likely that the nature of the ingested proteins had no effect on muscle protein mass. However, postabsorptive muscle protein synthesis rates were 20 to 30% higher in casein fed rats than in the other groups. Such a result may seem surprising, but muscle protein mass is the result of the balance between protein synthesis and protein degradation, and protein degradation can also be regulated. In addition, our method gives a measurement of protein synthesis rates representative over 20 min. It does not tell what were these rates in the fed state, at the beginning of the postabsorptive state, or during the first and the second week of energy restric-tion. Several possibilities could lead to the observed results. To our knowledge, there are little similar experiments to compare with. However, by analogy with the results obtained by Pacy
et al. in humans (22) with different levels of proteins, although
in our case total protein intake did not change, it is tempt-ing to propose that the difference between postprandial and postabsorptive muscle protein synthesis rates could be high table 3 edl muscle protein metabolism
EDL Casein MSP Mixture
Weight mg 173 ± 4 169 ± 4 175 ± 3 Total protein mg 30.3 ± 0.7 28.8 ± 1.1 28.0 ± 0.7 Ribosomal capacity mg/g prot 9.7 ± 0.4 10.3 ± 0.9 11.2 ± 0.6 FSR %/day 3.3a ± 0.2 2.4b ± 0.1 2.7b ± 0.2 ASR mg/day 1.0a ± 0.1 0.7b ± 0.1 0.8b ± 0.1 Ribosomal
efficiency mg/(day·mg RNA) 3.3
a ± 0.2 2.4b ± 0.2 2.5b ± 0.3
Male Wistar rats were fed ad libitum during 5 weeks with a high-fat high-sucrose diet and were then fed a restricted amount of a high-protein diet containing either casein, milk soluble proteins (MSP), or a 50/50 mixture of both (n = 10 per group) for 3 weeks. In vivo protein synthesis rates were measured in the postabsorptive state and ribosomal capacity (mg total RNA/g prot), fractional synthesis rates (FSR), absolute synthesis rates (ASR), ribosomal efficiency (=the amount of pro-tein synthesized per day and per mg RNA) were calculated. Mean values (± s.e.) obtained in each group are presented. a, b, c: means affected with the same letter are not significantly different (P < 0.05).
table 4 liver protein metabolism
Liver Casein MSP Mixture
Weight g 9.8 ± 0.3 9.6 ± 0.5 9.5 ± 0.2 Total protein g 2.2 ± 0.1 2.1 ± 0.1 2.1 ± 0.1 Ribosomal capacity mg/g prot 39.2 ± 1.8 41.4 ± 1.1 37.7 ± 1.5 FSR %/day 46.0 ± 1.8 45.0 ± 0.6 48.0 ± 0.9 ASR g/day 1.0 ± 0.1 0.9 ± 0.1 1.0 ± 0.1 Ribosomal
efficiency mg/(day·mg RNA) 11.6 ± 0.7 10.8 ± 0.3 13.0 ± 0.9
Male Wistar rats were fed ad libitum during 5 weeks with a high-fat high-sucrose diet and were then fed a restricted amount of a high-protein diet containing either casein, milk soluble proteins (MSP), or a 50/50 mixture of both (n = 10 per group) for 3 weeks. In vivo protein synthesis rates were measured in the postabsorptive state and ribosomal capacity (mg total RNA/g prot), fractional synthesis rates (FSR), absolute synthesis rates (ASR), and ribosomal efficiency (=the amount of protein synthesized per day and per mg RNA) were calculated. Mean values (± s.e.) obtained in each group are presented. There were no significant differ-ences between groups.
3-Methyl-histidine 0 5 10 15 20 25 30
HF feeding Week 1 Week 2 Week 3
nmol/µmol creat
Casein MSP Mixture
Figure 4 Evolution of 3-Methyl-histidine excretion before and during
energy restriction. Male Wistar rats were fed ad libitum during 5 weeks with a high-fat high-sucrose diet (=HF feeding) and were then fed a restricted amount of a high-protein diet containing either casein (Cas), milk soluble proteins (MSP), or a 50/50 mixture of both (n = 10 per group) for 3 weeks. Urine was collected continuously from 4 days before the restriction to the end of the restriction period. Samples were pooled before the restriction and then per week of restriction. Urine 3-methyl-histidine and creatinine contents were measured. Means (± s.e.) of 3-methyl-histidine excretion (nmol) per µmol creatinine obtained per week in each group are presented. Data were analyzed by repeated measure variance analysis to analyze the effect of time, group and the interaction. There was a significant effect of time and an interaction time × group.
with MSP, and low with casein. This would lead to the results observed (no difference in final muscle weights, lower postab-sorptive muscle protein synthesis in MSP rats when compared to casein rats), and is consistent with the described short-term effects of casein and MSP in normally fed humans (4–6).
3-Methyl-histidine, a cumulative index of whole-body muscle proteolysis, indicates that mean 24 h rates were simi-lar in all groups during the 3 weeks of the restriction period. However, differences in postprandial and postabsorptive rates between groups remain possible.
Few differences between groups were observed in measured plasma postabsorptive amino acid contents. Only phenyla-lanine and leucine concentrations significantly differed. Casein contains 29% more phenylalanine than MSP (plasma pheny-lalanine content tended to be higher in the casein group than in the other groups), and 33% less leucine (although plasma leucine level was higher in the casein group than in the other groups). Casein and MSP differ in amino acid composition by >25% for several other amino acids: alanine, arginine, histidine, lysine, tyrosine, proline, serine, tryptophane. Despite these differences, the resulting plasma amino acid contents were similar in all groups. This shows that it is the result not only of the ingested amount but also of a complex regulation (path-ways of utilization, size of the free pools), particularly in the postabsorptive state. However, it is striking to see that plasma leucine level was higher in the casein group. Leucine is at the same time an essential amino acid and a regulator of protein synthesis (8). In addition, the organism has to maintain very low tissue concentrations of the potentially toxic branched-chain, aromatic and sulfur amino acids, so the capacity of the pathways of oxidative catabolism of these particular amino acids adapts to match the habitual protein intakes (23). We can hypothesize that the high plasma leucine content observed with MSP induced higher muscle protein synthesis rates in the postprandial state, but also a higher capacity to oxidize leucine; thus in the postabsorptive state there would have less leucine available to sustain muscle protein synthesis in the postpran-dial state. This mechanism could explain the regulation of muscle protein synthesis rates.
The only studied tissue where a specific increase of weight was observed in response to casein feeding is intestine. It is possible that the slight differences in food intake contrib-uted to this result but comparing with mix fed rats, this effect seemed rather proportional to casein intake. Such an effect of casein on intestine weight was also observed in reared rat pups (24). The mechanism of this intestine growth stimulation remains unclear. Could it be due to bioactive peptides? Is it the result of a delay in digestion which stimulates intestine activ-ity? In any case, the amount of nitrogen excreted in feces was also different between groups, with the highest values in the casein group, intermediate values in the mix group, and low-est values in the MSP group. Although these differences could partly be explained by differences in protein intake, it seemed more in relation with casein intake: the highest protein intake did not correspond to the highest fecal excretion whereas the highest casein intake did. Whether this nitrogen originates
from endogenous secreted proteins (in relation with increased intestine weight?) or from undigested protein is questionable. It was shown that 6 h after a single test meal, a higher propor-tion of ingested nitrogen was present in the caecum of casein fed rats than in the one of MSP fed rats. But the authors did not exclude that this could result from an early delivery of dietary nitrogen from the caecum to the colon in the case of MSP (25). In the present experiment, the higher fecal nitrogen excretion was partly compensated for by differences in protein intake and was not sufficient to induce differences in nitrogen balance.
In conclusion, although it was shown in normally fed humans that the postprandial short-term utilization of casein and MSP are different (4–6), in overweight energy restricted rats, we showed that, in the long term, the evolution of the body pro-tein mass during energy restriction was the same whatever the protein used. Thus, to minimize the loss of lean body mass during energy restriction, it is important to provide a sufficient amount of proteins, but it seems that the timing and/or the nature of protein intake has no impact.
suPPleMentarY MaterIal
Supplementary material is linked to the online version of the paper at http:// www.nature.com/oby
acKnowledgMents
We thank Christian Lafarge and Philippe Lhoste for animal management, Corinne Pouyet and Estelle Pujos for mass spectrometry measurements, Claire Sornet, Marie-Laure Bax, Noureddine Hafnaoui, Fabienne Béchereau, and Anna Turek for technical help, and Blandine Comte for English editing. This project was supported by French National Research Agency, and by the “Centre National Interprofessionnel de l’Economie Laitière”.
dIsclosure
The authors declared no conflict of interest.
© 2010 The Obesity Society reFerences
1. Chaston TB, Dixon JB, O’Brien PE. Changes in fat-free mass during significant weight loss: a systematic review. Int J Obes (Lond) 2007;31:743–750. 2. Mahon AK, Flynn MG, Stewart LK et al. Protein intake during energy restriction: effects on body composition and markers of metabolic and cardiovascular health in postmenopausal women. J Am Coll Nutr 2007;26:182–189.
3. Mosoni L, Mirand PP. Type and timing of protein feeding to optimize anabolism. Curr Opin Clin Nutr Metab Care 2003;6:301–306. 4. Boirie Y, Dangin M, Gachon P et al. Slow and fast dietary proteins
differently modulate postprandial protein accretion. Proc Natl Acad Sci USA 1997;94:14930–14935.
5. Lacroix M, Bos C, Léonil J et al. Compared with casein or total milk protein, digestion of milk soluble proteins is too rapid to sustain the anabolic postprandial amino acid requirement. Am J Clin Nutr 2006;84:1070–1079. 6. Dangin M, Guillet C, Garcia-Rodenas C et al. The rate of protein digestion
affects protein gain differently during aging in humans. J Physiol (Lond) 2003;549:635–644.
7. Mosoni L, Valluy MC, Serrurier B et al. Altered response of protein synthesis to nutritional state and endurance training in old rats. Am J Physiol 1995;268:E328–E335.
8. Dardevet D, Sornet C, Balage M, Grizard J. Stimulation of in vitro rat muscle protein synthesis by leucine decreases with age. J Nutr 2000;130:2630–2635.
9. Rieu I, Magne H, Savary-Auzeloux I et al. Reduction of low grade inflammation restores blunting of postprandial muscle anabolism and limits sarcopenia in old rats. J Physiol (Lond) 2009;587:5483–5492.
10. Balage M, Averous J, Rémond D et al. Presence of low-grade inflammation impaired postprandial stimulation of muscle protein synthesis in old rats.
11. Marzani B, Balage M, Vénien A et al. Antioxidant supplementation restores defective leucine stimulation of protein synthesis in skeletal muscle from old rats. J Nutr 2008;138:2205–2211.
12. Shoelson SE, Herrero L, Naaz A. Obesity, inflammation, and insulin resistance. Gastroenterology 2007;132:2169–2180.
13. Adéchian S, Giardina S, Rémond D et al. Excessive energy intake does not modify fed-state tissue protein synthesis rates in adult rats. Obesity
(Silver Spring) 2009;17:1348–1355.
14. Halton TL, Hu FB. The effects of high protein diets on thermogenesis, satiety and weight loss: a critical review. J Am Coll Nutr 2004;23:373–385. 15. Smith PK, Krohn RI, Hermanson GT et al. Measurement of protein using
bicinchoninic acid. Anal Biochem 1985;150:76–85.
16. Deeg R, Ziegenhorn J. Kinetic enzymic method for automated determination of total cholesterol in serum. Clin Chem 1983;29:1798–1802.
17. Daenzer M, Petzke KJ, Bequette BJ, Metges CC. Whole-body nitrogen and splanchnic amino acid metabolism differ in rats fed mixed diets containing casein or its corresponding amino acid mixture. J Nutr 2001;131:1965–1972.
18. Deglaire A, Fromentin C, Fouillet H et al. Hydrolyzed dietary casein as compared with the intact protein reduces postprandial peripheral, but not whole-body, uptake of nitrogen in humans. Am J Clin Nutr 2009;90: 1011–1022.
19. Royle PJ, McIntosh GH, Clifton PM. Whey protein isolate and glycomacropeptide decrease weight gain and alter body composition in male Wistar rats. Br J Nutr 2008;100:88–93.
20. Morifuji M, Sakai K, Sanbongi C, Sugiura K. Dietary whey protein increases liver and skeletal muscle glycogen levels in exercise-trained rats. Br J Nutr 2005;93:439–445.
21. Zhang X, Beynen AC. Lowering effect of dietary milk-whey protein v. casein on plasma and liver cholesterol concentrations in rats. Br J Nutr 1993;70:139–146.
22. Pacy PJ, Price GM, Halliday D, Quevedo MR, Millward DJ. Nitrogen homeostasis in man: the diurnal responses of protein synthesis and degradation and amino acid oxidation to diets with increasing protein intakes. Clin Sci 1994;86:103–116.
23. Joint WHO/FAO/UNU Expert Consultation. Protein and amino acid requirements in human nutrition. World Health Organ Tech Rep Ser 2007;(935):1–265.
24. Yajima T, Kanno T, Katoku Y, Kuwata T. Gut hypertrophy in response to the ratios of casein and whey protein in milk formulas in artificially reared rat pups. Biol Neonate 1998;74:314–322.
25. Lacroix M, Leonil J, Bos C et al. Heat markers and quality indexes of industrially heat-treated. J Agric Food Chem 2006;54: 1508–1517.