Publisher’s version / Version de l'éditeur:
Journal of Testing and Evaluation, 39, 3, pp. 358-374, 2011-05-01
READ THESE TERMS AND CONDITIONS CAREFULLY BEFORE USING THIS WEBSITE.
https://nrc-publications.canada.ca/eng/copyright
Vous avez des questions? Nous pouvons vous aider. Pour communiquer directement avec un auteur, consultez la première page de la revue dans laquelle son article a été publié afin de trouver ses coordonnées. Si vous n’arrivez pas à les repérer, communiquez avec nous à [email protected].
Questions? Contact the NRC Publications Archive team at
[email protected]. If you wish to email the authors directly, please see the first page of the publication for their contact information.
NRC Publications Archive
Archives des publications du CNRC
This publication could be one of several versions: author’s original, accepted manuscript or the publisher’s version. / La version de cette publication peut être l’une des suivantes : la version prépublication de l’auteur, la version acceptée du manuscrit ou la version de l’éditeur.
For the publisher’s version, please access the DOI link below./ Pour consulter la version de l’éditeur, utilisez le lien DOI ci-dessous.
https://doi.org/10.1520/JTE103023
Access and use of this website and the material on it are subject to the Terms and Conditions set forth at
A test protocol to quantify the uplift resistance of adhesive applied roofing specimens subjected to tensile loading
Baskaran, B. A.; Current, J.; Tanaka, H.
https://publications-cnrc.canada.ca/fra/droits
L’accès à ce site Web et l’utilisation de son contenu sont assujettis aux conditions présentées dans le site LISEZ CES CONDITIONS ATTENTIVEMENT AVANT D’UTILISER CE SITE WEB.
NRC Publications Record / Notice d'Archives des publications de CNRC:
https://nrc-publications.canada.ca/eng/view/object/?id=b188e414-f4f3-4ca6-a86a-3790ab3f8c91 https://publications-cnrc.canada.ca/fra/voir/objet/?id=b188e414-f4f3-4ca6-a86a-3790ab3f8c91
http://www.nrc-cnrc.gc.ca/irc
A t e st prot oc ol t o qua nt ify t he uplift re sist a nc e of a dhe sive a pplie d roofing spe c im e ns subje c t e d t o t e nsile loa ding
N R C C - 5 4 4 3 9
B a s k a r a n , A . ; C u r r e n t , J . ; T a n a k a , H .
M a y 2 0 1 1
A version of this document is published in / Une version de ce document se trouve dans:
Journal of Testing and Evaluation, 39, (3), pp. 358-374, May 01, 2011, DOI:
10.1520/JTE103023
The material in this document is covered by the provisions of the Copyright Act, by Canadian laws, policies, regulations and international agreements. Such provisions serve to identify the information source and, in specific instances, to prohibit reproduction of materials without
written permission. For more information visit http://laws.justice.gc.ca/en/showtdm/cs/C-42
Les renseignements dans ce document sont protégés par la Loi sur le droit d'auteur, par les lois, les politiques et les règlements du Canada et des accords internationaux. Ces dispositions permettent d'identifier la source de l'information et, dans certains cas, d'interdire la copie de
A Test Protocol to Quantify the Uplift Resistance
of
Adhesive Applied Roofing Specimens Subjected Tensile Loading
A. BaskaranNational Research Council, 1200 Montreal Road, Ottawa, ON, Canada, K1A 0R6
Corresponding [email protected] J. Current and H.Tanaka
Department of Civil Engr, University of Ottawa, Ottawa, ON, Canada, K1N 6N5
Abstract
Adhesive Applied Roofing Systems (AARS), a new generation of Built-Up Roofs, are gaining popularity in North American low slope application. AARS uses no fasteners and all components (e.g. deck, vapour barrier, insulation board and membrane) are integrated by use of adhesives. As there are no metal fasteners, AARS can offer an advantage of reduction in condensation and thermal bridges for the roof assemblies. Even though, AARS have been in use, there have been no standard exists to quantify its wind-uplift performances. An industries-university-Canadian government collaborative research project, “Development of Wind Uplift Standard for Adhesive
Applied Low Slope Roofing System”, has been initiated with three major tasks:
experimental investigation, formulation of a numerical model and development of wind design guide and standards. This paper documents a standardized small scale laboratory test method for quantification of uplift resistance subject to tensile loading. As part of Task 1 of the project, this systematic investigation focuses on three key parameters loading rate, specimen size and end condition. Investigations were completed by constructing over 400 specimens. Both the maximum uplift resistance and consistence in the failure plane are equally considered during the test method standardization. Data from this small scale testing can facilitate roofing industries to
optimize the material combinations such that the uplift resistance data can be used as an indicator before performing full-scale wind uplift testing.
Keywords: AARS, Adhesive, Tensile Force, Uplift Resistance, Roofing, Failure Plane
Introduction
Roofs are essential for the protection of building inhabitants and contents from temperature fluctuations, wind, snow, rain, and ultraviolet rays. Built-Up Roofs (BUR) are common in Canada. BUR systems use layers of roofing felts with bituminous material or hot asphalt (Baker, 1964). Adhesive Applied Roofing Systems (AARS) are one of the alternatives to the BUR systems and the focus of the present study. AARS employs the use of cold adhesives as a substitute for asphalt and fasteners. This alleviates some of the main fire, health safety and moisture movement concerns. AARS has several layers: deck provides support for both live and dead loads, vapour barrier is a thin layer that controls vapour movements into the building envelope, insulation prevents the gain and loss of heat helping to keep the interior at a desired temperature, cover boards as an additional layer to protect the thermal insulation and membrane as the waterproofing layer. In the AARS, all these layers are integrated to one another through the use of adhesives to form a compact roof assembly.
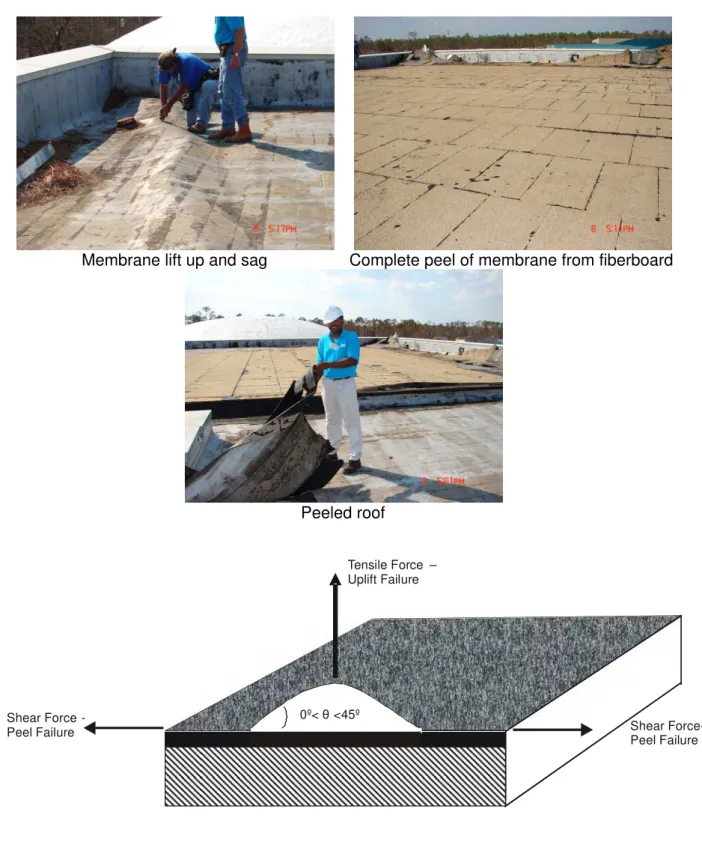
Recent roofing failure investigations after major hurricanes by the Roofing Industry Committee on Weather Issues (RICOWI 2009 and 2010) indicated that shear and tensile loading are the fundamental forces caused by wind which lead to roofing failure (Figure 1). Existing North American wind uplift standards (CSA A123.21, FM
4474 and UL 580) mainly focus on mechanically attached and fully bonded roof assemblies. European standards (ETAG 2006 and NBI160 (1996)) also do not address the wind uplift evaluations of the AARS. To develop wind uplift standards for AARS, a collaborative research and development project has been initiated with Natural Sciences and Engineering Council (NSERC). Project partners are Department of Civil Engineering University of Ottawa, National Research Council – Institute for Research in Construction (NRC-IRC), Roofing Industries (Bakor Inc., IKO Industries Ltd, Soprema Inc., and Tremco Inc.) and Roofing Contractor Association of British Columbia (RCABC). AARS project developed the following:
1. A standardized procedure to quantify uplift resistance of AARS specimens subjected to tensile loading.
2. A standardized procedure to quantify peel resistance of AARS specimens subjected to shear loading
3. A standardized procedure to quantify wind uplift resistance of AARS mockups subjected to wind loading
Varieties of experimental configurations were investigated and data were archived by Current et al (2007), Murty, et al (2008a) and Murty, et al. (2008b). Based on these extensive experimental studies, developed test procedures were respectively reported in Current, (2009), Wu, (2008) and Murty (2010). These test procedures have been drafted as work items and are in the process of standardization (ASTM 2010, CSA 2010).
During this research, existing standards were reviewed to find similarities that can be applied to the development of an uplift resistance test for AARS. The idea is that the similarities in variables and conditions found can be transferred to the new standard being developed. In this study, the following standards were reviewed:
• American Society for Testing and Materials (e.g., ASTM D 5179-02)
• European Standards (e.g. EN 1348, 2007)
• International Standards Organization (e.g. ISO 15509, 2001 )
• Single Ply Roofing Industry (e.g. ANSI/SPRI IA-1-2005)
Several transferable standards across organizations were found. For instance, the performance of the adhesive joint should be quantified when loading normal to the plane of adhesion. The test should have one fixed component and one movable component. There should be 2-10 repetitions per test. The peak load attained during the testing must be reported and a description of the failure plane given. There were two areas in which all methods differed; the test shape and area and the mechanism which leads to the failure such as loading criteria or deflection rate. These variables will require experiments to determine optimal parameters for the development of standards. In summary, the review identified that three key parameters need further scrutiny namely: loading rate, specimen size and end condition.
To optimize these three parameters (loading rate, specimen size and end condition) the present experimental approach examines the uplift resistance of bonded roofing components through mechanical separation of bonded layers by applying tensile forces. This paper presents the findings and development of a standardized test method to determine the uplift resistance of AARS systems. This standardized test method is useful to address disengagement of the assembly, either from the substrate or within itself under uplift loading. Data from this small scale testing can facilitate roofing industries to optimize the component combinations such that it can be correlated with the systems/assembly wind uplift resistance. The standard will become an essential tool for the evaluation of AARS performance under tensile loading and can benefit both roofing researchers and manufacturers.
Experimental Setup
There were four different sample sets used throughout these experiments, each provided by a different company. Sample sets 1 and 2 were prepared with full coverage of the adhesives (full adhesion) and sample sets 3 and 4 were prepared with adhesives applied in bedding at specified intervals (partial adhesion). Definitions of full and partial adhesion are also illustrated later on in this paper. For the purposes of this study, “specimen” refers to the roofing sample that is being tested. Each sample consists of a deck, vapour barrier, insulation, cover board, base sheet, and cap sheet.
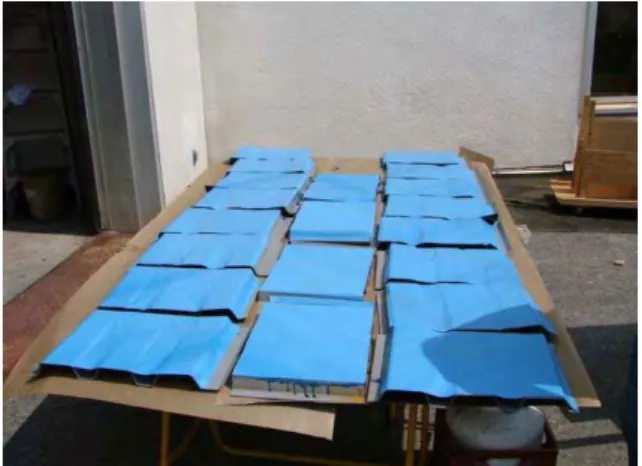
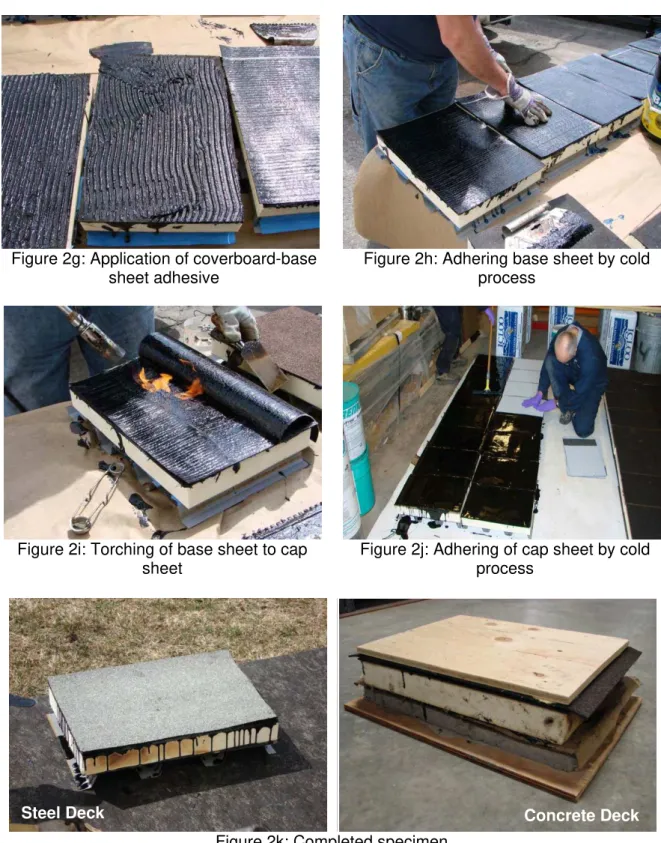
Specimen Preparation: The following steps were taken toward the construction of each specimen sample (Figure 2):
1) Priming the deck
2) Application of deck - vapour barrier adhesive and adhesion of the vapour barrier
3) Application of vapour barrier - insulation adhesive and adhesion of the insulation
4) Application of insulation - cover board adhesive and adhesion of the cover board
5) Application of the cover board - base sheet adhesive and adhesion of the base sheet
6) Application of the base sheet – cap sheet adhesive and adhesion of the cap sheet
Decks
Steel: Specimens of 12” x 18” (300 x 450 mm) or 12” x 36” (300 x 900 mm) in
size were cut from 33ksi tensile strength steel decks. It had 0.03” (0.75 mm) in thickness and a 6” (150 mm) center to center distance between adjacent flutes (Figure 2.a). The reasons for selecting two different widths {18” (450 mm) and 36” (900 mm)} are as follows:
• Steel deck profiles are 6” (150 mm) apart and thus one can select specimen width in multiples of 6” (150 mm)
• Based on that, the minimum specimen width will have 3 flutes. In other words, the minimum width of the specimen will be 18” (450 mm). The maximum tested specimen width had 6 flutes.
• The length of the specimen 12” (300 mm) was established based on the maximum allowable space in the instron machine.
Vapour Barriers
Self-adhering: Also known as “peel & stick” membranes, these vapour barriers
have a polyethylene side and a pressure sensitive adhesive side (Figure 2.b).
Construction/kraft paper: This type of vapour barrier is made up of two pieces
of kraft paper laminated together. It was adhered to the deck with a separate adhesive (Figure 2.c).
Insulation
Specimens of size 12” x 18” (300 x 450 mm) or 12” x 36” (300 x 900 mm) were cut from 4’ x 4’ (1.22 x 1.22 m) boards of 2” (50 mm) thick paper or acrylic faced polyisocyanurate insulation [AC FOAM Type II].
Asphalt core board: This board contains bituminous materials that become
molten with the application of heat and can be torched to secure the base sheet. Approximately 0.2” (5 mm) thick 4’ x 5’ (1.22 x 1.52 m) sheets of manufactured board were used and specimens were cut using a utility knife on the day of specimen construction.
Fiberboard: This board is made up of densely packed wood fibers. It is 12
mm thick and less dense than the asphalt core board. 2’ x 4’ (0.61 mm x 1.22 mm) sheets were cut to the same size with a utility knife on the day of specimen construction.
Base and Cap Sheets
The base and cap sheets are 3’ (990 mm) wide rolls with a 3” (75 mm) “refuse” on one side for overlapping adjacent rolls to create a water tight seal necessary for use in field applications. The cap sheet is a common material used by all sources so the differences from source to source were negligible. Conversely, there were slight differences between the base sheets employed depending on the methodology used by the company.
A base sheet with a higher surface porosity was applied when the base sheet was adhered to the cover board. Both sides of the base sheets were smooth with a bituminous material that would melt upon contact with heat. The base sheets were torched to the cover boards.
Full and Partial Adhesion
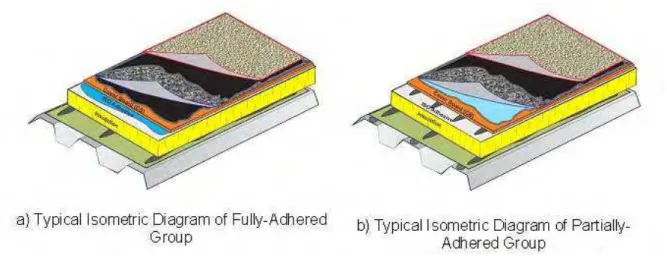
A highly important difference in specimen construction employed from company to company was the use of full or partial adhesion (Figure 3). Some of the industrial partners preferred to fully bond all layers of roofing materials with a layer of adhesive of uniform thickness; this is referred to as full adhesion. Conversely, some of the
industrial partners preferred to bond the roofing materials with strategically placed adhesive beads; this is referred to as partial adhesion. It should be noted that partial adhesion does not infer as poor adhesion. The difference between beading and full adhesion is most relevant between the vapour barrier and the insulation and the cover board and the insulation.
When partial adhesion is applied, it is extremely difficult to quantify the width, breadth and thickness of beads of adhesive, especially once a layer of construction materials has been laid down on top of the adhesive. It is also an unfair comparison to compare the performance of partially-adhered specimens with fully-adhered specimens because of the significant difference in adhesive contact areas between the two. This difference in protocol was taken into account when analyzing the results as it is an unequal comparison of performance.
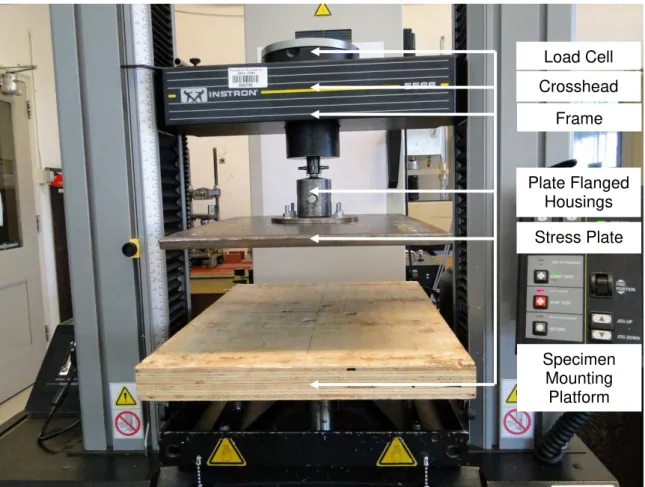
Experimental Apparatus: The components of the experimental apparatus used in this study are as follows (Figure 4):
4502 Series Instron Frame
Stress Plate
Stress Plate Mounting Platform
Specimen Mounting Platform
Steel deck attachment Strips
4502 Series Instron Frame
Used for performing various mechanical tests such as tensile, compressive, shear torsion and bending tests. The frame is controlled by a computer through the use of a Bluehill software pack which allows for defining testing input parameters and publishing of customizable reports which can illustrate an overview of the experimental results and generate graphs.
Crosshead: A linear translating platform that the load cell sits on which allows
for smooth and even transmission of loads directly to the test specimens.
Load cell: A piece of hardware that electronically measures loads and then
transmits a conditioned signal back to a computer for memory storage and future data manipulation.
Plate-flanged housing: Fixed anchors which attach to Instron machine
components.
Stress Plate
12” x 18” x 0.4” (300 x 450 x 9.5 mm) rigid steel plate attached directly to the male component of the top plate-flanged housing which transfers loads from a point source over the full test area of the AARS specimens. Holes were drilled into this plate for easy attachment to and removal from the stress plate mounting platform.
Specimen Mounting Platform
Two pieces of 0.74” (18.75 mm) plywood mechanically attached together with wood screws and fixed to the base of the Instron machine. Since the present study investigated, two different specimen sizes, two different sized platforms were required for testing:
• 15” x 20” (375 x 500 mm) for the 12” x 18” (300 x 450 mm) specimens
• 15” x 39” (375 x 1000 mm) for the 12” x 36” (300 x 900 mm) specimens
Holes were drilled along the perimeter of the platform in the approximate locations of where the female flutes of the roofing specimens would later be placed. The bottom strip that was clamped underneath the platform had a nut
spot-welded in place to the bottom of the strip. The nut on top of the attachment strip had free rotation and was tightened prior to the test to meet the fix-end condition.
Experimental Procedure
There are two main steps involved for the test specimen setup: 1) Proper installation of the specimen in the Instron Frame
2) Instron Machine set up with the correct variables such as loading rate, sampling rate and type of loading.
Specimen Setup
The following protocol, illustrated by Figure 5, was observed for conducting pullout tests on specimens built with a steel deck regardless of specimen size or test speed:
1) Attachment of the stress plate mounting platform
First a stress plate mounting platform was added to each of the prepared specimens. It is a 0.74” (18.75 mm) thick piece of 12” x 18” (300 x 450 mm) or 12” x 36” (300 x 900mm) plywood that was superimposed over top of the roofing specimen. This was done to overcome the lack of rigidity of the cap sheet in order to transfer the applied loads uniformly from the Instron Machine to the test specimens. It was glued with a high-strength two-part polyurethane and epoxy adhesive mix called Millennium adhesive. This created a bond that was stronger than any other bond within the layers of the roofing specimen.
2) Installation of specimen in the bottom frame
Attachment strips were placed in the female flutes of the test specimen. These strips were 15” x 1” x 0.4” (375 x 25 x 10 mm) in size and made
from construction steel. They were over-designed to ensure the steel deck deflections would be minimized. The strips were slid into the female flutes and fixed to the specimen with ¼” (6 mm) hex-head bolts.
• For 12” x 18” (300 x 450 mm) specimens, four strips were required for
fastening and 8 pairs of nuts and bolts
• For 12” x 36” (300 x 900 mm) specimens, seven strips were required
for fastening and 14 pairs of nuts and bolts
The specimen was then placed on the mounting platform. Visual observation ensured proper alignment between the stress plate mounting platform and the stress plate and that the female flutes were aligned with the holes on the specimen mounting platform. ¼” (6 mm) bolts and nuts were used to fasten the attachment strips to the mounting platform.
3) Attachment of stress plate to stress plate mounting platform
The Instron machine was adjusted so that the stress plate was sitting on top of the specimen. The pin connecting the male and female components of the plate-flanged housing was removed releasing the stress plate so that it was sitting directly on top of the test specimen. 10 #10 1” (25 mm) Robertson head wood screws were used to attach the stress plate to the stress mounting platform.
Results & Discussion
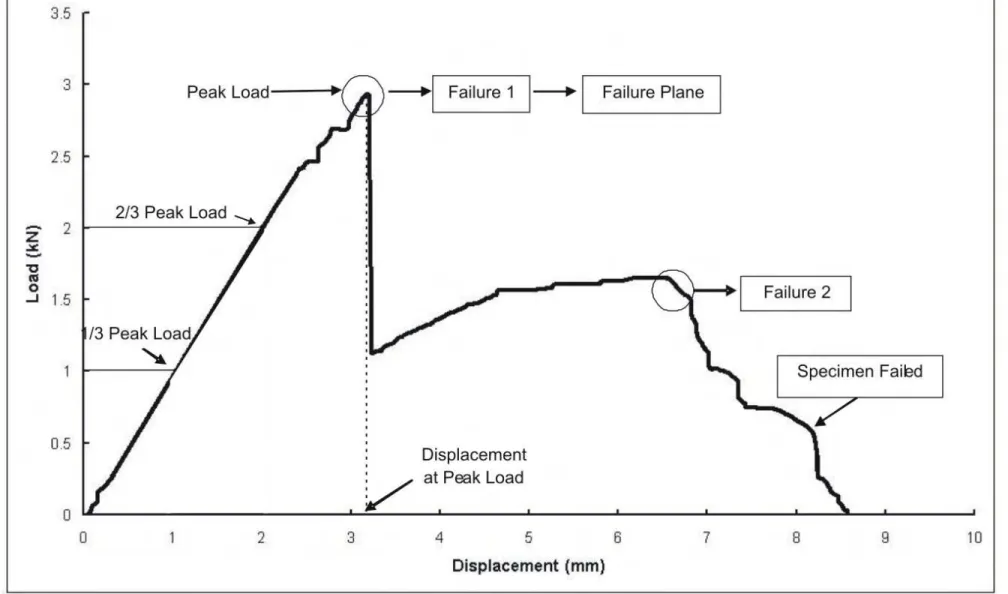
The following terminology was used in the data interpretation of the test results of this study (Figure 6).
Peak Load: The maximum force the specimen is able to resist before failure
occurs on the specimen. The peak load is like a barometer of uplift resistance performance. The higher the peak load, usually the better the performance.
Deflection at Peak Load: A measurement of the specimen movement at the
time of peak load occurrence.
Failure Planes: The occurrence of the first failure is typically known as failure 1. Failure 2 is the second failure observed on a specimen. When the
specimen is unable to resist any further application of the load, then the specimen is considered as failed. The plane in which failure 1 is observed is defined as the failure plane.
During the experimental study for some specimens, failure 1 actually represents a partial failure or it implies movement within the roofing assembly. However, it is termed as "Failure 1" and followed throughout experimental program to maintain consistence in the classification. Similarly, until after two-thirds of the load has been applied failures were not observed. Questions such as: what if the load were relaxed prior to exceeding the 2/3 load; would the roofing assembly return to its preload state? If it were loaded again (as occurs during wind events) would the load deflection response change? are beyond the scope of the present paper contribution.
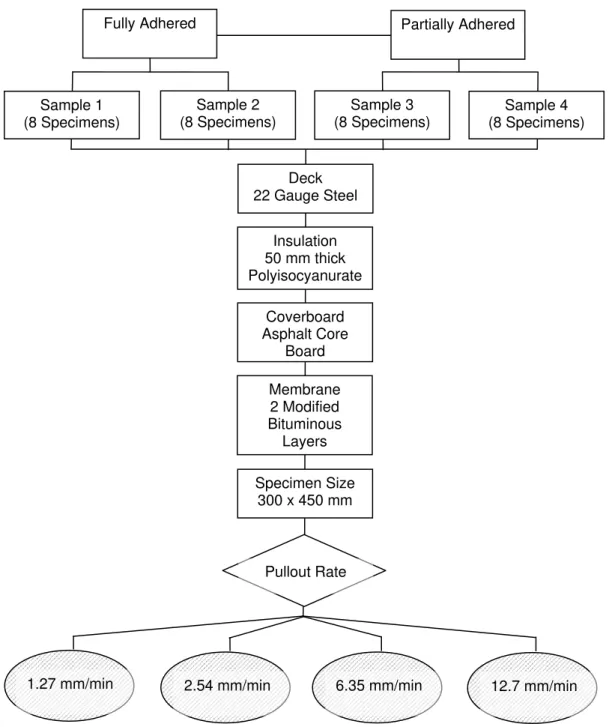
Uplift Loading Rate Specification
Figure 7 outlines the experimental conditions used to determine an appropriate loading rate in evaluating the resistance of AARS specimens against tensile loading. The rate of displacement imposed on the stress plate mounting platform of the specimen for a given time, which is translated into the applied load can be termed as uplift loading rate. Since the deflections were imposed perpendicular to the
specimens, they are intended to simulate vertical tensile wind uplift forces. There were two sets of samples prepared. In set #1, components were adhered with a full coat of adhesives (FA), in other words, adhesives were applied to the entire surface area of each component that came in contact with other components. In set #2, adhesives were applied at predefined locations and those specimens were labeled as partially adhered (PA) specimens. For each set, two samples were prepared and they were supported and constructed by the industrial clients (please refer to the acknowledgement section).
For each sample, a minimum of 8 specimens were constructed. Note that the specimens are replications of the same configuration and they are 12” x 18” (300 x 450 mm) in size. All specimens included a 22 gauge steel deck, vapour barrier, 2” (50 mm) polyisocyanurate insulation, an asphalt core board, and two layers of bituminous membrane. Applied loading rates are 0.05 in/min (1.27 mm/min), 0.1 in/min (2.54 mm/min), 0.25 in/min (6.35 mm/min), and 0.5 in/min (12.7 mm/min). This test matrix resulted in a total of 128 (samples x specimens x loading rate = 4 x 8 x 4) test data for the determination of an appropriate loading rate in evaluating the resistance of AARS specimens subjected to tensile loading.
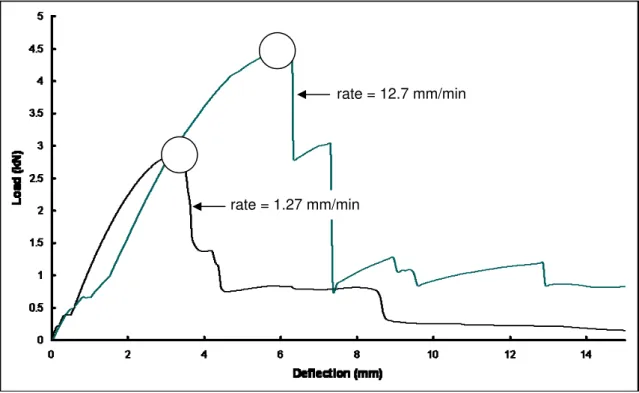
A typical response to tensile loading (Figure 8a) is presented. The raw data of specimen 4 from sample 2 at loading rates of 0.05 in/min (1.27 mm/min) and 0.5 in/min (12.7 mm/min) is shown as a specific example. The x-axis displays the deflection in millimeters incurred by the specimen at a specific load (kN) given in the y-axis. In each curve, the first section consists of a mostly linear region where loading builds until failure occurs. Linearity is not observed in the regions immediately at the start of the test and prior to failure due to the removal of slack or
displacement of the roofing components within the system at the start and the evolution of linear elastic behaviour to non-linear plastic deformation just before failure. The specimen at the faster rate of 0.5 in/min (12.7 mm/min) is able to carry higher load at a higher deflection before failure than the specimen in the 0.05 in/min (1.27 mm/min) condition. The extracted peak loads for this specimen in both rate conditions are illustrated in Figure 8a along with the peak loads of the other specimens that were tested. The specimen number is indicated in the x-axis while the peak load in kN is represented by the y-axis. Note that these values are not averages but raw data obtained directly from experimentation. With the exception of specimen 1, all specimens exhibited the same behavior as the specimen 4 example in that the 0.5 in/min (12.7 mm/min) condition supported higher loading before failure than the 0.05 in/min (1.27 mm/min) condition. This demonstrates repeatable relative peak load behaviour across all specimens but does not depict the entire message on its own. Further data analyses were performed to determine the appropriate loading rate.
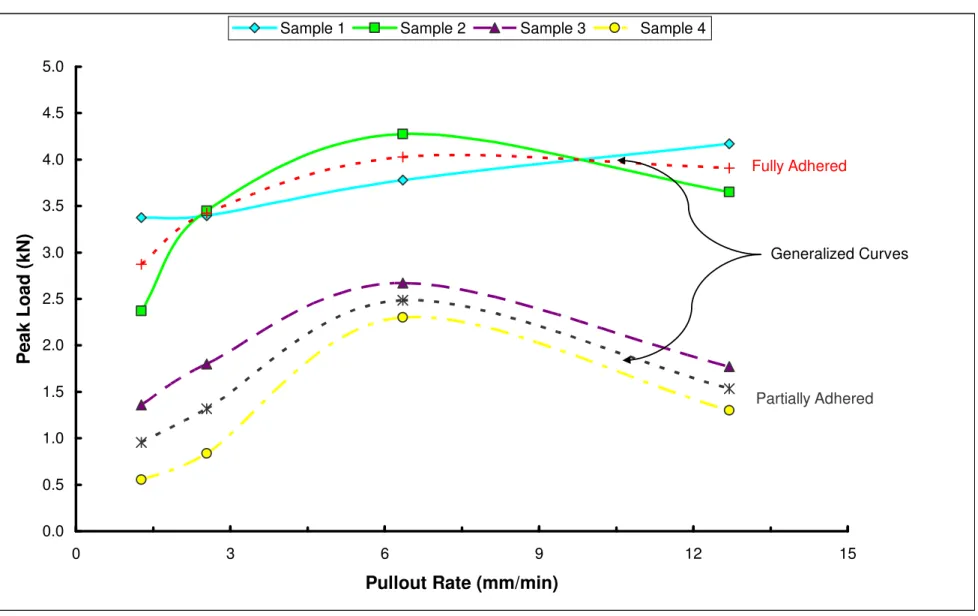
The testing results exhibited in Figure 9 show the measured peak loads at four different loading rates. The x-axis shows the loading rate in mm/min where a maximum load that the sample reached is shown in the y-axis. Note that each sample data represents an average of either specimen. The data was grouped corresponding to the two sets, namely, fully adhered (FA) and partially adhered (PA). Samples in which components were fully adhered had high resistance to the applied tensile loading compared to the partially adhered samples, irrespective of the loading rate, indicating an increase in the adhered area increases the loading resistance. There is a minimal difference between the peak loads of the two samples in each set; which leads to an approach of averaging the corresponding peak loads to obtain
a generalized data for each loading rate. For example, in the case of the PA set, sample 3 had an average peak load of 2.7 kN at a loading rate of 0.24 in/min (6.35 mm/min), whereas the corresponding data for sample 4 is 2.3 kN. This resulted in a generalized data point for 0.25 in/min (6.35 mm/min) for PA samples as 2.5 kN. In having such data points, two generalized curves were obtained, one for a PA set and the other for a FA set. In general, from the generalized curves it is clear that there is an increase in peak load from 0.05 in/min (1.27 mm/min) to 0.25 in/min (6.35 mm/min) followed by a decline as the speed is increased even further. Based on these findings, it appears that the optimum rate for characterizing pullout resistance is 0.25 in/min (6.35 mm/min).
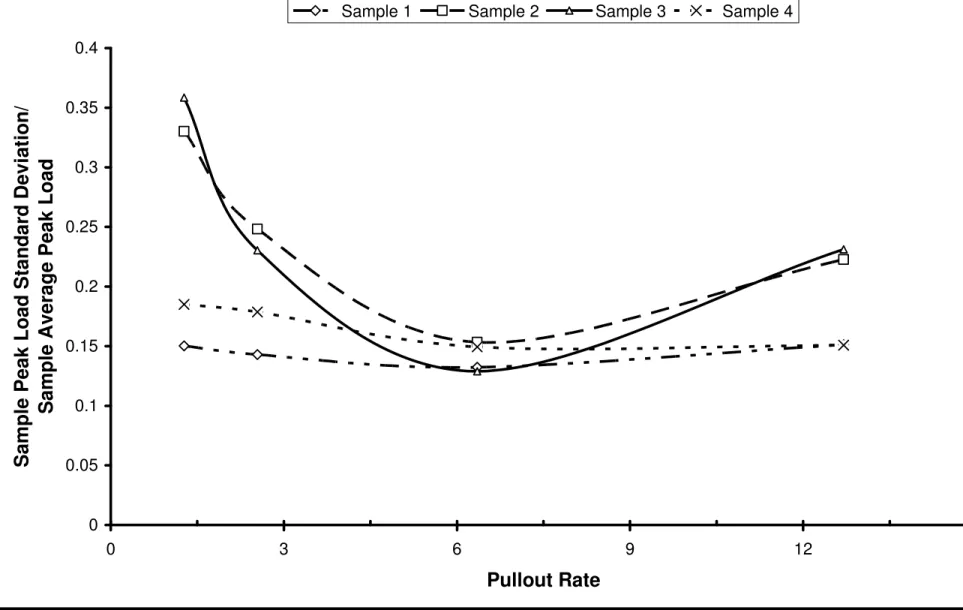
Repetitions of experiments were performed in order to provide statistical significance to this experimentation. Another measurement of interest is the amount of “potential” error or deviation within these data sets. As a result, in addition to the sample average peak load, the sample standard deviation of the peak load was also calculated. Depicted in Figure 10 are the normalized standard deviations of the peak loads for each sample set at the four different loading rates. The x-axis shows the loading rate in mm/min where the relative deviation of peak loads for the sample is shown in the y-axis. Note that each data point is an average from the specimens and was obtained when the peak load standard deviation was divided by the average peak load of the sample. In general, from the trend lines it is shown that there is a decrease in standard deviation from 0.05 in/min (1.27 mm/min) to 0.25 in/min (6.35 mm/min) followed by an increase as the speed grows further with the FA specimens usually exhibiting less relative deviation than the PA specimens. The relative deviation for the 0.25 in/min (6.35 mm/min) condition is a minimum when compared to the other speeds. This indicates that the 0.25 in/min (6.35 mm/min)
loading rate yields the results with the least amount of deviation or most consistent as a function of the measurement. This data concludes that, again, the 0.25 in/min (6.35 mm/min) condition is the optimal loading rate. This analysis will later be cross-referenced with a failure plane analysis.
Failure Plane Analysis
To ensure the consistency of the test results, throughout the experimental program, failure modes were observed and recorded by the same operator. In addition, the standard criteria were used for the classification of different failure modes. This criterion was based on the percentage of the failure area of an individual failure to the total failure surface area. For example, several types of failure could occur during the test of a specimen. For classification purposes, the failure mode was recorded when the area of failure is 30% or more to the total surface area of the specimen. Furthermore, each failure mode was documented with photographs as a reference for the development of a standard test procedure. Depending on the components involved, failures can be classified as follows:
¾ Insulation failure ¾ Cover board failure ¾ Vapour barrier failure ¾ Adhesive failure
Each of these components’ failures is further classified based on the failure mode. There were four failure planes identified when specimens were tested for different loading rates between 0.05 in/min (1.27 mm/min) and 0.5 in/min (12.7 mm/min): adhesive failure, vapour barrier delamination, facer rupture, and facer delamination (Figure 11). These failure planes are discussed below. They are classified based on
visual observations of the operator and investigating the failed specimens after the tensile loading:
Adhesive failure: This occurs when one layer of roofing material is separated
from an adjacent layer of construction materials with the adhesive still fully bonded to one of the roofing materials or when the adhesive is still partially bonded to the adjacent layers of construction materials.
Vapour Barrier Delamination: This occurs when the two sheets of papers that
are laminated together to form the vapour barrier become unglued. It comes pre-laminated and therefore the failure is due to a manufactured adhesive failure and not the specimen construction.
Facer Rupture: This occurs in the facer and partially into the insulating
materials. The failure starts in the facer.
Facer Delamination: This occurs in the polyisocyanurate immediately
adjacent to the paper- or acrylic-based facer. Failure starts in the foam adjacent to the facer.
As shown in Figure 12, the x-axis depicts the loading rates and the y-axis presents the percentage of failure occurrences. The failure planes have been categorized from least desirable to most desirable from the bottom to top. For the specimens which were subjected to a loading rate of 0.05 in/min (1.27 mm/min), there were 19 (60%), 8 (25%), 3 (3%), and 2 (5%) specimens failed due to adhesive failure, vapour barrier delamination, facer rupture, and facer delamination respectively. The most failure plane consistency is exhibited at the loading rate of 0.25 in/min (6.35 mm/min) where the main failures are facer rupture and facer delamination. Thus, failure due to insulation facer represents over 95% of the total for occurrence when specimens were subjected to a loading rate of 0.25 in/min (6.35 mm/min). Failures on facers
appear to be the failures that attain the highest peak load. Majority of failures indicated that the weakest link is the insulation. These types of failures are most desired due to the fact that the mechanical properties of the insulation can be much more accurately quantifiable than other components of the AARS specimen. Again this verifies that the 0.25 in/min (6.35 mm/min) loading rate condition is the most ideal as a standard in the loading rate test method.
Specimen Size Specification
Now that an optimal rate has been established, an ideal size for the test specimen must be found. Figure 13a outlines the experimental conditions used to determine an appropriate specimen size in evaluating the resistance of AARS specimens against tensile loading. The samples were prepared as before, in two sets, one fully adhered and the other partially adhered. All materials were supplied and specimens were constructed by the same industrial clients mentioned in the previous section. For each sample, 8 specimens were constructed. All specimens included a 22 gauge steel deck, vapor barrier, 2” (50 mm) polyisocyanurate insulation, an asphalt core board, and two layers of bituminous membrane. Each test was run at the 0.25 in/min (6.35 mm/min) loading rate. Two sizes of specimen were tested, 12” x 18” (300 x 450 mm) and 12” x 36” (300 x 900 mm). Note that the same size stress plate (Figure 13.b) was used during all loading tests regardless of specimen size. It was assumed that the stress transfer from the steel plate to the plywood mounting platform was uniform and would have little effect on the pullout performance. This test matrix resulted in a total of 64 (samples x specimens x sizes = 4 x 8 x 2) pullout
test data for the determination of an appropriate specimen size in evaluating the resistance of AARS specimens subjected to tensile loading.
The testing results exhibited in Figure 14 show the measured peak loads for two different specimen sizes. The x-axis corresponds to the sample number and the y-axis corresponds to the peak load. Note that the represented peak load is an average of either specimen. In relation to specimen size, the larger specimens generally fail within the range of 1.14kN – 4.72kN and the smaller specimens generally fail within a more finite range of 2.30kN – 4.27kN irrespective of the sample. The data was also grouped corresponding to the two sets, that is, the fully adhered and partially adhered specimens, providing a baseline comparison between the two different specimen sizes by accounting for the difference in the fully adhered and partially adhered construction methodology. When full adhesion is applied, the 12” x 36” (300 x 900 mm) specimens fail at higher loads and when partial adhesion is applied, the 12” x 18” (300 x 450 mm) specimens fail at higher loads. The results of Figure 14 provide mixed conclusions about which specimen size reliably produces the highest peak loads and the data must be analyzed from another angle.
Figure 15 illustrates the deflection at peak load of the two different sizes, 12” x 18” (300 x 450 mm) and 12” x 36” (300 x 900 mm). Data for both fully and partially adhered configurations are included. The sample number is labeled in the x-axis with the corresponding deflection at peak load represented in the y-axis. Note that the presented values of deflection at peak load are an average of the eight specimens. Regardless of which configuration, the 12” x 18” (300 x 450 mm) specimens achieve higher deflection at peak load than the 12” x 36” (300 x 900 mm) specimens. The smaller size specimens failed within a finite range of 0.3 +/- 0.02” (6.5 +/- 0.5 mm). With a deflection at peak load around 0.2” (5 mm), the 12” x 36”
(300 x 900 mm) specimens are less malleable compared to the 12” x 18” (300 x 450 mm) specimens. Also, the 12” x 36” (300 x 900mm) exhibited successive failure. Based on the higher deflection at the peak load and the confined failure range, the 12” x 18” (300 x 450 mm) condition is found to be more ideal. However, it is necessary to expand on the observations with a failure plane analysis to develop a more definitive conclusion.
Failure Plane Analysis
The four previously discussed failure planes were also identified during specimen size tests. These included adhesive failure, vapour barrier delamination, facer rupture, and facer delamination. The failure occurrences in this section, based on the specimen size and construction methodology, are presented in Figure 16. The x-axis depicts the specimen size and configuration and the y-x-axis presents the percentage of failure occurrences. For the fully adhered specimens the failure planes remain relatively constant despite the differences in size. For example, 80% of the FA 12” x 36” (300 x 900 mm) and 100% of the FA 12” x 18” (300 x 450mm) failure occurrences were due to facer delamination. For the partially adhered specimens, the failure planes change in both location and nature. For example, all failures from the PA 12” x 36” (300 x 900 mm) condition were adhesive in nature whereas all failures from the PA 12” x 18” (300 x 450 mm) condition were facer ruptures.
The differences of failure plane were observed in the specimens of partial adhesion. The 12” x 36” (300 x 900 mm) PA specimens were constructed with slightly larger center to center distances between the adjacent beads of adhesive compared to the 12” x 18” (300 x 450 mm) PA specimens causing the undesirable adhesive failure. It
would be expected to have a constant failure plane location if the same spacing had been used in both sizes of specimen.
Essentially, the failure planes of the 12” x 18” (300 x 450 mm) specimens that were both fully and partially adhered were consistent, always undergoing either facer delamination or facer rupture (Figure 17), respectively. This infers that the 12” x 18” (300 x 450 mm) specimen size specification is the more suitable between the two sizes tested and corresponds with the conclusions made from the deflection at peak load analysis.
Specimen Attachment Specification
The experimental protocol discussed at the beginning of this paper indicated that every flute of the steel deck required attachment to the specimen mounting platform (refer to Figure 5c). However, a greater amount of deflection may occur in the actual field compared to lab tested attachment conditions. It is useful to investigate the attachment condition of one that allows for more deflection and then determine if changing this condition introduces any significant changes in the pullout response and in the development of the test protocol.
Figure 18a provides an overview of the conditions under which the specimen attachment tests occurred to determine an appropriate end condition for evaluating the resistance of AARS specimens against tensile loading. Contrary to the rate and size specification tests, all tests conducted for the attachment condition were performed on fully adhered specimens to avoid the peeling forces that would have been subjected to beads of adhesive in a partially adhered condition. For each sample, 8 specimens were constructed, each with a 22 gauge steel deck, 2” (50 mm) thick polyisocyanurate insulation, an asphalt core board, and two layers of bituminous membrane. These tests were carried out with the previously determined
experimental parameters as: loading rate 0.25 in/min (6.25 mm/min) and specimen size of 12” x 18” (300 mm x 450 mm). In one test condition, all four flutes were attached, labeled as fixed end condition (Figure 18b), and in the other test condition only the two outer flutes were attached, labeled as simply supported end condition (Figure 18c). This test matrix results in a total of 64 (samples x specimens x end condition = 4 x 8 x 2) test data for the determination of an appropriate attachment condition in evaluating the resistance of AARS specimens subjected to tensile loading.
A comparison of peak loads for the fixed and simply supported conditions is illustrated in Figure 19. The attachment conditions are shown on the x-axis and the peak load is shown on the y-axis. Note that the peak load depicted on the chart is an average from the eight specimens. The fixed condition generated peak loads between 2.6 and 3.8 kN with samples 1 and 3 bearing the highest of the loads. The simply supported condition generated peak loads about 3 times lower than those of the fixed condition in the range of 0.8 -1.4 kN. Samples 1 and 3 carried the highest loads before failure in this condition as well, showing a consistency of results between samples.
The simply supported attachment setup allows for more deflection of the specimen than the fixed setup. With simply supported attachment, there is a high stress concentration on the bottom face of the insulation due to the high relative ductility of the steel deck with respect to the other construction materials. When the deck deflects upwards, it transfers these stress concentrations to the insulation and vapour barrier. As the deflection continues to increase, the stress concentrations manifest themselves as peeling forces that start at the outer edge of the specimen and propagate inward. In the fixed condition, the deck is not as free to deflect and
the stress concentrations are either not present or do not cause the onset of failure until much later in the pullout test. Overall, the fixed attachment condition is superior to that of the simply supported condition in that it is able to generate the higher peak loads before failure. To support these findings, a failure plane analysis is necessary.
Failure Plane Analysis
Figure 20 illustrates the overall breakdown of failure planes from fixed and simply supported attachments. The attachment conditions are found in the x-axis with the percentage of the failure occurrence found in the y-axis. Adhesive failure, vapour barrier delamination, facer rupture, and facer delamination were the four types of failures found in this investigation. For the specimens subjected to fixed attachment, there were 7, 4, 10, and 10 specimens failed due to adhesive failure, vapour barrier delamination, facer rupture, and facer delamination respectively. In other words, there were 23%, 13%, 32%, and 32% of the failure occurrences due to adhesive failure, vapour barrier delamination, facer rupture, and facer delamination respectively. There is no major shift of failure planes from the fixed to simply supported attachments, where the main failures for both are facer delamination (Figure 21a) and facer rupture (Figure 21b). The failure due to insulation facer represents 65% of the total occurrence in the fixed condition and 57% of the total occurrence in the simply supported condition. Although there is no huge difference in the occurrences of failure planes between the two conditions, if taken with the peak load analysis and stress concentration hypothesis the fixed attachment condition does show consistent results and is the best end condition to use when characterizing the pullout resistance of AARS specimens as well as in the development of a common test protocol, fixed end condition can minimize the operator associated variability.
Conclusion
This paper identified and evaluated key parameters for characterizing the uplift resistance of AARS specimens subjected to tensile loading. Based on the results of this study, the optimal specifications of the key variables for an uplift test are as follows:
• A loading rate of 0.25 in/min (6.35 mm/min)
• A specimen size of 12” x 18” (300 x 450 mm)
• Fixed attachment condition
This optimization process considered both the uplift resistance and failure planes. A test method for possible adoption by the American Society for Testing Material (ASTM, 2010) is in progress. Using the standardized test protocol, effect of material combinations and variation in the adhesive applications were investigated. These findings and observations were documented elsewhere (Baskaran et al. 2010). What is more interesting is simulating the in service conditions of the roof assemblies in the lab and quantifying the influence on the uplift resistance. This will be one of the focuses for future research.
Acknowledgements
The authors would like to acknowledge contributions of: Natural Sciences and Engineering Research Council (NSERC), Bakor Inc., IKO Industries Ltd, Soprema Inc., Tremco Inc. and Roofing Contractor Association of British Columbia. Sharon Dixon and Bona Murty assistance during the manuscript preparations are appreciated.
References
American Society for Testing and Materials, Standard Test Method for Measuring
Adhesion of Organic Coatings to Plastic Substrates by Direct Tensile Testing, ASTM
D 5179-02, USA, 2002
American Society for Testing and Materials, Standard Test Method for the
Determining the Uplift Resistance of the Adhesive Applied Roofing Systems, ASTM
Work Item WK26082 - Task Group D08.20.37- in balloting process, 2010. Baskaran, B. A., Murty, B., Tanaka, H., “Pilot study on wind uplift resistance of adhesive applied low slope roofing systems,” J. ASTM International, Vol 4 (10), 2007, pp. 1-15.
Baskaran, A., Current, J., Martín-Pérez, B., Tanaka, H.,”Quantification of the Uplift Resistance of Adhesive Applied Low Slope Roof Configurations Subjected to a Tensile Loading Test Protocol,” Accepted for publication J. Material in Civil
Engineering, ASCE, 2010.
CSA A123.21-10 (2010), “Standard Test Method for the Dynamic Wind Uplift
Resistance of Membrane Roofing System”, www.csashop.ca.
Current, J., Murty, B., Wu, J., Baskaran, A., and Tanaka, H., “Wind Uplift Resistance Data for Adhesive Applied Roofing Systems,” Research Report, Institute for
Research in Construction, National Research Council Canada, 2007, pp 1-236.
Current, J., “Development of Pullout Test Method for Adhesive Applied Roofing Systems,” MASc. Thesis, Department of Civil Engineering, University of Ottawa, Ottawa, Canada, 2009.
European Standards, “Adhesives for tiles – Determination of tensile adhesion strength for cementitious adhesives”, BE EN 1348, 2007
International Organization for Standardization, Determination of the bond strength of engineering plastic joints”, ISO 15509, 2001
ETAG (2006). ”Guideline for European technical approval of mechanically fastened flexible roof waterproofing membranes.” EOTA, Kunstlaan 40 Avenue des Arts, B-1040, Brussels.
Factory Mutual Research, (1986).”Approval standard: class I roof covers (4470).”
FM, Norwood, Massachusetts.
Factory Mutual Research, (2004),”Approval standard: class I roof covers (4474).”
FM, Norwood, Massachusetts.
NT BUILD 307 (1986).”Roof coverings: wind load resistance (NT BUILD 307).” Nor test, Finland.
NBI 160 (1990), Roof coverings-dynamic wind load resistance.” Norwegian Building Research Institute, Finland.
Paulsen, E.M. (1989).” NBI Roof wind uplift strength test facility and load programs,
Proc. of the Roof Wind Uplift Testing Workshop, Oak Ridge, Tennessee, 46-51.
Murty, B., Current, J., Wu, J., Baskaran, A., and Tanaka, H., “Wind Uplift Resistance Data for Adhesive Applied Roofing Systems: Part 2,” Research Report, Institute for
Murty, B., Current, J., Dave lay, C., Baskaran, A., and Tanaka, H., “Wind Uplift Resistance Data for Adhesive Applied Roofing Systems: Part 3,” Research Report,
Institute for Research in Construction, National Research Council Canada, 2008b,
pp 1-180.
Murty, B., ”Wind Uplift Performance Evaluation of Adhesive Applied Roofing Systems,” Ph.D. Thesis, Department of Civil Engineering, University of Ottawa, Ottawa, Canada, 2010.
Single Ply Roofing Industry, “Standard Field Test Procedure for Determining the Mechanical Uplift Resistance of Insulation Adhesives over Various Substrates” ANSI/SPRI IA-1-2005
Underwriters Laboratories Inc. (2006).” UL standard for safety tests for uplift resistance of roof assemblies, Underwriter Laboratory of Canada, Toronto, Canada. Wu, J., “Development of a Peel Test Procedure for Adhesive Applied Roof Systems” MASc. Thesis, Department of Civil Engineering, University of Ottawa, Ottawa,
Canada, 2008
Membrane lift up and sag Complete peel of membrane from fiberboard Peeled roof Tensile Force – Uplift Failure Shear Force-Peel Failure - 0º< θ <45º Shear Force - Peel Failure
Figure 1. Simplified View Force Causing Roof Failure due to Wind Action (Wu, 2008)
Figure 2a: Deck layout & priming Figure 2b: Self-adhering vapour barrier
Figure 2c: Application of vapour barrier-insulation adhesive by partial adhesion
Figure 2d: Adhering insulation
Figure 2e: Application of insulation-cover board adhesive
Figure 2f: Adhering cover board
Figure 2g: Application of coverboard-base sheet adhesive
Figure 2h: Adhering base sheet by cold process
Figure 2i: Torching of base sheet to cap sheet
Figure 2j: Adhering of cap sheet by cold process
Figure 2k: Completed specimen
Concrete Deck Steel Deck
Figure 3: Typical Layout of Fully Adhered and Partially Adhered
Specimen Mounting Platform Frame Load Cell Stress Plate Plate Flanged Housings Crosshead
Figure 4: Key Components of the Instron Frame with AARS Pullout Components Installed
Figure 5a: Attachment of Stress Plate & Platform
Figure 5b: Installation of Specimen in Frame & Alignment Check
Figure 5c: Installation of Attachment Strips & Securing Specimen
Figure 5d: Detachment of Female Component of Plate Flanged Housing
Figure 5e: Attaching Stress Plate to Stress Plate Mounting Platform
Figure 5f: Reattaching Male and Female Components of Stress Plate Housing
Fully Adhered Partially Adhered Sample 2 (8 Specimens) Sample 3 (8 Specimens) Sample 1 (8 Specimens) Sample 4 (8 Specimens) Deck 22 Gauge Steel Insulation 50 mm thick Polyisocyanurate Coverboard Asphalt Core Board Membrane 2 Modified Bituminous Layers Specimen Size 300 x 450 mm Pullout Rate
Figure 7: Test Matrix for Pullout Rate Determination 1.27 mm/min 2.54 mm/min 6.35 mm/min 12.7 mm/min
Figure 8b: Peak Load Compar ns 1-8 from Sample 2 at 1.27 & 12.7 mm/min
Figure 8a: Time History Pl Load (kN) for Specimen
4 at 1.27 & 12.7 mm/min ot of Deflection (mm) vs. ison of Specime 2.9 4.5 0.5 1.0 1.5 2.0 2.5 3.0 3.5 4.0 4.5 5.0 rate = 12.7 mm/min rate = 1.27 mm/min 1.27 mm/min 12.7 mm/min 0.0 1 2 3 4 5 6 7 8 Peak L o ad ( k N ) Specimen
0.0 0.5 1.0 1.5 2.0 2.5 3.0 3.5 4.0 4.5 5.0 0 3 6 9 12 15
Pullout Rate (mm/min)
Pea k Loa d ( k N)
Sample 1 Sample 2 Sample 3 Sample 4
Partially Adhered
Fully Adhered
Generalized Curves
Figure 9: Sample Average Peak Load for Pullout Rates of 1.27 – 12.7 mm/min with Generalized Curves for Full and Partial Adhesion
0 0.05 0.1 0.15 0.2 0.25 0.3 0.35 0.4 0 3 6 9 12 1 Pullout Rate Sa mp le Pea k L o a d Stan d a rd Dev ia tio n /
Sample Average Peak Load
Sample 1 Sample 2 Sample 3 Sample 4
Figure 11a: Facer Delamination
Figure 11b: Facer Rupture
Figure 11c: Vapour Barrier Delamination
19 18 17 8 8 3 3 2 12 4 2 1 13 7 1 0% 10% 20% 30% 40% 50% 60% 70% 80% 90% 100% 1.27 2.54 6.35 12.7
Pullout Rate (mm/min)
Fa il ur e O cc ur ren ce
Adhesive Failure VB Delamination Facer Rupture Facer Delamination
Fully Adhered Partially Adhered Sample 2 (8 Specimens) Sample 3 (8 Specimens) Sample 1 (8 Specimens) Sample 4 (8 Specimens) Deck 22 Gauge Steel Insulation 50 mm thick Polyisocyanurat Coverboard Asphalt Core Board Membrane 2 Modified Bituminous Layers Pullout Rate 6.35 mm/min Specimen Size
Figure 13a: Test Matrix for Specimen Size Determination 300 x 450 mm 300 x 900 mm
Figure 13b: Stress Plate & Stress Plate Mounting Platform Setup for 300 x 900 mm and 300 x 450 mm Specimens
Stress Plate Mounting Platform
Specimen
Figure 14: Peak Load Pullout Performance Comparison of Fully & Partially Adhered Specimens 4.92 4.83 2.19 1.39 3.78 2.67 2.30 4.27 0.0 0.5 1.0 1.5 2.0 2.5 3.0 3.5 4.0 4.5 5.0 1 2 3 4
Fully Adhered Samples Partially Adhered Samples
P
e
ak Load
5.19 7.08 3.80 6.21 5.00 6.88 5.35 5.93 0 1 2 3 4 5 6 7 8 300 x 900 mm 300 x 450 mm 300 x 900 mm 300 x 450 mm
Fully Adhered Samples Partially Adhered Samples
D e fl e c ti o n at P e ak L o a d (mm)
3 12 12 16 14 0% 10% 20% 30% 40% 50% 60% 70% 80% 90% 100% 300 x 900 mm 300 x 450 mm 300 x 900 mm 300 x 450 mm
Fully Adhered Samples Partially Adhered Samples
Fa
ilure Occ
u
rrenc
e
Adhesive Failure VB Delamination Facer Rupture Facer Delamination
Facer Delamination
Figure 17a: Typical Failure Plane of 300 x 450 mm Fully Adhered Specimens
Facer Rupture
Figure 17b: Typical Failure Plane of 300 x 450 mm Partially Adhered Specimens
Figure 18a: Test Matrix for Attachment Condition Determination
Figure 18b:Fixed Condition Figure 18c: Simply Supported Condition
Fully Adhered Sample 2 (8 Specimens) Sample 3 (8 Specimens) Sample 1 (8 Specimens) Sample 4 (8 Specimens) Deck 22 Gauge Steel Insulation 50 mm thick Polyisocyanurate Coverboard Asphalt Core Board Membrane 2 Modified Bituminous Layers Pullout Rate 6.35 mm/min Specimen Size 300 x 450 mm End Condition
Figure 19: Peak Load Comparison of Specimens with Fixed & Simply Supported Condition 3.78 1.36 3.14 0.80 3.81 1.36 2.59 0.96 0.0 0.5 1.0 1.5 2.0 2.5 3.0 3.5 4.0 4.5 5.0 Attachment Condition Pea k Loa d ( k N)
Sample 1 Sample 2 Sample 3 Sample 4
7 6 4 7 10 11 10 6 0% 10% 20% 30% 40% 50% 60% 70% 80% 90% 100%
Fixed Simply Supported
Attachment Condition
Failure Occurrence
Adhesive Failure VB Delamination Facer Rupture Facer Delamination
Facer Delamination
Figure 21a: Illustration of Typical Failure Plane for Specimen with Four Flute Attachment Condition
Facer Rupture
Figure 21b: Illustration of Typical Failure Plane for Specimen with Two Flute Attachment Condition