Assessment of the Transfer Penalty for Transit Trips in Downtown Boston A GIS-based Disaggregate Modeling Approach
By Zhan Guo
Bachelor of Architecture Tianjin University 1996 Master of Engineering Tsinghua University 1999
Submitted to the Department of Urban Studies and Planning In Partial Fulfillment of the Requirements for the Degree of
Master in City Planning At the
Massachusetts Institute of Technology
June 2003 © 2003 Zhan Guo MASSACHUSETTS INSTITUTE F TECHNOLOGY JUN 1 8 2003 LIBRARIES All Rights Reserved
The Author hereby grants to MIT permission to reproduce and to distribute publicly paper and electronic copies of this thesis document in whole or in part.
Signature of Author
Certified by
Professc4 f
Department of Urban
Urban Studies and
Studies and Planning
June 2003
Jose Ferreira Jr. Opera ions Research
Thesis Supervisor Certified by
Accepted by
-6/ Nigel H.M. Wilson
Professor of Civil and Environmental Engineering Thesis Supervisor
Langley Keyes Chair, Master in City Planning Committee
Assessment of the Transfer Penalty for Transit Trips in Downtown Boston A GIS-based Disaggregate Modeling Approach
by Zhan Guo
Submitted to the Department of Urban Studies and Planning On May 15th, 2003 in Partial Fulfillment of the Requirements for
the Degree of Master in City Planning
ABSTRACT
This research aims to examine the impacts of transfers since transfer activities have significant implications not only for the daily operation of a transit system, but also the integration and coordination between transit lines. Transfers affect transit system performance in at least two
respects. On the one hand, the use of transfers in the design of transit services provides more options for the transit operator in terms of area coverage, resource allocation, and flexibility. These factors result in better overall service. On the other hand, transit users do not seek to make transfers on their trips unless there is no alternative or the transfer offers a compelling performance advantage for a given trip. Exploring this trade off associated with transfers helps in understanding passenger dissatisfaction with the transfer, or the transfer penalty.
A trade off between making a transfer and extra walking time is explored using a binary logit choice model to review the existence of the transfer penalty, the components inside the penalty, the effects of the urban environment outside the transit system, and the variation of the penalty across trip and personal characteristics. The MBTA subway system in Downtown Boston is used for the analysis, and GIS techniques are used extensively for data processing and results display.
The study shows that there is indeed a perceived transfer penalty among MBTA subway riders. Transfer walking time, transfer waiting time, the change of level, and the existence of
concession capture the majority of the penalty. The remaining part is explained by the general condition of the subway transfer station, and the in-vehicle travel time spent on making a transfer. The study also shows there is a variation of the transfer penalty across different
transfer stations. The urban environment in Downtown Boston as explained by measures, such as sidewalk width, land use, open space, and topology, also has a significant impact on the transfer penalty. In particular pedestrian friendly Downtown area encourage riders to leave the subway system early and walk further. The penalty is found to be largely independent on the trip and demographic characteristics though this finding may be affected by the population being
limited to those who already choose the subway system to reach their final destinations in Downtown Boston.
Thesis Supervisor: Joseph Ferreira Jr.
Title: Professor of Urban Studies and Operations Research Thesis Supervisor: Nigel H.M. Wilson
Acknowledgements
I wish to thank many individuals for their help in bringing this thesis to completion. My heartfelt thanks to Professor Nigel Wilson for suggesting this research topic, and for his support of this research from the beginning to the end. I am indebted to him for the countless hours he spent discussing and refining my ideas, and especially for exposing me to the real world problems that formed the base of this research. Nigel always pushes me to think critically and logically, which is a valuable asset to my academic career.
I am equally indebted to Professor Joseph Ferriera who has provided substantial support to my study in the past two years. Joe helps me build the technical skills that have made this research feasible and understand the interaction between land use and transportation, which might become my life long research interest. I am honored to continue my studies under his supervision at MIT.
I would also like to thank Clinton Bench, Ian Harrington, and Sanjay Kaul from the
Central Transportation Planning Stuff (CTPS) for providing valuable data during the past two years. Without their help, this research could not have been possible. I would also like to thank Sarah Williams from Rotch Library and Daniel Sheehan from the
Information System at MIT. They have been a great help to me when I was navigating the complicated world of GIS.
Lastly, I am extremely grateful for the love, encouragement and support that my parents have provided me throughout the years. This thesis is dedicated to them.
Contents
Chapter 1 Introduction 10
1.1 Transfer Activity and the Transfer Penalty ... 10
1.2 The Mist of the Transfer Penalty... 12
1.3 Assessment Method...13
1.4 Objectives... 15
1.5 Thesis Structure... 16
Chapter 2 A Method for Assessing the Transfer Penalty 18 2.1 Roots of the Transfer Penalty... 18
2.2 Factors Affects the Transfer Penalty...19
2.2.1 Station Factors ... 20
2.2.2 Path Factors... 21
2.2.3 System Factors... 21
2.2.4 Environmental Factors...22
2.2.5 Trip and Demographic Factors... 22
2.3 Previous Assessment Methods... 23
2.4 A New Method... 25
2.4.1 A New Data Set... 27
2.4.2 A Partial Path Choice Model ... 30
2.4.3 GIS Techniques... 31
2.4.4 Limitations of the Method... 32
2.5 Model Development...32
Chapter 3 Data Processing 35 3.1 Study Area and the MBTA Subway System... 35
3.2 Geocoding and Trip Selection...38
3.2.1 Geocoding... 38
3.2.2 Trip Exclusion...39
3.3 Path
Calculation... 43
3.3.1 Network Distance Calculation...43
3.3.2 Distance Comparison... 43
3.3.3 Final Data Set...45
3.3.4 Two Paths... 52
3.4 Variable Generation I: Station Variables... 53
3.4.1 Transfer W alking Time... 53
3.4.2 Transfer Waiting Time... 54
3.4.3 Transfer Facility... 55
3.5 Variable Generation II: Path Variables... 56
3.5.1 Walking Time... 57
3.5.2 In-Vehicle Time...57
3.6 Variable Generation III: Environmental Variables... 59
3.6.1 Pedestrian Friendly Parcels ... 59
3.6.2 Sidewalk W idth... 60
3.6.3 Open Space and Topology...63
3.7 Variable Generation IV: Trip and Demographic Variables... 65
Chapter 4 Model Specification and Interpretation 67 4.1 Simple Model A... 69
4.2 System Model B... 70
4.2.1 System Network Model B-1... 70
4.2.2 Facility Effect Models... 72
4.3 Station Variation Models C...76
4.3.1 General Variation Model...77
4.3.2 Specific Variation Model...79
4.4 Environmental Model D...84
Chapter 5 Conclusion 92
5.1 The Method ... 92
5.2 Data Processing...94
5.3 Model Development...95
5.4 Summary of Research Findings... 95
5.4.1 The total Transfer penalty...95
5.4.2 The Penalty Inside the System... 96
5.4.3 The Penalty Outside the System... 97
5.4.4 Trip and Demographic Influence... 98
List of Figures
Figure 2-1 The Structure of the Research Method...28
Figure 2-2 Two Options to Get the Destination...31
Figure 3-1 The Study Area and the MBTA Subway System...37
Figure 3-2 The Distribution of Excluded Trips... 41
Figure 3-3 Four Types of Trips... 42
Figure 3-4 Walking Paths from Stations to Destinations...44
Figure 3-5 Trip Classification Process for Each Trip...46
Figure 3-6 The Excluded Trips from the Two Adjustments...48
Figure 3-7 Trips Involve one Transfer to Save Walking Time...49
Figure 3-8 Trips Involve Longer Walking Distance to Save One Transfer...51
Figure 3-9 Two Types of In-vehicle Time for the Non-transfer Option of Each Trip...58
Figure 3-10 Pedestrian Friendly Parcels, Beacon Hill, and Boston Common ... 61
Figure 3-11 Average Sidewalk Width in Downtown Boston...62
List of Tables
Table 2-1 Factors Affect the Transfer Penalty ... 20
Table 2-2 Previous Transfer Penalty Results...26
Table 2-3 Variable list and Data Source...34
Table 3-1 Subway Lines, Stations, and Transfer Stations in Downtown Boston...38
Table 3-2 Trip Categories Based on Transfer and the Location of Destination... 42
Table 3-3 A Summary of the Walking Distance for the Four Types of Trips...45
Table 3-4 Transfer Time in Transfer Stations... 54
Table 3-5 Transfer Waiting Time of the MBTA Subway in Downtown Boston...55
Table 3-6 Dummy Variables of Open Space...64
Table 3-7 Dummy Variables of Topology...64
Table 4-1 Comparison Between CTPS Report and Model B-2...74
Table 4-2 A Summary of Models in the First Direction...83
Table 4-3 Trip and Demographic Factors...89
Table 5-1 Change of the Transfer Penalty and the Goodness of Fit of Models ... 95
Table A-1 Variable Statistics...102
List of Models
Model A: A Simple Model... 69
Model B-1: A System Network Model...71
Model B-2: A Facility Effect Model I... 73
Model B-3: A Facility Effect Model II ... 75
Model C-1: A General Station Variation Model ... 77
Model C-2: A Specific Station Variation Model ... 81
Model C-3: A Full System Model... 82
Model D-1: An Environment Model I... 85
Model D-2: An Environment Model 1... 87
Chapter 1 Introduction
This thesis will present a method for assessing the transfer penalty that exists in a public transportation system. It is believed that a typical transfer has an associated penalty because of its inconvenience. However, because of the lack of adequate assessment techniques, it is still not clear what elements are embedded in this penalty, and how to reduce this penalty to improve service quality and in particular service integration. The thesis adopts a new method using a disaggregate data set in a GIS environment, which is able to explore the elements of the transfer penalty, and how different factors, such as level of service, demographic characteristics, and pedestrian environment, affect the transfer penalty. The method is believed to be more precise than previous methods, and allows a more comprehensive understanding of the transfer penalty.
In this thesis, the method is applied to Massachusetts Bay Transit Authority (MBTA) subway system in Downtown Boston. The MBTA runs four subway lines and 21 stations in Downtown Boston including the four major transfer stations, which accommodate a huge number of transfers within the system. The analysis of the transfer penalty should be helpful to the MBTA in improving service coordination, and
increasing both ridership and customer satisfaction.
1.1 Transfer Activity and the Transfer Penalty
Transit networks are systems of inter-connected routes, which must function together as an integrated system. A key component of the integration is easy and convenient
transfers for its users. In most transit systems in North America, 10% to 30% of riders make at least one transfer to reach their final destination, and in some systems, this percentage exceeds 50% (APTA, 2000). In Boston, 24% of subway trips involve at least one transfer, while in Chicago, more than 50% of CTA passengers transfer during their typical trip. Thus transfers play a significant role in daily transit operations for these systems in terms of customer satisfaction, ridership, and efficiency (Crockett 2002). Transfer activity also indicates how well different service lines are connected with each other, and how the transit system interact with other transportation systems, such as bus, auto, and pedestrian.
Although transfers are important to transit riders, most riders do not like to transfer. Transfers may require riders to walk long distances or utilize several stairwells in order to board the connecting transit vehicle. Transfers may expose riders to physical discomfort if they are made to wait in unprotected locations, subject to inclement weather or unduly loud ambient noise. Passengers may just miss their transfers vehicles and be forced to wait long periods of time for the next arriving vehicle. The
reluctance of transit users can be thought of as a type of transfer 'penalty'.
The transfer penalty measures the disutility of a transfer option compared to an alternative non-transfer option. It has long been recognized as an important
consideration in model development, service design, and the performance of a transit system. A major objective is designing a transfer system is to promote ridership, and to reduce rider difficulty through improved transfer performance (Wong 2000). A clearer
understanding of the transfer penalty will enhance ridership forecasting, network design, station design, service design, service management, and the marketing strategy of a transit system.
1.2 The Mist of the Transfer Penalty
Despite its importance, little is known about the transfer penalty. The transfer penalty has been defined as different things in different studies. For example, the penalty can be defined as a single thing including all the effects of time, cost, and inconvenience factors. It can also be defined as that in addition to the time and cost involved in the transfer. It can also refer to that separate from time, cost, and connectivity factors. The different "faces" of the penalty is a critical issue that will be explored in this thesis. In this research the transfer penalty will be broken into different pieces step by step to see what elements in the penalty can be measured and controlled, and what can not.
The transfer penalty is affected by multiple factors. It may be affected by the design of transfer stations as well as by the layout of a transit network. It may be determined not only by the transit system, but also by factors outside the system such as the urban environment, land use, road network, topology, urban form etc. It may also vary with particular riders who use the transit system based on their trip and demographic characteristics. All these factors should be considered developing a comprehensive
The transfer penalty is not an absolute value. It is a result of the comparison between the utility of a transfer option and alternative non-transfer options. If there are several non-transfer options, this will add complexity to the penalty analysis. For example, if riders can choose either bus, car, or walk to their destinations after they leave a subway system, there will be four more two paths included: bus transfer path, bus non-transfer path, car transfer path, and car non-transfer path. The work load of data processing will be tripled. If other factors affect the utility of the alternative non-transfer option, they will also affect the transfer penalty.
For these reasons, the transfer penalty has not been fully studied. In this research a new method is developed to solve these problems, so that the transfer penalty can be measured and analyzed more accurately and in more detail.
1.3 Assessment Method
Transfer activity is a two-edged sword as it affects the performance of a transit system. On the one hand, the use of transfers in the design of transit services provides more options for the transit operator in terms of area coverage, resource allocation, and flexibility, resulting in better overall service (Lin 1998). On the other hand, transit users do not seek to make transfers on their trips unless there is no alternative or the transfer enables them to take advantage of a mode that offers a compelling performance
advantage for a given trip (Lin 1998). The benefit of transfers includes the saved travel time, cost, and possible inconvenience of traveling when choosing the alternative mode
to get the destination. The basic method to measure the penalty is based on the trade off between the different aspects of a transfer.
There are two situations in the trade off. In the first situation, in order to avoid a
transfer, people may choose not to ride the transit system but take an alternative mode. In the second situation, people still choose transit, and the transfer trade off exists during a part of their trip. For example, they can transfer at a transfer station to get closer to their destination so they can walk less, or they do not transfer but access their destination directly by walking a longer distance. In the first case, the trade off is between transit and auto modes, and in the second case, the trade off is largely
between extra time spent walking and on transit. Previous studies have focused on the first trade off to estimate the transfer penalty. The advantage of such a method is that the analysis covers all travel modes in a large area, and is thus applicable to defining the role of the transit system within the region as a whole. However, this approach
usually does not provide detailed information on the transfer itself and thus results in imprecise findings. Chapter 2 will discuss this in more detail.
Compared to the first trade off, the trade off between walking and transit time has many advantages in terms of transfer penalty analysis. First, this method can be based on data from on-board surveys for specific transit systems, which provides more detailed information on the trips within the system, such as where to access the system, where to transfer, and where to egress from the system. Information on the transfer and non-transfer options can be calculated more accurately. Second, the method allows
disaggregate analysis based on individual trips, which makes the analysis easily
performed in a GIS environment. Third, the method can incorporate a large amount of trip and demographic information into the analysis that the first method is unable to. The limitation of this method is that it is unable to examine how transfers affect people's choice to use a transit system. Chapter 2 will describe this method in more detail.
In this research, binary choice models will be developed to estimate the transfer penalty. Data from an on board survey is processed in a GIS system, yielding precise information on travel paths. The GIS system also allows the combination of transit system variables with land use and pedestrian environment variables. All data will be entered into the choice model for analysis. Models are developed in two series to capture the effects of station design, network design, environmental factors, and trip and demographic characteristics on the transfer penalty. Chapter 5 will describe the two model development series in detail.
1.4 Objectives
In summary, the motivations behind this research include 1) the transfer penalty is critical to the daily operation of a transit system; 2) it is a key indicator to examine how well different service lines and passenger transportation systems are connected; and 3) it helps test the interaction between station design and network planning, between the transit system and the outside environment, and between the system and system users
1. to explore the extent to which the reality and perception of the transfer penalty affects public transit use;
2. to investigate how transit users make trade-offs between travel time and other aspects of the transfer;
3. to explore the implication of the transfer penalty in transit station design and network planning;
4. to investigate how system (endogenous) factors and environmental (exogenous) factors affect the transfer penalty;
5. to investigate the extent to which the transfer penalty varies as a function of personal and trip characteristics;
6. to give suggestions and research directions on the integration and coordination of passenger transportation systems.
1.5 Thesis Structure
This thesis is organized into six chapters. Chapter two describes a framework for the penalty analysis. Based on the framework, the results of previous studies on the transfer penalty, and the methods used are also presented.
Chapter three covers the study area of Downtown Boston, the MBTA subway system, the data set for analysis, and the method that will be used in this thesis. A binary choice model is developed and possible variables are also presented.
Chapter four outlines how data is processed in a GIS system. This is the most time consuming part of this research. The major task is to generate four types of trips, and calculate the time variables associated with alternative travel paths. A statistical summary and the definition of all variables are provided at the end of this chapter.
Chapter five covers the development of a series of models. The first model includes only the simplest variables, and the transfer penalty includes the effects of all the system factors. Next, more variables are added and the residual pure transfer penalty becomes clearer. A comparison will be made to examine how the penalty decreases with the addition of new variables. Then, variables from the outside environment are added to test their effects, and a comparison is made between these variables and the system variables. Lastly, trip characteristics and demographic variables are added to check their impact on the transfer penalty.
Chapter six gives a brief summary of the results of model specification, and suggests directions for future studies.
Chapter 2 A Method for Assessing the Transfer Penalty
This chapter describes the roots of the transfer penalty, and defines different groups of factors that may affect the penalty. Assessment methods of the penalty in current practice and previous studies are analyzed, and their findings are compared. A new
method is described based on the trade off between extra time walking and time on transit. A binary choice model is developed.
2.1 Roots of the Transfer Penalty
It is believed that trip generated anxieties, walking and waiting, safety, and pre-trip cognitive load are major components that comprise the transfer penalty. Therefore, the value of the transfer penalty can be accounted for in the amount of physical, cognitive
(mental), and affective (emotional) effort that must be expended in the transfer
(Wardman 2001). Physical effort when transferring is required for walking, waiting, or carrying. Cognitive effort is needed to collect and process information during a transfer. Route familiarity will reduce the amount of cognitive effort needed. Affective effort
includes uncertainty about connections, arrival, or personal vulnerability (Wardman 2001). Factors that can influence one or more of the efforts determine the value of the transfer penalty.
2.2 Factors Affects the Transfer Penalty
There are two ways to categorize factors that may affect the transfer penalty. If we focus on how transfer stations and the travel paths affect the transfer penalty, factors can be grouped into station factors and path factors. Station factors include transfer walking time, transfer waiting time, and the characteristics of transfer facilities. They capture the contribution of transfer stations to the transfer penalty, and have clear implications on station design. Path factors include in-vehicle time, walking time, and environmental characteristics along both transfer and non-transfer path. They have implications on network design and planning.
If we focus on how the transit system and outside environment affect the transfer penalty, factors can be categorized into system factors, and environmental factors. System factors include the transfer station factors plus the in-vehicle time in the transit system. Environmental factors include walking time, and environmental characteristics along both transfer and non-transfer paths outside the transit system. In addition to the four groups, there are trip and demographic factors that may affect the transfer penalty. All these factors will be analyzed in this research. Table 2-1 lists the five groups of factors.
Table 2-1 Factors Affect the Transfer Penalty
Variable
Station Factors Transfer walking time, Transfer waiting time Change of level, concession
Path Factors In-vehicle time, Walking time
Land use, Open space, Street Network, Topology System Factor Station Factors + In-vehicle time
Environmental Land use, Open space, Street Network, Topology Factors
Trip & Age, income, gender, household size, occupation, car ownership, Demographic license, trip purpose, trip time, frequency, fare type,
Characteristics
2.2.1 Station Factors
The transfer penalty is affected by the characteristics of the transfer facility. Does it require a change of level when transferring from one line to another? How far is it to walk from one platform to another? Is it convenient when waiting for the bus or train to transfer? What are the conditions in the transfer station? In this research, the system factors include two sets of variables: first the transfer walking time and the transfer waiting time variables, and second all other variables, such as the existence of escalators or concessions, the width of the platform, the ventilation of the station etc. We expect that the time variables will definitely affect the value of the transfer penalty, though this still needs to be tested. For example, the results from Hunt (1990) indicate that the act of transferring accounts for most of the transfer penalty, while waiting time does not play a large role. The effects of other factors on the transfer penalty remain unclear. Wardman (2001) also points out that good shelters, real time information,
printed timetables, and good signage are the most important facilities to provide at transfer stations. The CTPS (1997) study addresses the role of some characteristics of the transfer environment, but found that there was inadequate data to assess their impacts on transfers. In this thesis, It is expected that the penalty will vary across the transfer stations.
2.2.2 Path Factors
There are two paths: one path involves a transfer, and the other path does not involve a transfer. The former is called the transfer path, and the later the non-transfer path. Both paths have two segments: the first is within the system, and the second is outside the system to the destination. Path factors include in-vehicle time during the system segment, and the environmental factors on the outside segment. The influence of the difference between the two paths in terms of the in-vehicle and environmental factors provide guidance for transfer station location selection, and transit network planning.
2.2.3 System Factors
System factors include all the station factors plus in-vehicle time in the transit system. They capture the effects of the system itself on the transfer penalty. The resulting value of the transfer penalty indicates how well the different service lines within the system are connected with each other.
2.2.4 Environmental Factors
Studies have shown that urban environmental factors such as land use and urban form can play a significant role in shaping urban mobility and therefore have the potential to offers important potential to influence individual travel behavior. For example, land use may affect travel from the supply side. How land is allocated, composed, and designed has differentiated impacts on the supply quantity, quality and costs of different travel modes. To a transit system, the environment defines its competing modes, and affects the travel behavior after people leave the system, thus influencing the performance of the system. For example, if the service quality provided by the system is poor, while the outside environment is conductive to pedestrian activities, the rider may leave the
system early and enjoy walking on the street. However, environmental factors have not been examined in any of the previous studies.
2.2.5 Trip and Demographic Factors
In addition to the type of transfer and connectivity, other factors are also expected to affect the size of the transfer penalty. Socioeconomic characteristics such as age, income, and gender often play an important role in travel decisions, and thus the transfer penalty may well vary across these market segments. For example, women and the elderly are generally believed to have a higher transfer penalty than others (Wardman 2001). The availability of car, and the ability to drive are also possible factors which may influence people's willingness to transfer. Income is believed to be a
significant variable in determining many aspects of behaviors, and the transfer choice might be no exception. However, all these arguments are largely hypotheses, which have rarely been tested to date.
Trip characteristics include the timing of the trip, trip direction, trip purpose, and trip time. Wardman et al reports that commuters have a 29% higher value of wait time than others (Wardman 2001). The transfer penalty is believed to be higher during peak periods than during midday, and higher in the home-work direction than in the
work-home direction. However, these remain as beliefs that have never been verified empirically.
2.3 Previous Methods
In most transit systems, the transfer penalty is assessed without clear quantitative approaches. The treatment of the transfer penalty in the literature is far from
satisfactory. Some transit systems make simple assumptions about the transfer penalty in a subjective way, for example that the transfer penalty equals the transit headway (Liu 1997). Some transit systems use a simple technique to extract the transfer penalty from regional travel models, which are zonally based, aggregate in nature, and
generally imprecise (Liu 1998, CTPS 1997).
In addition to the ad hoc treatment of transfer penalties in most transit systems, there are a small number of studies from the academic field but they use different methods and obtain different results. Below is a summary of these studies.
Han (1987) used a binary choice model to test the influence of transfers on bus path choice. The utility function includes waiting time, walking time, in-vehicle time, bus fare,
and a transfer dummy. He found that the disutility of one bus-to-bus transfer was perceived to be equivalent to 30 minutes of in-vehicle travel time, or 10 minutes of waiting at a bus stop, or 5 minutes of walk time (Han 1987). He suggests that the values determined from the model indicate that transit planners often underestimate the transfer penalty to bus riders.
Hunt (1990) performed a study centered on the estimation of a logit model of transit route choice behavior using data from commuters in Edmonton, Canada. The model includes such variables as the walking distance to a stop, the wait time for a transfer, and the number of transfers along a given path. He found that the impact of a transfer is equivalent to 17.9 minutes of in-vehicle time, independent of the time spent waiting for the transfer.
Liu (1997) examined modal choice between auto and transit under the impact of
transfers. The utility function captures in-vehicle time, out-of-vehicle time, one way cost, and number of transfers. The results show that one transfer is equivalent to
approximately eight minutes of in-vehicle travel time or 4.75 minutes of out-of-vehicle travel time. The study found that the value of the transfer penalty was greater than one headway.
A study by Central Transportation Planning Staff (CTPS 1997) estimated the impacts of transfers on urban mode choice in the Boston region using a similar method to Liu's. Variables in the utility function are transfer dummy, in-vehicle time, walking time, waiting
time, transfer waiting time, out-of-vehicle time, transit fare, number of workers per household, number of vehicles per worker, and population density. Transfer penalty was found to be equivalent to 12 to 15 minutes of in-vehicle time. Additional findings are that transfer penalties for one or two transfers are similar, and the transfer waiting time is more onerous than initial waiting time.
In summary, all of these studies identify that the presence of a transfer imposes a penalty on the passengers that negatively impacts their willingness to take transit. Various discrete choice models are used to estimate the value of the transfer penalty. However, due to the difficulty of data collection, and data processing, these methods are not widely used in most transit systems in North America. For the same reason, only limited information is provided by previous studies on the magnitude of the transfer
penalty. New methods and datasets are needed to further explore the impacts of transfers on travel behavior, which should be easy to use, and more comprehensive in
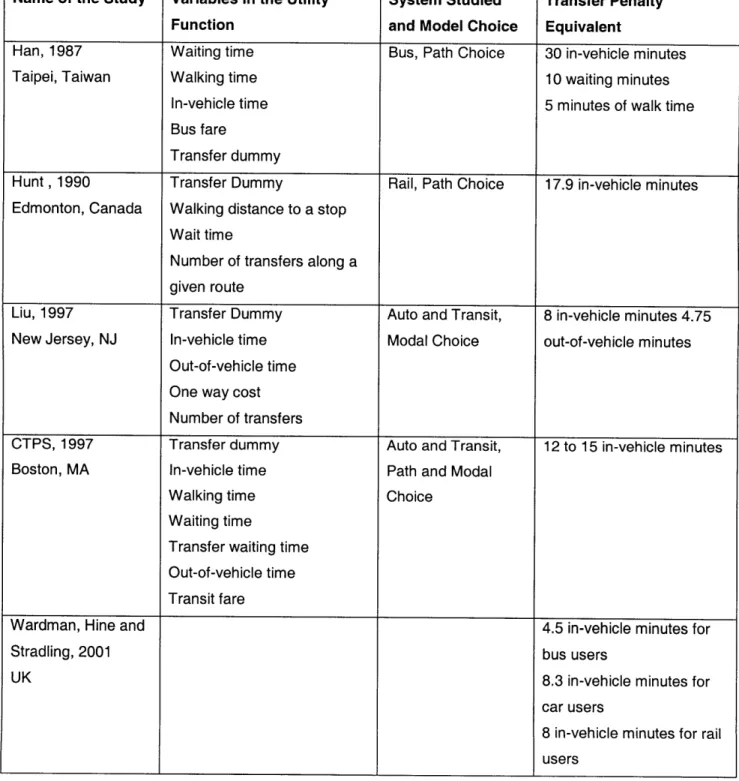
nature. Table 2-2 lists the results from these previous studies.
2.4 A New Method
The new method is a combination of on-board survey, partial path choice models, and GIS techniques. On board survey data provides detailed information on transit trips, but
is not applicable to traditional modal choice models because of exclusion of non-transit travelers. A partial path choice model allows the on board survey data to be used for discrete choice analysis, but this must be done with the assistance of GIS techniques. GIS techniques allow a disaggregate analysis of the on board survey data, and the
choice set of the transfer and the non-transfer options is defined accurately only in a GIS environment. Figure 2-1 shows the structure of this method.
Table 2-2 Previous Transfer Penalty Results
Name of the Study Variables in the Utility System Studied Transfer Penalty
Function and Model Choice Equivalent
Han, 1987 Waiting time Bus, Path Choice 30 in-vehicle minutes
Taipei, Taiwan Walking time 10 waiting minutes
In-vehicle time 5 minutes of walk time
Bus fare
Transfer dummy
Hunt , 1990 Transfer Dummy Rail, Path Choice 17.9 in-vehicle minutes Edmonton, Canada Walking distance to a stop
Wait time
Number of transfers along a given route
Liu, 1997 Transfer Dummy Auto and Transit, 8 in-vehicle minutes 4.75 New Jersey, NJ In-vehicle time Modal Choice out-of-vehicle minutes
Out-of-vehicle time One way cost Number of transfers
CTPS, 1997 Transfer dummy Auto and Transit, 12 to 15 in-vehicle minutes
Boston, MA In-vehicle time Path and Modal
Walking time Choice
Waiting time
Transfer waiting time Out-of-vehicle time Transit fare
Wardman, Hine and 4.5 in-vehicle minutes for
Stradling, 2001 bus users
UK 8.3 in-vehicle minutes for
car users
8 in-vehicle minutes for rail users
2.4.1 A New Data Set
There are two types of data sets used in previous studies. One is the data sets collected specially for the transfer analysis, and the other one is the regional travel diary. Most previous studies used the first type data. In Han's report, he interviewed
1850 bus riders over a two month period, and obtained detailed information from 327 riders on their path choices for a previous trip (Han 1987). In Liu's study, the survey data only provided155 records for model specification. Wardman, et. al use complex stated preference survey data. In total, 242 completed questionnaires were returned from bus users, 132 from rail users, and 182 from car users.
The problem with these data sets is the limited information they can provide due to the intensive data collection effort required and the associated expense. Thus, they only include a small number of variables in the models, and can not provide a
comprehensive perspective on the transfer penalty. Their results do not explain the effects on the transfer penalty of station design, network planning, environmental factors, and trip and demographic characteristics.
The 1997 CTPS report is based on the 1991 Household Travel Survey in Boston Metropolitan area. Data were obtained from approximately 3906 households with
38,116 trips, which is quite large and has detailed data on travel modes, trip chains, and demographic characteristics. The CTPS study measures transfer penalty based on both modal choice and path choice. The disadvantages of using this data set are:
ammommommmmmomommonommmmmmmmiimmmmmmmmmmmmmmmmmmmmmmmmmommmmmoom 0 m m a m m m 0 m m 0 SelqulJUA m
selqelJeA WOISAS JeJUGWUOAIAU3 AiOAjnS
pjya0l
Pjeos UO
m
m
ao-eds uedo
uoijejeueb ql-ed NIUME)P!S
-Q uoiluoilpsielo dijL A6olodoL
asn pue-1
Elelnoluo WmIGN
SIUlOd
miomlau uoileuilse(] aseqeju(] eloujo
dijL
jeeils pu-e 1!suej 1
:Nmmmmmmmmmmmmmmmmmmmmmmmommmmmmmmmmmommmommmmmmmmmommmommmmmm;
poqlelN qojuese)j eqj jo einjonilS eqL [-Z ojn6i:
1. The data is usually aggregated into large zones, which impairs the accuracy of the resulting assessment.
2. The data does not provide much information on transfer activities.
3. Significant effort is involved in defining path choice between transit and auto trips. The regional model can not precisely define auto paths, and can not calculate the specific path for transit. When comparing the computer-generated paths with the
hand coded paths, there are large differences. However, hand coding is extremely onerous, and can only cover a very small portion of all trips included in the analysis.
In this research, the data set is the 1994 MBTA On Board Survey for the subway system in the Boston Metropolitan area. The survey is done on a typical week day, and all survey forms are distributed at the entrance of subway stations rather than on the train to avoid a sampling bias towards long trips. It includes more than 38,800 trips, with the origin and destination for each trip, so all trip destinations can be geocoded using GIS software. It also provides information on where people board, transfer, and egress the subway system. The actual transit path can be defined accurately, and all associated
characteristics, such as in-vehicle time, transfer time, and waiting time can be calculated accurately. The walking paths to and from transit stops or stations usually cover relatively short distances, and can be predicted more accurately than auto paths. Also this data
usually involve the origin and destination locations, which allows disaggregate analysis of the transfer penalty, thus increasing the precision of the results. Since the data only
record trips within a transit system, it can not be used to predict the effect of transfers on people's choice to use the transit system. Also traditional modal and path models are not
applicable to this data set. A partial path choice model is developed specifically for this data set.
2.4.2 A Partial Path Choice Model
Traditional choice models set up choices at the route level. It is assumed that a traveler may change the choice of mode if the route does, or does not involve a transfer.
However, in the real world things are not so clear cut. Adding one transfer to a trip may not change the choice to a different route or mode, but only change part of the path. With one more transfer, a traveler may not shift from transit to automobile, but change where, when and how to access/egress the transit system. In summary, transfers not only affect whether travelers choose a particular mode, but also the path for that mode. Transfers not only influence people's choice at the path level, but also at the segment level of the path. For example, a rider may decide to take the subway to get the destination, so the subway mode is taken as given. If the transit trip is divided into a collection portion, main portion, and distribution portion, the rider may have different options to finish the
individual portion. The rider may walk, take a bus, or drive to start the trip in the collection portion. The rider may also make a transfer or walk further to finish the
distribution portion. This paper will focus on the transfer impact on the distribution portion of a trip, taking the collection and main portion as given.
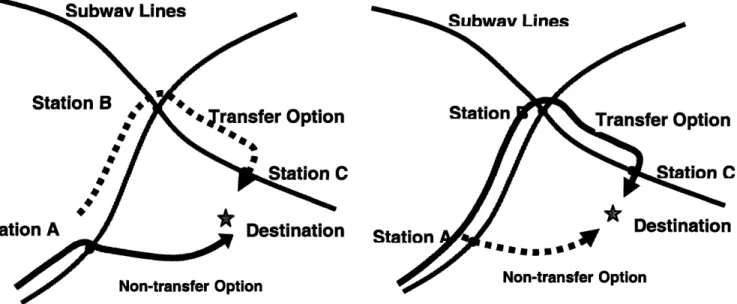
The basic idea of this method is that some people will choose between 1) leaving the subway line used for the main portion of the trip and walk to the destination, and 2) transferring within the subway system to reduce the walking distance to the destination. Treating the subway system as given, people will face different options during the
distribution part of the trip. In the discrete choice model applied, the choice set includes two alternatives: one is to avoid the transfer and walk directly to the destination, and the other is to transfer and then walk to the destination. Figure 2-2 shows the two options. The utility function includes all factors introduced in previous parts of the thesis.
Figure 2-2 Two Options to Get the Destination
Subwav Lines Subwav Lines
Station B +
*IJransfer Option **ransferr OptionStation Tase pi
Station CStio
ationDestination Station Destinatio
Nn-Sansfer Option Non-transfer Option
2.4.3 GIS Techniques
Geographic Information System (GIS) techniques are used extensively in the study. Data are prepared, stored, processed, and displayed in ArcView 3.2, a typical GIS software. There are several major tasks involving GIS techniques.
1. The first task is geocoding. The trip destinations from the on board survey data are geocoded in ArcView 3.2. Trips are represented by points in the GIS map together with a transit system map and a street network map. This provides more accurate estimation of travel paths than with data aggregated at zone level.
St
n
C
2. The second task is network distance calculation. The network distance from the destination to all subway stations are calculated in ArcView 3.2. Based on the distance, trips involving both transfer and non-transfer options are selected. To each destination point, two paths are generated. One is from the destination to the egress station in the non-transfer option, and the other one is to the egress station in the transfer option. 3. The third task is the incorporation of environmental factors. Land use, street network, open space, and topology maps are displayed in the same GIS system, and their values are calculated, and added to both transfer and non-transfer paths of each trip. This involves significant programming.
All the data processed in the GIS environment will enter in a binary logit model for analysis.
2.4.4 Limitations of the Method
There are two major limitations of the method. The first is that since the method only deals with people who choose transit, it is unable to measure the transfer's effects on the modal choice between transit and other modes. The second is that since it only focuses on the trips that end in the central city, all trips that end outside this area are excluded even though they might also involve transfer activities. This means that the method only deals with part of all transfer activities within the system. It is also important to know how many trips that involve one or more transfers end outside the central city.
2.5 Model Development
Each trip has two options. One is the transfer option, and the other is the non-transfer option. The rider will choose the option that provides a higher utility. The utility
associated with each option is determined by the factors described before. The model is developed based on the comparison between the two utilities.
Suppose Uin is the total utility associated with option i for person N, Uin can be written as follows:
Uin = Vin +Ein {i e Cn}
Where Cn is the total choice set, Vin is the observable or systematic component of the total utility, and Ein is the unobservable component of the total utility. The choice probability of option i is equal to the probability that the utility of option i, Uin, is greater than or equal to the utilities of all other options in the choice set.
P (i / Cn) = Pr (Un >= Un, all j e Cn)
In this study, we denote the choice set Cn as { i,
j},
where, for example, option i is the transfer option, and optionj
is the non-transfer option. The probability of choosing i becomesPn (i) = Pr (Uin >= Ujn)
= Pr (aVin + a~in >= aVin + aEjn) for any a >0 Suppose that En = Sin - Ejn is logistically distributed, namely
F (En )=1 / (1+ e~p ". ),p >0, - 00 < En < *0 Then
This is the binary logit model that will be used in this study. The systematic components of the total utility, Vin, can be written as follows:
Vin= F(C, Sin, Ein, Kin)
C: Constant to reflect the difference between option i and j all else being equal
Sin: System factor variables for option i for person n
Ein: Environmental Factor variables for option i for person n Kin: Trip & Demographic Characteristics for person n
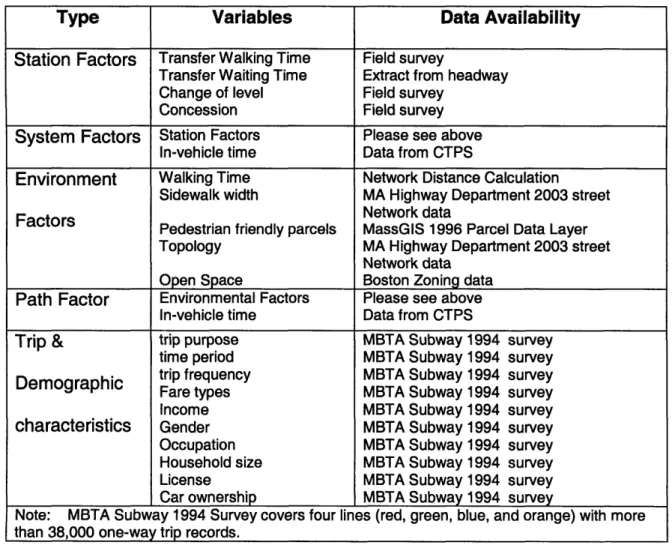
Table 2-3 lists all possible variables that may be included in the utility function.
Table 2-3 Variable list and Data Source
Type Variables Data Availability
Station Factors Transfer Walking Time Field survey
Transfer Waiting Time Extract from headway
Change of level Field survey
Concession Field survey
System Factors Station Factors Please see above
In-vehicle time Data from CTPS
Environment Walking Time Network Distance Calculation
Sidewalk width MA Highway Department 2003 street
FactorsNetwork data
Factors Pedestrian friendly parcels MassGlS 1996 Parcel Data Layer
Topology MA Highway Department 2003 street
Network data
Open Space Boston Zoning data
Path Factor Environmental Factors Please see above
In-vehicle time Data from CTPS
Trip & trip purpose MBTA Subway 1994 survey
time period MBTA Subway 1994 survey
Demographic trip frequency MBTA Subway 1994 survey
Fare types MBTA Subway 1994 survey
Income MBTA Subway 1994 survey
characteristics Gender MBTA Subway 1994 survey
Occupation MBTA Subway 1994 survey
Household size MBTA Subway 1994 survey
License MBTA Subway 1994 survey
Car ownership MBTA Subway 1994 survey
Note: MBTA Subway 1994 Survey covers four lines (red, green, blue, and orange) with more than 38,000 one-way trip records.
Chapter 3: Data Processing
Downtown Boston is chosen as the study area because of the concentration of destinations of transit trips in this area, the dense transit network provided, and the
unavailability of other modes for rail users besides the subway and walking. Among the total 38,888 trips, about 15,000 destination locations are geocoded. There are 6500 destinations in the study area. These trips are further classified into four types based on whether or not the trip involves a transfer and whether or not the destination is near the
boarding line. Only two types of trips that involve both transfer and non-transfer options will be analyzed. Each option is associate with a path. So for each destination, there will be two paths: the transfer path, and the non-transfer path. All factors associated with
both paths, such as in-vehicle time, transfer walking time, and transfer waiting time, and environmental factors, will be compared to examine how they affect the transfer choice. So there are three steps in the data processing: trip selection, path calculation, and variable generation.
3.1 Study Area and the MBTA Subway System
This thesis focuses on the distribution portion of trips that involve the transfer option. Therefore, trips that end in the Downtown area are the target for analysis because in this area many riders have a transfer option to get close to their destinations. This area also
includes destinations of a huge number of trips, more than 6000 trips in this data set, which can provide ample observations for this type of analysis. The downtown area is a high-density built-up area with a good pedestrian environment. There are very few bus lines, and so there are no options for transit riders except for the subway and walking. This reduces the complexity of options that riders may face when they decide whether or
not to transfer. The area of Downtown Boston was defined based on both geographical features and transportation network characteristics so that few potential trip paths are cut off by the boundary. The area is bounded by Charles River to the north, Mass Turnpike to the south, Boston harbor to the east, and Massachusetts Avenue to the west.
Four MBTA subway lines run through this area with 21 subway stations. The four
transfer stations have a huge number of the transfers everyday, for example, Park Street has over 56,000 daily transfers between the Red Line and the Green Line (MBTA 1997). In fact nearly 25% of all passengers boarding Red Line trains at stations upstream of Park Street, in both south bound and north bound directions, transferred to the Green Line west bound at Park Street (Wong 2000).
Note that Haymarket is treated as a transfer station between Green Line and Orange Line, but North Station is not, because at North Station riders must egress from one station, walk to another station, and pay for entry again. Downtown Crossing is also treated as a transfer station between the Green Line and the Orange Line because there
is a direct connection between Downtown Crossing and Park Street. Figure 3-1 shows the study area.
Subway Lines, Stations, and Transfer Stations in Downtown Boston
Line Stations Transfer Station
Charles/MGH
Red Line Park Street Yes
Downtown Crossing Yes
South Station
Bowdoin
Government Center Yes
Blue Line State
Aquarium
North Station
Haymarket Yes
State
Orange Line Downtown Crossing Yes
Chinatown NE Medical Center Back Bay Mass Ave North Station Haymarket Yes
Government Center Yes
Park Street Yes
Green Line Boylston
Arlington Copley
Hynes/ICA Prodential
Symphony
Data is obtained from field survey
3.2 Geocoding and Trip Selection 3.2.1 Geocoding
The first step in processing the survey data is geocoding all destination locations to the street network using ArcView 3.2. All destination locations are recorded as the nearest landmark to the destination, which might be a street mailing address, an intersection of two streets, a name of a store, an institution, or an MBTA station. The data is cleaned before it is entered into ArcView. This is done in Oracle 8.2 with a Lookup table created using SQUPlus. Errors and misspells are corrected, landmarks are replaced by their street addresses, and different spellings for one address are unified. Zones are added to
the address to avoid the miscoding the same street name in different cities. This is a really time consuming work. However, there are still some locations not geocodable because of missing information. After the clean-up, about 15,000 destinations are
geocoded to a street network. We assume there is no system bias during the geocoding process.
3.2.2 Trip Exclusion
After the geocoding process, there are about 6500 destination points located within the study area representing the same number of trips, but only 1313 locations because some destinations serve multiple trips. The data must be further cleaned as follows before they can be used for the analysis.
Step 1. Egress station must be one of the 21 stations. Otherwise the trip is excluded. Step 2. Egress mode must be walking. Otherwise the trip is excluded.
Step 3. To simplify the analysis, only one-transfer trips will be considered since it is the case with most trips, and including more than one transfer trips will greatly complicate the analysis. So trips involving both Red Line and Blue Line are excluded from the data set. The number of these excluded trips is only about 40.
Step 4. Transfers among the branches of Green Line are different from other transfers because of the configuration of Green line network. These transfers happen at Copley, which is not designed as a transfer station like the four stations examined in this
research. Only 6 trips belong to this group, and these trips also are excluded from the analysis.
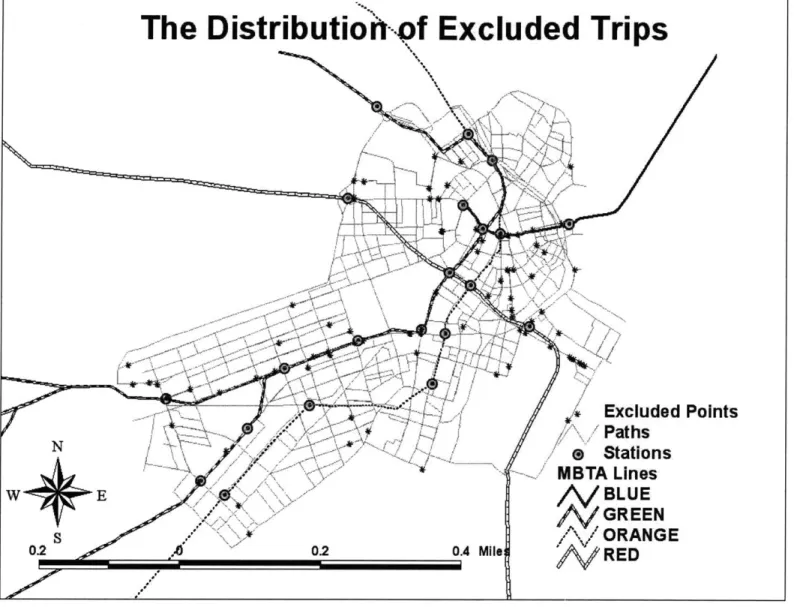
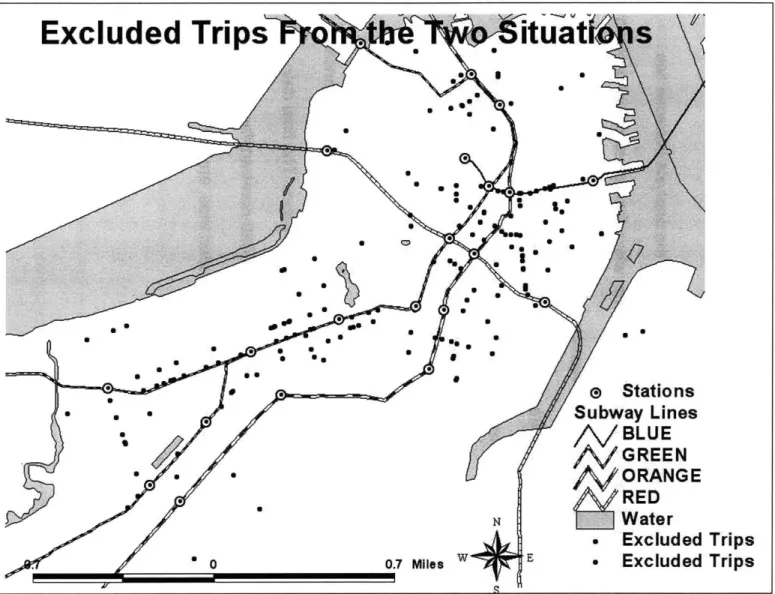
After these exclusions, there remain 6269 trips representing1 313 unique destination locations. The excluded points are small in numbers and scattered in the downtown area, so I assume there is no bias in the sample points chosen for the analysis. Figure 3-2 shows all the destinations of excluded trips.
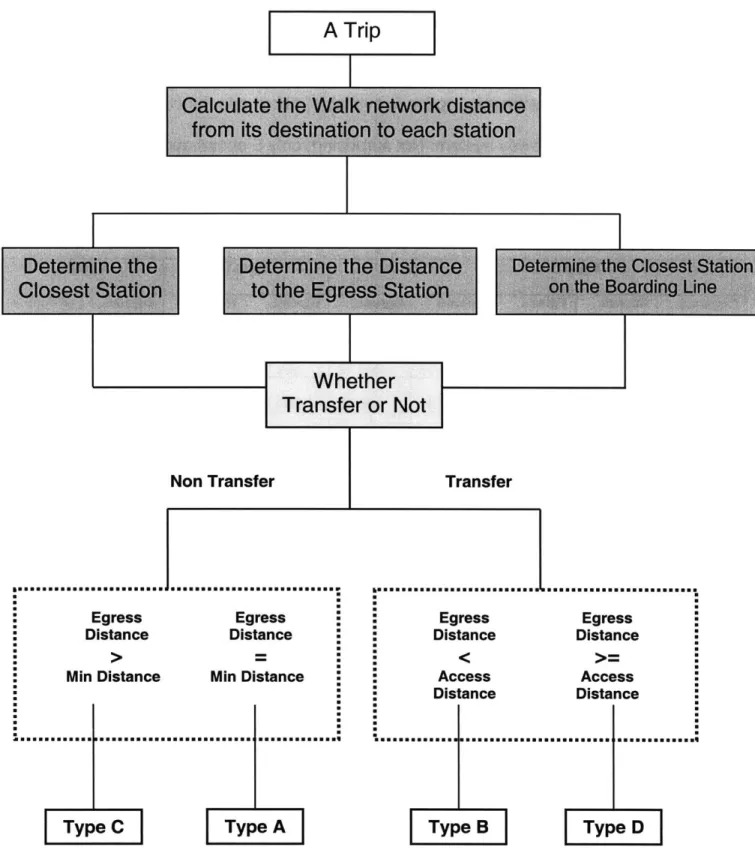
3.2.3 Trip Classification
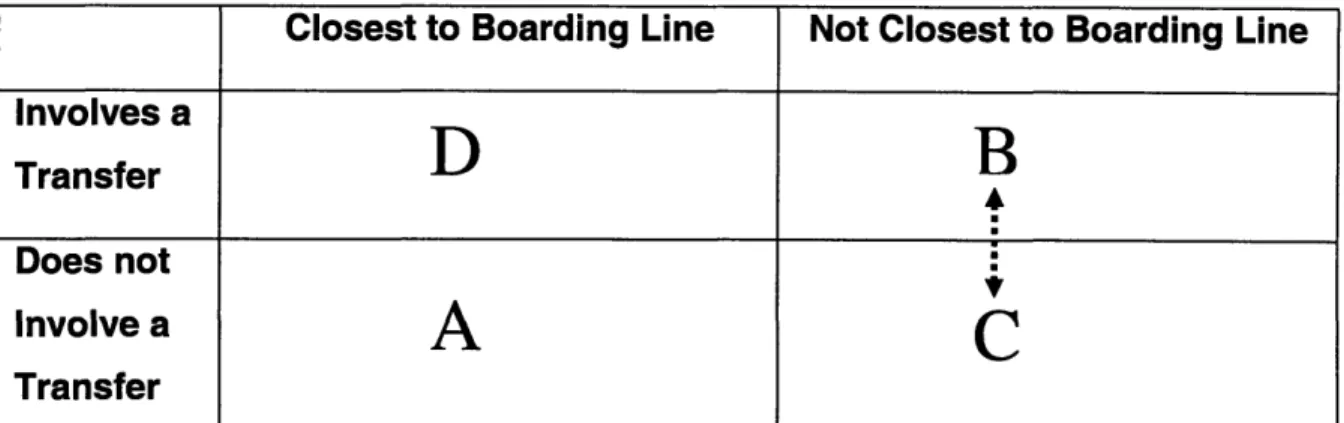
Next, all 6269 trips are classified using two criteria: whether or not a trip involves a transfer, and whether or not its destination is closest to the boarding line. So there are four combinations: non-transfer & closest to the boarding line, transfer & closest to the boarding line, non-transfer & not closest to the boarding line, transfer & not closest to the boarding line. I name the four combinations as A, D, C, B respectively. Type B trips involve those who transfer to get close to their destination, and that is what a transfer is all about. In type C, riders prefer walking though they can save walking time by
transferring to another line. Type A trips do not have a credible transfer option, since the rider can access the destination from the nearest station without transfer. We expect this is the biggest group of trips. Type D is not rational because the rider transfers but does not egress from the nearest station to the destination. We expect there will be only a few observations in this group. Table 3-2 lists the two criteria and the four combinations. Figure 3-3 shows the options that riders have in each type of trips.
Figure 3-2 The Distribution of Excluded Trips
Trip Categories Based on Transfer Decision and the Egress Station
Figure 3-3 Four Types of Trips
B
S Station Subway Lines Destination Non-transfer Option Subway Lines Option ition CClosest to Boarding Line Not Closest to Boarding Line Involves a
Transfer
Does not Involve aA
C
Transfer Option ition C Table 3-23.2 Path Calculation
3.3.1 Network Distance Calculation
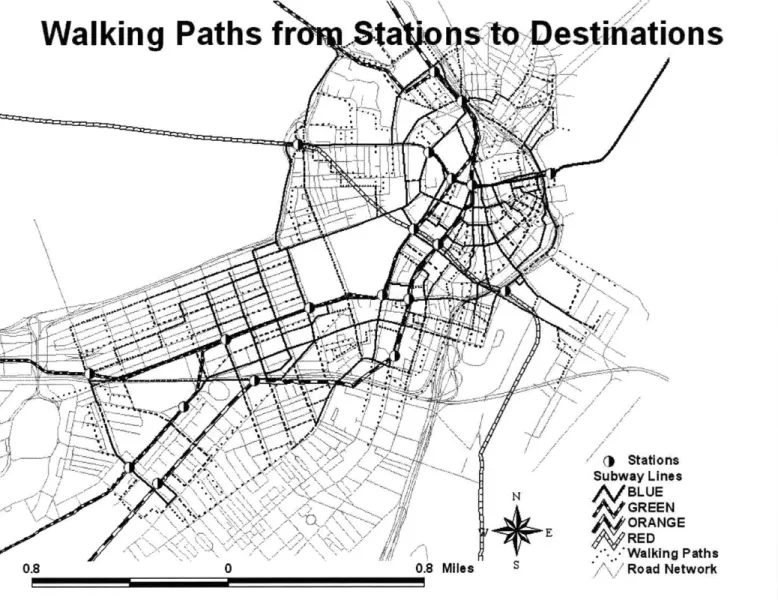
In order to classify each trip among the four types, I need to know the distances between each destination point and two stations. For transfer trips, one station is the egress station, and the other one is the nearest station to the destination on the boarding line.
For non-transfer trips, one station is the egress station, and the other one is the nearest station to the destination on any line. The two stations are the same if the non-transfer egress station is in fact the nearest station to the destination. Therefore, three different distances must be compared for each trip to be classified: the distance to the nearest station on any line, the distance to the egress station, and the distance to the nearest station on the boarding line. All distances are network distance and calculated in ArcView 3.x. Figure 3-4 shows the all the paths from each destination to all stations.
Refer to Appendix C for detail.
3.3.2 Distance Comparison
The walk network distance is calculated from each of the 1313 destinations to each of the 21 subway stations. The path data is entered into Access and five distances for each destination location are examined: the distance from the destination to the egress station, and the minimum distance to stations on the four subway lines. Then the data is joined back to the destination point shape file as a one-to-many join. Based on the five
distances, three numbers are generated for each trip/destination: the minimum distance, the distance to the egress station, and the distance to the nearest station on the boarding line. The minimum distance must be adjusted to exclude double transfers. For example, for all trips on the Red Line, all Blue Line stations except transfer stations are
Figure 3-4 Walking Paths from Stations to Destinations
excluded. A similar adjustment is made for the Blue Line. Through the comparison of the three numbers, four trip categories are created. The process is summarized in figure 3-5 and Table 3-3 gives the results of the four categories. As expected, type A is the biggest group with about 40% of total selected trips. 20% are type B trips, and 39% are type C trip. Therefore, when the transfer option is available, about one third of riders choose to transfer in the MBTA subway system. Not surprising, only 5 observations are in type D.
A Summary of the Walking Distance for the Four Types of Trips
Type D Type B Type C Type A
Distance Access Egress Access Egress Egress Minimum Egress Minimum Line Distance Line Distance Distance Distance Distance Distance
Distance Distance Mean 133.72 273.44 1226.03 246.12 522.69 264.77 209.16 209.16 Standard Deviation 129.50 159.48 643.20 188.43 289.59 173.48 152.98 152.98 Min 40.07 42.00 183.05 0.16 1.54 1.540 0.16 0.16 Max Max___ 355.60 473.73 3192.28 997.14 2442.10 1254.21 1159.26 1159.26 Total 5 1313 2428 2523 Number 1 1 _1
3.3.3 Final Data Set
Type B and Type C trips will be analyzed in the reminder of this thesis. Type D trips are excluded because they are small in number and do not reflect reasonable behavior, and type A trips are also excluded because they do not have a credible transfer option. Table 3-3
Figure 3-5 Trip Classification Process for Each Trip
E
A
Trip
Transfer
Egress Egress Egress Egress
Distance Distance Distance Distance
S Min Distance Min Distance Access Access
Distance Distance
I I * I
I I * I
j.Access.1 Aces
a..Distance.D.stance
The result indicates that for type B trips one transfer saves an average walking distance of 980 meters, while giving up one transfer in type C trips only increases the average walking distance by 258 meters. This indicates that on average, one transfer can save 722 meters, or 0.45 miles, of walking distance. This confirms that indeed there is a perceived transfer penalty -people transfer only when they can save a significant amount of time.
Not all the Type B and Type C trips are used for the analysis because two situations must be excluded. For type C trips, when the egress station is not the
nearest station even though the nearest station is on the same boarding line. There is still no reasonable transfer option available for this trip, but the rider could have got closer to the destination by egressing without a transfer from
another station on the same line. For type B trips, when the egress station is not the nearest to the destination but nearer than the nearest station on the boarding
line, there is still a trade off between the walking distance and one transfer. However, this is not the trade off that is explained only in terms of distance traveled. All trips with these characteristics are excluded. The final data set includes 3145 trips with 1123 transfer trips, and 2022 non-transfer trips. Figure 3-6, 3-7, 3-8 show the destinations for the excluded trips, and for the final set of transfer and non-transfer trips.
Excluded
Trips
*
tuatiys
Trips Involve One
Figure 3-8 Trips Involving Longer Walking Distance to Avoid One Transfer
3.3.4 Two Paths
If a trip involves a transfer, it is a transfer trip, otherwise it is a non-transfer trip. However, no matter whether or not a trip is a transfer trip, there are two options available: the transfer option and the non-transfer option. Each option is associated with a walking path to the destination. I call the walking path of the transfer option a transfer walking path, and that of the transfer option a non-transfer walking path. To make it clear, a non-transfer trip has both a non-transfer walking path and a non-transfer walking path available, but the transfer path was
selected. Similarly, a non-transfer trip also has the two paths available, but the non-transfer path is selected. All variables are created for both paths of each trip, and the comparison can then be made to determine which option has a higher utility to the rider.
3.4 Variable Generation I: Station Variables
Station variables are factors that only exist within transfer stations, which may affect the transfer penalty. They include time variables such as transfer walking time and transfer waiting time and facility variables such as change of level and availability of concessions.
3.4.1 Transfer Walking Time
Transfer walking time is the walking time from the transfer arrival platform to the transfer departure platform. Transfer time varies across different lines and different directions on these lines. For example, there are four different transfers
between the Orange Line and the Red Line: south bound Red Line to north bound Orange Line, south bound Red Line to south bound Orange Line, north bound Red Line to north bound Orange Line, and north bound Red Line to south bound Orange Line. Table 3-4 shows the estimated transfer waiting times for all
possible transfer movements based on field surveys by the author.
Table 3-4 Transfer Walking Times
To Red Line Orange Line Green Line Blue Line
From South North South North East West West East
Green West 17 14 31 50 20 20 Line East 17 14 31 50 20 20 Orange South 60 56 117 117 130 116 Line North 50 57 217 217 32 30 Red South 60 54 17 14 Line North 56 57 17 14 Blue West 130 32 20 20 Line East 116 30 20 20
All times are in seconds
3.4.2 Transfer Waiting Time
Transfer waiting time refers to the time that a traveler waits at the platform to make the transfer trip. It is calculated as half the headway of the subway line. For the Red Line, the headway estimate is the combined headway of both Braintree and Ashmont trains. For the Green Line, it is the combined headway of B, C, D, and E lines. Therefore, the headway of the Green Line at different downtown
stations can be different: specifically Haymarket has longer headways than Government Center or Park since not all trains go to Lechmere. Similarly, the Hynes Convention Center has a longer headway than the downstream stations on the Green Line after Copley because the E line does not serve it. Table 3-5 lists the estimated waiting time for the four lines. The headway data is obtained from the MBTA website.
Table 3-5 Transfer Waiting Times of the MBTA Subway in Downtown Boston
Line Waiting Time Transfer Stations
Red Line 224 Park and Downtown Crossing
Orange Line 300 State and Downtown Crossing
Blue Line 240 State and Government Center
Green Line I 89 Park and Government Center
Green Line li 540 Haymarket
All times is in seconds
3.4.3 Transfer Facility
Transfer facility may affect the transfer penalty through the general condition of a transfer station, the layout of platforms, the design of stations, and available
opportunities. In this research, I choose two factors in the analysis: the existence of a concession on the transfer platform, and the need to change platform levels between arrival and departure locations (Crockett 2001). The existence of concessions is believed to ease the discomfort and anxiety during transfers, and make the transfer waiting time more pleasant, thus reducing the transfer penalty. The change of level refers to whether the transfer involves changing levels. In