Assessment of High-Temperature Self-Assembling
Battery Implementation based on the Aluminum
Smelting Process
MASSACHUS 2S ITUTE OF TEHloY
by
--Isabel T. Gar6s Villar
NOV 19
2010
Ingeniero Industrial
LIBRARIES
University of Cantabria, Spain 2007
Submitted to the Department of Materials Science and Engineering in Partial Fulfillment of the Requirements for the Degree of Master of Engineering in Materials Science and Engineering
at the
Massachusetts Institute of Technology ARCHIVES September 2010
@ 2010 Isabel T. Garos Villar. All rights reserved.
The author hereby grants to MIT permission to reproduce and to distribute publicly paper and electronic copies of this thesis document in whole or in part in any medium now known
or hereafter created.
Signature of Author _
uier ent rials Science and Engineering
9 August, 2010
Certified by
Donald R. Sadoway
. Elliott Professor f Materials Chemistry Thesis Supervisor
Accepted by
Christopher Schuh Chair, Departmental Committee on Graduate Students
Assessment of High-Temperature Self-Assembling
Battery Implementation based on the Aluminum Smelting
Process
by
Isabel T. Gar6s Villar
Submitted to the Department of Materials Science and Engineering on 9th August in Partial Fulfillment of the Requirements for the Degree of Master of Engineering in Materials Science and
Engineering
Abstract
Renewable power sources are a promising alternative to the electrical generation by conventional sources of energy, limiting the emissions to the atmosphere and reducing the dependence on coal or oil. But some of these sources (wind or sun) have one major drawback, which is their variability.
Apart from that, electricity production has to match the demand at any moment, so the supply systems are built and operated to match the highest demand. Decoupling production from consumption can report great advantages and that is the main reason to develop cost-effective technologies that allow electricity to be stored on a large scale.
The high-temperature self assembly battery (also known as Liquid Metal Battery) is a promising technology. This battery works at high-temperature so that all its components are in liquid form. The absence of solid-liquid interfaces enables the achievement of high currents, apart from high diffusivities and fastest kinetics. That gives the battery the power of storing huge amounts of energy.
In order to evaluate the cost of these stationary storage systems, we are trying to look at similar electrolytic industrial processes, such as the Aluminum smelting processes. The Aluminum Hall-Heroult reduction cell has a configuration similar to the battery so we will base our estimation of the cost on this system.
The capital investment of an Aluminum Smelter will be analyzed in detail, and based on this, an estimation for the cost of the Liquid Metal Battery will be calculated.
Thesis supervisor: Donald R. Sadoway
Acknowledgements
I would firstly like to thank Professor Sadoway for giving me the opportunity to work on this project and sharing with me his deep knowledge in the aluminum reduction process.
I would also like to express my gratitude to Luis Ortiz, for giving me guidance, support and advice throughout the whole process. Thanks also to Jim Yurko for his knowledge about the Aluminum Smelters, and to the rest of the group from which I have also learned about different topics through the weekly group meetings.
I also want to thank Rich Roth and Elsa Olivetti for their advice about cost modeling and Angela Locknar and Anita Perkins for their help with the bibliography.
I would like to thank some experts on different fields that helped me find the data that I needed to complete my work, especially, Max Wiestner, from ABB, Anthony Jones, from Worley Parsons, Michel Kuntz, from Rio Tinto Alcan and C6sar Inostroza, from
SNC-Lavalin.
To the friends I have made here and the ones I left back home, your support through the whole year has helped me to get the most of it. Thanks for believing in me.
I would also like to express my gratitude to Caja Madrid Foundation, which granted a Graduate Fellowship, that turned the dream of attending Graduate School in the United States into the degree from MIT I am about to earn.
And finally, I must thank my family. Thank you all for your love and support. Thank you all.
Contents
List of Figures ...-- ...---..----...- - - - .-9
List of Tables ... ... .-- . ... 11
Abbreviations and Acronym s ... 13
Chapter 1 Overview ... 15
1.1 Introduction... 15
Chapter 2 The Liquid M etal Battery... 19
2.1 Overview ... 19
2.2 Cell O peration... 22
2.3 Cell design... 26
2.4 The Energy Storage System ... 28
2.5 Characteristics of the Energy Storage System... 31
2.6 Applications and Com peting Technology ... 33
Chapter 3 Alum inum : The Solid Electricity ... 43
3.1 Introduction... 43
3.2 Alum inum production ... 45
3.3 The Hall-H6roult cell ... 49
3.4 The Alum inum Sm elter ... 57
Chapter 4 Cost Analysis of the Alum inum Industry... 61
4.1 Overview ... 61
4.2 Raw materials requirement and production costs...63
4.3 The Alum inum Sm elter and its capital costs... 66
4.4 The Rectifier Substation... 73
4.5 Cell, Pot Tending and Technology ... 76
Chapter 5 5.1 5.2 5.3 5.4 5.4.1 5.5 5.6 5.7 5.8 5.8.1 5.8.2 5.8.3 5.8.4 5.9 Chapter 6 6.1 6.2 Annex A Annex B Annex C Annex D Annex E Annex F
Cost Analysis for a Large-Scale Energy Storage System ... 79
Introduction... 79
Construction and civil works costs... 81
Cells cost... 83
Power Conversion System costs ... 84
High Voltage Direct Current Electric Power Transmission ... 86
Active materials ... 88
Simplifications and assum ptions... 89
Base Scenario... 90
Sensitivity analysis... 95
Sam e capacity, sm aller footprint... 96
Minim um height, group com prised by eight cells... 99
Cell size sensitivity ... 101
Cell voltage, current density and cell efficiency sensitivity ... 103
Sum mary ... 105
Conclusions...107
Main conclusions ... 107
Future work... 111
List of Future Sm elters...117
List of Current Smelters...119
Alum inum Smelter Investm ent Breakdown ... 121
LMB Base Scenario Cost Model ... 123
LMB Scenario One Cost Model ... 125
List of Figures
Figure 1-1 Energy Storage in the Electric Power Industry (4)... 16
Figure 2-1 Aluminum Reduction Process (8) ... 20
Figure 2-2 Liquid Metal Battery... ... 21
Figure 2-3 Diagram of the charging and discharging reactions of a LMB ... 22
Figure 2-4 Mechanisms of voltage loss and their relation with current density (9) ... 25
Figure 2-5 Conceptual Cell Design based on the Design of the Hall-H6roult Cell (not to scale)... 26
Figure 2-6 Energy Storage System Scheme... 28
Figure 2-7 PCS Scheme with both AC and DC voltage input (DC voltage coming from Renewable Energy Sources)... .. ---... 29
Figure 2-8 Aluminum Smelter acting as a Energy Storage System... 30
Figure 2-9 Applications for the Liquid Metal Battery [Modified from (11)]... 33
Figure 2-10 Energy Storage reduces Energy Prices, Peak Energy Demand is provided by the Energy Storage System (4)...- ...-. 34
Figure 2-11 Energy Storage System Applications (12)... 36
Figure 2-12 Development status and power capability of several energy storage systems. The width of the bar indicates storage capacity (13) ... 39
Figure 2-13 Per-cycle cost for different Energy Storage Systems (11)... 40
Figure 3-1 Aluminum Annual World Production (15)... 44
Figure 3-2 Bayer Process Scheme (16)... 45
Figure 3-3 Alumina Reduction Cell... 46
Figure 3-4 Hall-H6roult Cell (Pre-bake Cell) [modified from (19)]... 49
Figure 3-5 Components of cell voltage and power consumption at 95% Faradic efficiency (22)... 53
Figure 3-6 Typical distribution of voltage in a state-of-the-art aluminum production cell. Ov indicates overvoltage (20)... ... . ---... 55
Figure 3-7 Typical Hall-H6roult cell heat loss distribution. Modified from (24)... 55
Figure 3-8 Aluminum Smelter Basic Configuration ... 57
Figure 3-9 Alcan Aluminum Smelter, Alma, Canada (25)... 58
Figure 3-10 Potline at Dubal Smelter (26)... 59
Figure 4-1 Regional location of aluminum smelting capacity, 2000 (28) ... 62
Figure 4-2 LIME Aluminum Price ($/ton) 2005-2010 (30) ... 63
Figure 4-3 Smelter's total operating cost (29) ... 64
Figure 4-4 Relationship Investment-Capacity for New Smelters [Data extracted from (32)]... 67
Figure 4-6 Aluminum Smelter Cost Overview (Courtesy from ABB)... 68
Figure 4-7 Smelter Subsystems Cost Overview (Investment $2billion, Capacity 360,000 tpy)...69
Figure 4-8 Rectifier Substation Cost Overview (Based on $2billion investment! 360,000 tpy capacity) [Courtesy of ABB (33)]... 73
Figure 4-9 Cost per kW-Current-Voltage relationship for High Power Rectifiers ... 74
Figure 4-10 Cost of the Rectifier depending on the Rated Current... 75
Figure 4-11 Reduction Cell Investment Breakdown... 76
Figure 4-12 Civil Works Investment breakdown... 78
Figure 5-1 Energy storage system disposition ... 81
Figure 5-2 Cost per kW/Power Relation for Low Voltage Inverters [Data from (35)]... 85
Figure 5-3 Cost per kWh Estimation for the different cathodes considered ... 91
Figure 5-4 Batteries cost breakdown ... 92
Figure 5-5 Non-active materials costs breakdown... 93
Figure 5-6 PCS costs breakdown... 94
Figure 5-7 Cost per kWh Estimation for the different cathodes considered ... 97
Figure 5-8 Cost per kWh estimation for the second scenario ... 100
Figure 5-9 Effect of cell size in cell cost ... 101
Figure 5-10 Cell efficiency for some cell voltages... 103
Figure 5-11 Cell cost for different voltages, current densities and efficiency... 104
Figure 5-12 Complete comparison among scenarios ... 106
Figure 6-1 Base Scenario Summary... 108
List of Tables
Table 2-1 Half-equations for the Liquid Metal Battery... 23
Table 2-2 Battery Systems Comparison (13)... 39
Table 2-3 Advantages and Disadvantages of different Energy Storage Technologies (11)...41
Table 3-1 Typical performance data of a 150kA pre-baked anode cell (21)... 52
Table 3-2 Range of operating variables for reduction cells (21) ... 52
Table 4-1 Smelting Electricity Fuel Source, 1998 (%) (28)... 64
Table 4-2 Average $/tpy investment... 68
Table 4-3 List of Smelters ... 70
Table 4-4 Investment breakdown (in million dollars)... 70
Table 4-5 Cell types, rated current and estimated surface area ... 71
Table 4-6 Investment unit installed... 71
Table 5-1 Dimensions of the cell... 82
Table 5-2 Cost of the different elements of the PCS... 86
Table 5-3 Cost of active materials... 88
Table 5-4 Cell Characteristics in Base Case... 90
Table 5-5 System Characteristics in Base Scenario ... 91
Table 5-6 System Characteristics in Case 1 ... 96
Table 5-7 Comparison between Base Scenario and Scenario One ... 97
Table 5-8 System Characteristics in Scenario Two ... 99
Table 5-9 Comparison between Base Scenario and Scenario Two ... 100
Abbreviations and Acronyms
ESS Energy Storage System LMB Liquid Metal Battery
A Amperes
V Volts
MW Mega Watts
kWh Kilowatts per hour
Al Aluminum
OCV Open Circuit Voltage
F Faraday constant
G Gibbs Free Energy
H Enthalpy
S Entropy
PCS Power Conversion System BOP Balance of Plant
DC Direct Current
AC Alternate Current
T&D Transport and Distribution
PHES Pumped Hydroelectric Energy Storage CAES Compressed Air Energy Storage
SMES Superconducting Magnetic Energy Storage EDLC Electric Double Layer Capacitors
DOD Depth of Discharge LA Lead Acid Battery NAS Sodium Sulfur Battery VRB Vanadium Redox Battery
I Current
R Resistance
LME Local Metal Exchange
EPCM Engineering, Procurement, Construction and Management BOP Balance of Plant
I
Chapter 1
Overview
1.1
Introduction
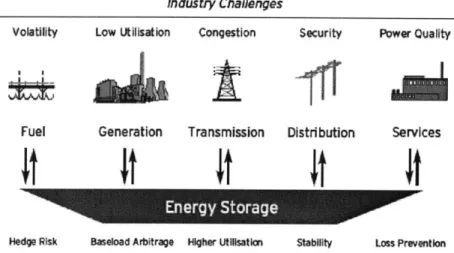
Electricity, unlike other commodities such as water, gas or steel, is difficult to store. The demand for electricity has constant daily and seasonal variations, and the maximum demand may only last a few hours each year (1). This is the main reason why electricity supply systems are built to operate so that production always matches demand. Without energy storage, the system has to be built in order to supply the highest demand. As a result, some power plants are only required to operate for short periods each year, causing great inefficiencies in the system. The production of electricity is also highly centralized and, often, a long distance away from its end users (2)
With Energy Storage Systems (ESS) electricity production can be decoupled from demand and it can help overcome other challenges such as (3)
- Improving low utilization of power facilities Relieving transmission congestion
- Improving the market potential of renewable energy generation
- Preventing losses from unreliable power quality for end-use consumer
Having large-scale electricity storage capacity available the system would need to be designed with a sufficient generating capacity to meet average electrical demand instead of peak demands. These peak demands could be covered by the ESS where energy is stored while the demand is below the average level.
Industry Challenges
Volatility Low Utilisation Congestion Security Power Quality
Fuel Generation Transmission Distribution Services
Energy Storage _,t
Hedge Risk Baseload Arbitrage Higher Uilsatin Stabity Loss Prevention
Figure 1-1 Energy Storage in the Electric Power Industry (4)
Enhancing grid stability can also encourage the use of large-scale ESS, avoiding situations such as regional blackouts, such as the one in Brazil and Paraguay in November 2009, which affected over 60 million people in Brazil (5) or the one that affected Germany, France, Italy, Belgium Spain and Portugal on November 2006, where over 15 million households were left without power after a big cascading breakdown (6).
Energy storage can be probably the best solution for these and other challenges, enabling better utilization of resources, better system efficiency, lower emissions, better reliability and security (1).
Nowadays there are several ESS, using different mechanisms to store the energy. A short review will be made of some of them since they are the competitors from the Storage System presented in this report.
Professor Donald R. Sadoway and his Research Group are currently working on the development of the so-called Liquid Metal Battery, a high-temperature self-assembling energy storage device with high energy/ high power capacity.
The technology, which will be analyzed in deeper detail later, can be explained as a battery whose components will be kept at high temperature so that they stay in liquid form. This configuration presents several advantages:
- liquid-liquid interfaces enable faster kinetics, faster ion transport, which leads to higher currents and higher storage capacity
- the absence of solid electrodes eliminates the problem of solid state degradation in electrodes, enhancing the lifetime of the battery
The inspiration for this new technology came from a very different one. A battery is an electrochemical device that transforms electricity into chemical potential energy and vice-versa. But there are other electrochemical processes that, although cannot be run in
reverse has some other interesting features as the ability to sustain extremely high levels of electrical current over a sustained period of years.
Aluminum smelters have been running this process for more than a century. This thesis will focus on analyzing and understanding this technology and the cost structure of
an aluminum smelter, and applying this information to develop a cost model for a grid-scale storage system based on the high-temperature self-assembling battery.
Chapter 2 will focus on the Liquid Metal Battery. Several aspects will be covered, including the cell design and operation and a better understanding of the battery as a part of the Energy Storage System will be given. A short review about applications and competing technology will also be included in order to be able to position this technology against its competitors.
The main topic dealt in Chapter 3 will be the production of Aluminum. The whole process will be analyzed, focusing on the reduction of Alumina in the Hall-H6roult cell and describing the structure of a smelter.
In Chapter 4, the cost structure of the Aluminum Industry will be analyzed, reviewing both the production cost as well as the capital investment required to build a smelter. This investment will be deeply analyzed up to the point where the results can be useful for the final aim of this work, reflected in Chapter 5, where a cost model for the Liquid Metal Battery is developed and analyzed. Sensitivity analysis will be made for a deeper analysis of the system.
In Chapter 6 main results and conclusions will be summarized as well as recommendations for future work.
Chapter 2 The Liquid Metal Battery
2.1
Overview
The system described in this work consists of a new kind of battery, with some features that will make it highly robust, reliable, long lasting and cost effective (7).
The liquid metal battery resembles the Hall-Heroult cell, employed in the industrial reduction of aluminum, and it was this process which first inspired this new concept. A more detailed description of the Hall-H6roult cell will be given in section 3.3, but it is worth giving a brief description now.
Aluminum production in know to consume high amounts of electricity. Aluminum plants can consume up to 300,OOOA at 4V (1.2MW). This electrochemical process can be described as follows.
Alumina undergoes later an electrochemical reaction, where the carbon anode is consumed in order to produce C02 and pure Al is produced, depositing at the bottom of the cell due to its higher density.
Figure 2-1 Aluminum Reduction Process (8)
The chemical reaction can be described as
2A1203 + 3C -+ 4A1 + 3CO2
This is an irreversible process. C02 escapes due to its gaseous nature, so the
carbon anode is consumed and has to be replaced frequently.
What if this process was made reversible? When run in reverse, the system could be used as a storage system, and energy could be injected back to the grid when required.
The reduction cells consist of an insulated rectangular steel shell. On the bottom of the cell sits the already reduced aluminum, acting as a cathode; above it, the electrolyte is comprised by a mixture of cryolite and molten alumina, while the anode is formed by carbon blocks. Current collectors are placed on the top and the bottom of the cell so that the electrical circuit can be closed. Above it all, the cell is covered to permit collection of
Nevertheless, this battery has some features that differentiate it from the electrolytic production of aluminum.
Three layers of liquid metals and molten salt are placed inside a container. Due to the differences in densities of each liquid and the immiscibility between them, they will be
able to separate naturally, enabling a much easier manufacturing process.
refractory lining
Figure 2-2 Liquid Metal Battery
The disposition of the layers of the battery can be described as follows:
The top and the bottom layers are respectively a low-density and a high-density metal alloys respectively, which will act as cathode and anode, while the middle layer will be a molten salt, acting as electrolyte.
This three all liquid layers disposition presents several advantages:
- Liquid-liquid interface enables faster kinetics. With faster ion transport, higher currents can be achieved, enabling huge energy storage capacity.
- The absence of solid electrodes presents another advantage. The most common problem in current batteries technologies related to lifetime is solid state degradation of the electrodes. If there is no solid electrodes, cycle life is expected to be highly increased.
2.2
Cell Operation
The battery operates at a temperature of about 700C. At this temperature, all three elements are in liquid state.
MA" + e'4- MA fi~q
MAU,,l- MA* +
e-MA + e+-> MAfi~q
MA -N MA+ +
e-Figure 2-3 Diagram of the charging and discharging reactions of a LMB
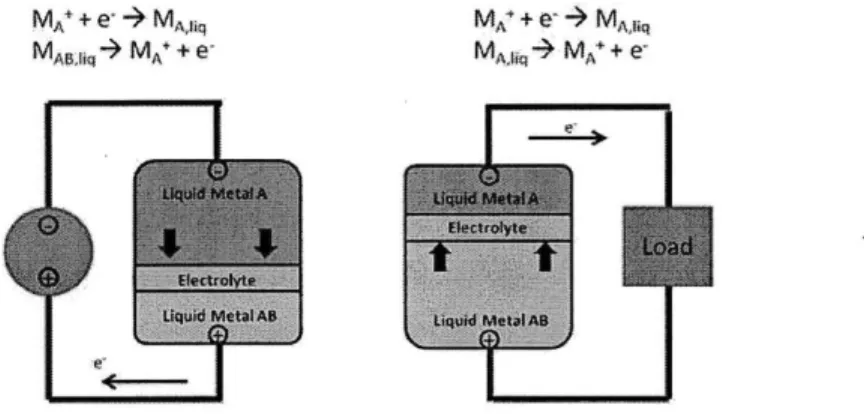
The chemical reactions that take place during charging and discharging of the cell can be described as follows:
Charging reaction MA+ + e- -+ MA,liq MAB,iiq -+ MA+ + e-Discharging reaction MA+ + e~ -+ MAB,liq MA,liq -+ MA+ + e
While charging, the cathode (MAB,Iiq) releases an electron and forms a positive ion (MA+), which travels through the electrolyte and recombines with an electron and
transforms into anode material (MA,Iiq).
During discharge, the process is reversed. An ion is formed at the anode (MA+) while
an electron is released. The ion travels back through the electrolyte and recombines with an electron at the cathode, where forming (MAB,Iiq) again.
One of the key characteristics of a cell is the cell potential, which along with the current is necessary to calculate the power of the cell.
The cell potential relates to the voltage difference between the terminals of the cell. The Open Circuit Voltage (OCV) can be measured when the system is disconnected from a power supply or a load, and is a function of the level of charge or discharge of the cell. During charge or discharge the cell is subjected to slightly higher (charge) or lower (discharge) voltages than the OCV.
In order to calculate the OCV of a cell, there are several parameters that need to be determined.
The cell voltage or electromotive force (emf) can be written as two half-equation, a reduction equation and an oxidation equation:
Ecoel = Ereduction + Eoxidation
The half-reactions for the Liquid Metal Battery can be written as
Charging Discharging
Reduction MA+ + e- -+ MA,liq MA+ + e~ -4 MAB,iiq
Oxidation MAB,Iiq -> MA+ + e~ MA,liq -> MA+ +
e-Table 2-1 Half-equations for the Liquid Metal Battery
The dissociation potential (E0) can be calculated by using the change in Gibbs free energy of formation
AGO
nF
where n is the number of electrons involved in the reaction and F is Faraday's constant, F=96,485C/mol.
The change in Gibbs free energy (AGO) is related to two thermodynamic functions, enthalpy (AH0) and entropy (AS0), being all of them somehow temperature dependent.
AGO = AH - T -ASO
The "9" indicates a standard state where the activities of the components are unity or equal to one another, but does not specify a temperature. If the activity of the components differs from this standard state, it is required to use the Nernst equation, which relates the dissociation potential and the activity of the components.
For a given reaction aA + bB " cC + dC, the Nernst equation can be written as:
RT[( -af
E=E - Ina b
n - F faA - aB1
Although the calculation of the cell voltage gives a theoretical value, this voltage is never achieved since there exist several mechanisms of voltage loss. The final voltage can be expressed as:
E = E0 - Tieak - ??act - 77ohm - ?lmt
- Leakage inefficiency (fleak): partial short circuit (chemical or electronic) across
the electrolyte
- Activation inefficiency (gact): sluggish electrode kinetics
- Ohmic inefficiency (nohm): electrolyte or electrode resistance
- Mass transport inefficiency (nmi): diffusion of active species to and away from the electrode interface
These losses are dependent on the current density of the cell, increasing with the current density of the cell.
12 01 0Era W 0.2 -0.0 00 0.5 1.0 1.5 20 Current density, j / A cm-2
Figure 2-4 Mechanisms of voltage loss and their relation with current density (9) The chemistry of the cell is therefore designed to minimize these losses, enabling a better performance of the battery. The liquid components and high temperature enable faster electrode kinetics, reducing the activation loss, as well as faster transport across the electrolyte, reducing ohmic losses.
2.3
Cell design
The design of the cell will be based on the design of the Hall-H6roult cell but adapted to the requirements of the system.
The materials for the cell are selected based on corrosion resistance, availability and low cost (7). The materials used as electrodes and electrolyte are still under research and therefore, several combinations of active materials will be analyzed in order to determine the best combination not only in terms of performance but also in terms of cost.
One of the requirements that the chosen materials have to fulfill is the difference in densities that allow the self-assembly of the cell upon melting. One of the electrodes need to have higher density than the electrolyte so that it stays at the bottom of the cell, while the density of the other electrode needs to be lower than that of the electrolyte so that it stays on the top of the cell.
Due to the characteristics of the cell, there are no initial reasons for the cell not to be scalable. The scalability of the cell is being researched, but for this study, it will be assumed that there is not limitation for the size of the cell in terms of cell surface. Nevertheless, the height of the cell (and therefore, volume of active materials) is determined by the energy capacity of the cell, which is related to the current density and discharge duration. The energy capacity is dependent on the volume of active materials
(electrodes and electrolyte) present in the cell.
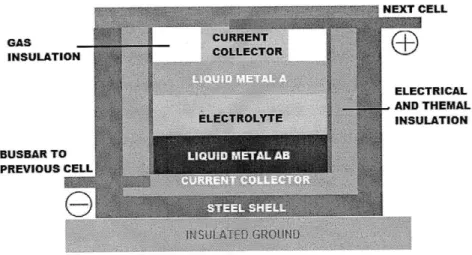
BUSBAR TO HEXT CELL GAS CURRENT INSULATION COLLECTOR ELECTRICAL .. AND THEMAL ELECTROLYTE INSULATION BUSBAR TO PREVIOUS CELL
The cell can be divided in several components:
- Steel shell: it serves as a container for the rest of the elements of the cell. It acts as the cell housing, giving mechanical support to the system.
- Insulation: it has two functions: regulate the heat losses from the bath and act as an electrical insulator. It also has to stand the high corrosive nature of the electrolyte.
- Current collectors: their main function is to allow the electrons to pass from the electrodes to the external circuit and vice versa.
- Electrolyte: it has to be immiscible with the materials that form the electrodes. It has to enable to movement of ions between electrodes but has to be electronically insulating.
Molten electrodes (Liquid Metal A and Liquid Metal AB): They are the active materials of the cell. They also enable to electrons to conduct from the current collectors to the electrode-electrolyte interface.
Gas insulation: as result of the charge and discharge process, there is a slight change of volume of the molten components. This gas layer is intended to assume this volume change. It also acts as a protection against degradation of the top electrode.
In any case, the final design of the cell will be determined in the future, once it is clear the best combination of active materials to use, and being careful to get a good design that fulfills the requirement of heat dissipation to maintain the cell working at the right temperature.
This report will be based in the design and materials used at the Hall-H6roult cells currently used in the aluminum reduction industry, which have proven to have a long life (these cells operate in a continuous basis for several years) at higher working temperatures (around 950*C).
2.4
The Energy Storage System
There is always the idea that the energy storage system is the battery by itself. The truth is that there are several subsystems that work together, each of them performing its
own function and facilitating the overall operation of the storage system. The complete system is therefore composed by these subsystems:
- Storage Medium (Active Materials)
- Power Conversion System (PCS) Balance of Plant (BOP)
Figure 2-6 Energy Storage System Scheme
The Storage Medium is what we would call the battery itself. It is the energy reservoir where the chemical energy is stored. In terms of energy, high-density storage allows for smaller supporting equipment, which is very convenient for large scale applications.
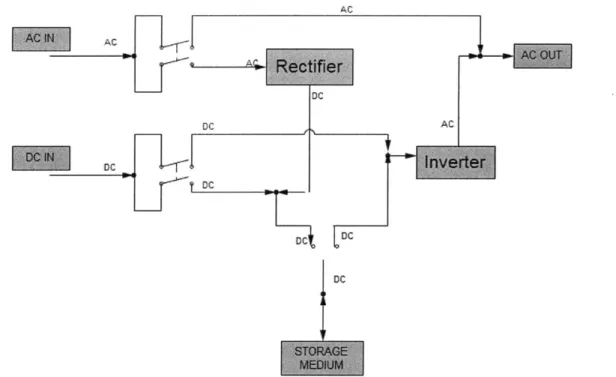
The Power Conversion System is the electrical interface between the grid, the electricity source and the storage medium. Typical components include DC-AC converter (inverter), AC-DC converter (rectifier), DC and AC switchgears.
DC DC AC DC c DC, DC DC
Figure 2-7 PCS Scheme with both AC and DC voltage input (DC voltage coming from Renewable Energy Sources)
The Balance of Plant is the facility and control system to house the ESS equipment. It includes transformers, electrical interconnects, surge protection devices, support racks for storage medium, control equipment...
Therefore, in order to account for the total cost of the storage system, we need to take into account each one of the subsystems.
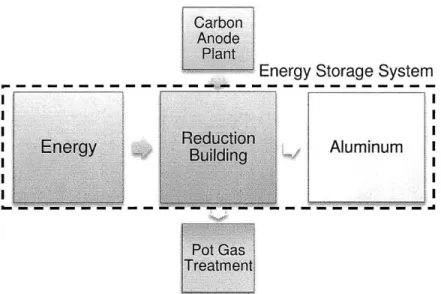
The aluminum reduction process is a well known electrochemical industrial process. If the process could be run in reverse, a huge amount of energy could be stored in the system and be released back to the grid when needed. It is because of this that the Aluminum Smelter can be treated as a big energy storage system.
The following graph shows the aluminum reduction process where a subsystem formed by the power system, the reduction building and the aluminum itself is been treated as an energy storage system.
Energy
Energy Storage System
Aluminum
Figure 2-8 Aluminum Smelter acting as a Energy Storage System
The reduction building comprises a series of reduction cells that can be the equivalent to the battery cells in an energy storage system. The power from the electrical grid and is transformed from alternate current (AC) into direct current (DC) with the help of the power transformers and rectifiers.
In 4.3 capital cost of the aluminum smelter will be analyzed and it will be later compared with the expected capital investment of an energy storage system.
2.5
Characteristics of the Energy Storage System
There are several parameters that can help characterize the energy storage system, and enable the comparison between different technologies. Some of these parameters are listed here (10):
- Unit size: describes the intrinsic scale of the technology. It gives an idea of the suitability for small-scale or large-scale applications. If the unit size is small related to the required capacity of the project, the cost of the system can increase relative to the technologies with a larger unit size. At the same time, some technologies have a fairly large unit size that prohibits small-scale energy storage.
Efficiency- is the ratio of energy output to the energy input. It can be defined as DC-DC efficiency or AC-AC efficiency depending on where the boundaries of the system are considered.
Cycle life: is the number of consecutive charge-discharge cycles that the installation can undergo while maintaining the rest of the specifications within limited ranges. They are defined against a chosen DOD depending on the application of the device.
Specific energy measures how heavy the technology is. It is measured in units of energy per mass, and is usually reported in MJ/kg. The higher the specific energy, the lighter the device. In the case of the LMB, the device is suitable for stationary applications only, so this characteristic is relatively unimportant, although it can have some impact when considering stackabiliy of the cells.
Energy density- measures how much space the technology occupies. It is measured in terms of energy per volume. The higher the energy density, the smaller the device. Once again, this is not very relevant to the LMB, as it is a stationary system.
In the case of our system, the size of the cell will be similar to the size of a modern Hall-H6roult cell (around 35m2) with an initial cell power of 350kW and a cell capacity of 2,800kWh. A complete description of the characteristics of the cell will be given in 5.7
2.6
Applications and Competing Technology
The characteristics of this technology make it suitable for stationary systems only. The three-liquid-layers configuration does not allow the battery to be used in non-stationary systems, since the acceleration and deceleration of the system could lead to
undesired flow of the liquid layers.
There are several applications where the proposed technology would be suitable. The following graph shows the range of possible applications for the system.
1000
10
Liquid Metal 1a0e 10 hr
-0 - -- - - - - -- -- TDF ilyBe ra - -- -- - -Dff- - - --- - -WEtC Cuistie 1mrf' hr 0.1 10 10 1 10100 kW kW MW MW MW
Storage Power Requirements for Electric Power Utility Applications
Datafmom Sandia Repat 2002-1314
Figure 2-9 Applications for the Liquid Metal Battery [Modified from (11)]
From all the possible applications, the characteristics of the system make it suitable only for some of them, which include:
- Commodity Storage
- Customer Energy Management (UPS)
- Rapid Reserve
- T&D Facility Deferral
In any case, the final design of the system will differ among applications, and will optimize the facility for that particular application. A short description of the different applications will be now given, although a deeper study and analysis of these applications is beyond the scope of this report.
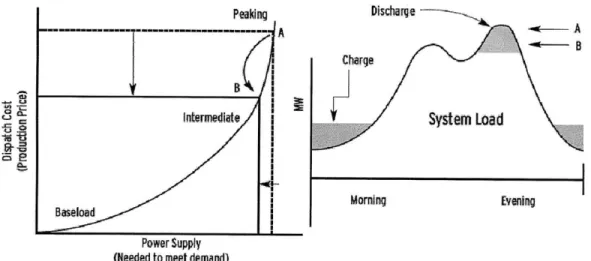
Commodity storage, also known as peak shaving or load leveling is based on the daily fluctuations in the demand of electricity. In open electricity markets, electricity price follows demand. An energy storage device can generate revenue by purchasing electricity when it is cheaper (low-demand hours) and selling it back to the grid when the price is higher (peak hours). Load-leveling also permits the delay of the need of peak-load generators (with high marginal costs), enabling the base-load generators (with lower marginal costs) to maintain a constant production.
Peaking Discharge
Morning Evening
Baseload
Power Supply (Needed to meet demand)
Figure 2-10 Energy Storage reduces Energy Prices, Peak Energy Demand is provided by the Energy Storage System (4)
For commodity storage, due to the characteristic of the generation facilities, only large-scale energy storage facilities measuring in the 100s of MWs with discharge endurance of many hours will most likely be successful (3).
In Customer Energy Management (UPS), what is sought is to avoid any power outage that could cost the business millions of dollars. Uninterruptible Power Systems (UPS) are designed to supply energy to the facility in case of a power failure. A key requirement for this application is fast response time, as opposed to backup generators
that require some time to reach full power. The system will need to supply full power for a short-time (5 to 30 minutes) while the main power source is reestablished or all the equipment is safely disconnected.
Rapid Reserve, also known as Spinning Reserve, is the generating capacity available in a short time in case a generator goes out of operation or any other disruption happens. The system is designed so that the group of generators has to be able to accommodate the loss of the largest generator in the group, and therefore, all the generators are working under their rated power, out of their optimum in efficiency. Having an energy storage device could reduce the need of over-sizing the generators, so that they could work at their rated power, increasing the efficiency of the grid.
T&D Facility deferral. When the demand for electricity approaches the capacity of the line, new lines and transformers have to be installed. These new lines and transformers are always larger than needed, so, as the demand grows steadily, the new facilities are underused for the first years of operation. A solution to avoid the installation of these new lines temporarily could be to install an energy storage facility close to the load center, and delay the installation of the new lines until it is economically justified.
In terms of Renewable Energy Management, there are two ways of enhancing the value of energy produced by renewable sources, such as wind or sun. These sources are weather dependent and intermittent so they need a storage device to be competitive. Electricity can be used therefore when needed and the storage device can enhance the quality of wind power, which due to its variability sometimes has problems with voltage and frequency. Besides, the energy storage device could act as a 'time-shifter' storing the electricity when its price is low and selling it back to the grid when it is high.
A deeper analysis of these applications can be made in order to study the suitability of the proposed energy storage technology, but this work is beyond the scope of this report but can be recommended as future work.
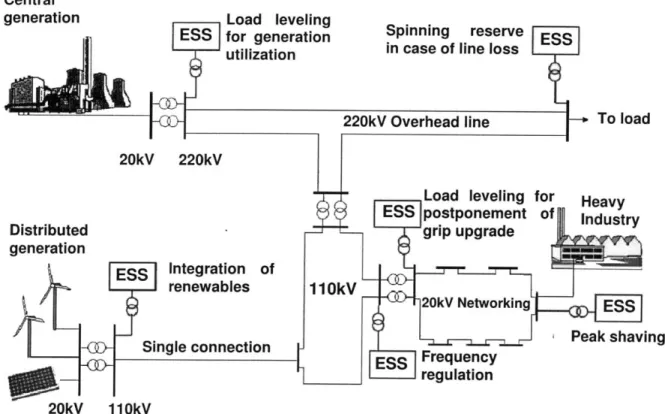
Load leveling for generation utilization
Spinning reserve in case of line loss
20kV 220kV Distributed generation Load leveling postponement grip upgrade Heavy Industry Integration of renewables Frequency regulation i Peak shaving 20kV 110kV
Figure 2-11 Energy Storage System Applications (12)
Nowadays there are several operating technologies allowing energy storage (13):
- Pumped hydroelectric energy storage (PHES): it is the largest energy storage
technology that is commercially available. Conventional systems comprise a reversible pump-turbine generator-motor and two large reservoirs at different levels. The reservoirs are connected to each other by water conduits via a pump-turbine. During off-peak periods, water is pumped from the lower reservoir to the upper reservoir, while during peak hours, the water is released back to the lower reservoir, thus generating electrical power.
. Compressed air energy storage (CAES): it uses pressurized air as the energy storage medium. An electric compressor is used to pressurize the reservoir using off-peak energy, while air is released from the reservoir through a turbine during peak hours. Aquifers and caverns are used as storage locations, while small systems can use pressurized tanks.
Central generation
- Superconducting magnetic energy storage (SMES): these systems store energy in the field of a large magnetic coil with DC current flowing. DC can be converted back to AC when needed. Low temperature SMES cooled by liquid helium are commercially available.
- Electric double layer capacitors (EDLC): electrostatic energy is stored in an electric double layer capacitor. The energy density is lower than that of secondary batteries, but it is suitable for fast discharge and charge applications as compared to secondary batteries.
- Flywheel: it is an electromechanical device that couples a motor generator with a rotating mass to store energy for short durations. The device is 'charged' and 'discharged' via an integral motor/generator. During a power outage or other disturbance, the kinetic energy stored in the rotor is transformed into DC electric energy by the generator and the energy is delivered at constant voltage and frequency through an inverter and a control system.
- Batteries: there are several types of batteries, which one of them has its own particular operational range and capability. Some examples of batteries are (3):
Lead Acid batteries: there are two main types, flooded and valve-regulated. There batteries have high reliability and low cost, what make them suitable for a wide variety of market applications, although MW-scale facilities have been predicted to have operational difficulty. The average DC-DC round-trip efficiency is 75% to 85%, and a useful life of 250-1,000 charge/discharge cycles, being degraded by temperature, depth of discharge, fast cycling and other factors. LA batteries are the cheapest energy storage technology, although due to their short life, they can sometimes become more expensive than alternative technologies.
Nickel-Cadmium batteries: these batteries are slightly more expensive than lead acid batteries, but they have better operating capabilities and reliability and longer cycle life, allowing for lower ownership cost. They have been
proven to be suitable for large-scale energy storage' for frequency and voltage regulation applications. The average DC-DC round-trip efficiency is 60% to 70% and cycle life of 1,000-3,500 charge/discharge cycles, although at low depth of discharge (DOD) life cycle expectations can reach 50,000 cycles.
- Flow batteries: they store and release energy through a reversible electrochemical reaction between two electrolytes. In these batteries, power (MW) and energy (MWh) ratings are independent of each other in the unit's design. The power is related to the number of cells while the energy storage capacity is determined by the size of the electrolyte tank. As they are highly flexible, they can support a wide variety of applications in diverse markets. Vanadium redox flow batteries have an efficiency around 85%, with a cycle life of at least 10,000 charges and discharges; Zinc-bromine flow batteries have an efficiency around 80% and a cycle life of at least 2,000 charges and discharges; Polysulfide bromide flow batteries have an efficiency approaching 75% and an estimated life around 15 years; Cerium zinc flow batteries have a DC-DC efficiency of 70% and an estimated life of 15 years.
Sodium Sulfur (NAS) batteries: these batteries present an average round trip efficiency of 90%. It works at a temperature of 3209C to 340LC and an output voltage of 2V. Unless other chemical batteries, it has no memory effect or self-discharge. NAS systems can provide power either in a single, continuous discharge or in a larger but shorter pulse of power which allows the system to perform a variety of market applications.
The following table shows a comparison of these battery systems, based on a 1-MW system operating 8h/day.
AC-AC ACA ie First- . Usual Dep Deep Capital and20-Year Cycle Round trip Time Environm. DOD Discharge Operating
System ~~CapitalDOOprtn
ystem Life efficiency Cost Risk N Capability Cost2
* ($/kWh) (>70%) ($/kWh)
Pb-acid3 2000 45 1550 Medium 25 No 11,769
Ni-Cd 10800 65 2000 Medium 30 No 4,644
Li-ion4 20000 85 2700 Very little 40 Yes 2,541
NaS 3000 58 500 High 33 Yes 5,003
Zn/Br2 2500 60 1200 High 33 Yes 7,828
VRB 10000+ 72 630 Very little 55 Yes 3,078
Table 2-2 Battery Systems Comparison (13)
In the last column, the costs calculated for a 20-year operation time are reported, showing that the systems with longer life have lower costs, making obvious that any extension of the battery life is a key factor to reduce overdil costs (13).
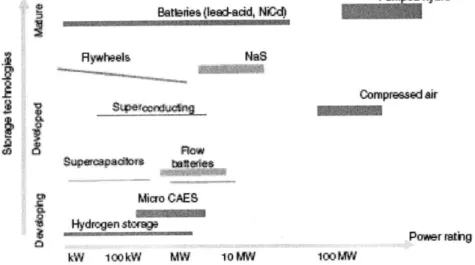
The following graph shows the state of development of the different energy storage systems as well as their power capacity.
Bani(Ieai cid, Nid}
Rywheela NaS compresad air SUpe=adkn. taistes Micro CAES Hydrgn storge kW 100kW MW 10MW Power stig 100MW
Figure 2-12 Development status and power capability of several energy storage systems. The width of the bar indicates storage capacity (13)
2 At a cost of $0.05/kWh in the first year escalating at 3% per year with 8h per day of
operation and a 20-year life of 10800 cycles
3 Industry standard
4 Small systems
All these energy storage technologies have very different performance characteristics, increasing the difficulty of comparison among them.
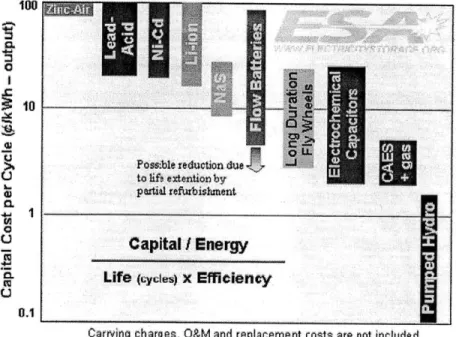
For applications that involve frequent charge/discharge cycles, such as load leveling, the best way to evaluate the cost of storing energy is to compare the per-cycle cost.
The following graph shows the relationship between capital cost, cycle life and efficiency. After evaluating the expected cost for the Liquid Metal Battery, it will be compared with these technologies.
0
~10
Poss ble reduction due to ihf e xtention byO partial refurbishment
Capital / Energy
Life (cyles) x Efficiency
Carrying charges, O&M and replacement costs are not included
Figure 2-13 Per-cycle cost for different Energy Storage Systems (11)
In any case, every technology has different advantages and disadvantages that
make them suitable for a certain range of applications. The following chart shows the different storage technologies, their advantages, disadvantages and possible applications.
Storage Main Disadvantages Power Energy Technologies Advantigs (Relative) (Application) (Application) Pumped High capacity, low Special Site
Storage cost Requirement
CAES High capacity, low Special Site
cost Requirement, Need
Gas Fuel
Flow Batteries High capacity, Low Energy Density Independent
Power and
Energy Ratings
Metal-Air Very High Energy Electric Charging is Density Difficult
NaS High Power & Production Cost, Energy Densities, Safety Concerns
High Efficiency (addressed in design)
Li-ion High Power & High Production Energy Densities, Cost, Requires High Efficiency Special Charging
Circuit
Ni-Cd High Power &
Energy D
Other High Power & High Production Cost
Advanced Energy Densities,
0
Batteries High Efficiency
Lead-Acid Low Capital Cost Limited Cycle Life
when deeply
0
discharged
Flywheels High Power Low Energy density
0
SMES, DSMES High Power Low Energy density, high production cost E.C. Long Cycle Life, Low Energy density Capacitors High Efficiency
0 Fully capable and reasonable
0
Reasonable for thisapplication practical or economical
o
Feasible but not quite Table 2-3 Advantages and Disadvantages of different Energy Storage Technologies (11)3
Chapter 3 Aluminum: The Solid Electricity
3.1
Introduction
Aluminum (Al), sometimes known as solid electricity (14), is the most abundant metal of the Earth's crust, comprising about 8.3% by weight of it. It does not exist as a metal in nature, due to its high affinity to oxygen. It is mainly found in bauxite ore, which contains hydrated forms of aluminum oxide, notably gibbsite (A1203-3H20) and boehmite
(A1203- H20). The composition of the bauxite ore varies with the location of the deposit but
its content in alumina (A1203) stands between 40% and 60%. Some of the highest quality bauxite deposits in Australia, Brazil, Guinea and Jamaica can present higher concentrations of alumina.
Although aluminium is now the second most used metal, it could be considered a 'newcomer' among the common metals, because of the difficulty in extracting it from its ores.
World Production
50.000.000 40.000.000 30.000.000 20.000.000 -10.000.000 0 1940 1950 1960 1970 1980 Year 1990 2000 2010 2020Figure 3-1 Aluminum Annual World Production (15)
The previous chart shows the evolution of the annual production of Aluminum. The current annual production is around 40 million metric tons, but this production increases as the demand increases due mainly to the development of the Asiatic economies.
3.2
Aluminum production
The production of aluminium includes two main stages:
- Production of aluminium oxide (alumina A1203) from aluminum ores (mainly bauxite) using the Bayer process.
- Production of aluminium from aluminium oxide by electrolysis using the Hall-H6roult process.
These two processes can be decomposed also in several stages.
The Bayer Process, invented in 1887 by Karl Bayer, enables the extraction of alumina from the ore. The whole process comprises several steps:
1. Raw material preparation
2. Digestion, in which A1203 is extracted as sodium aluminate (NaAIO2) by a
solution of sodium hydroxide (NaOH) at high temperature and pressure 3. Clarification, where the process residue is separated from the NaAIO2
solution
4. Precipitation, where the aluminate is seeded with AI(OH)3 to nucleate the precipitation of gibbsite, which goes through succeeding precipitations and is finally calcinated to anhydrous alumina.
The Hall-Heroult Process, discovered simultaneously in 1886 by Charles Hall and Paul H6roult, is an electrolytic process that enables the extraction of aluminium from the aluminium oxide (alumina A1203).
In the Hall-H6roult process alumina (A1203) is dissolved in molten cryolite (Na3AIF6
)
inside a carbon-lined vessel, known as the cell. So Aluminum fluoride, AIF3, is also added
in order to reduce the melting temperature of the mixture. The operating temperature of the cell is around 960LC. This mixture is known as the bath.
This bath has four main functions:
- Passing electricity from the anode to the cathode
- Being a solvent for alumina to enable its electrolytic decomposition
- Providing a physical separation between the cathodically produced aluminum
metal and the anodically evolved carbon dioxide gas
- Acting as a heat-generating resistor that enables the cell to be self-heating
Current feed
CO, bubbles away
Liquid. etrolyte Aluminum depositing
onto liquid durminum
electrode
Operating Temperature: 930-C
Figure 3-3 Alumina Reduction Cell
Carbon anodes are immersed into the bath, carrying electrical current which then flows into the molten cryolite containing dissolved alumina. As a result, the chemical bond between aluminum and oxygen in the alumina is broken; the aluminum is deposited in the
bottom of the cell, where a molten aluminum deposit is found, while the oxygen reacts with the carbon of the anodes producing carbon dioxide (C02) bubbles. Once passed through the bath, the electrical current flows into the molten aluminum deposit and is then collected
by the bottom of the pot, usually known as the cathode (17).
The alumina reduction process can be described with these reactions (18) Cathode reaction: All+ + 3e- -+ Al
There are no Al3 ions present in the electrolyte, but other
complex ions, so a more representative reaction could be
AlF6 +3e -+Al+6F
Anode reaction: C
+ 20
2--+ CO2 +
4e-As oxygen is complexed in the electrolyte, the anode reaction presumably involves complex ions according to
2A120F6 2- + 2AlF6 - + C -+ 6AlF47 + CO2 +
4e-The overall equation can therefore be explained as
2A1203 + 3C -> 4A1 + 3CO2
Theoretical production and energy consumption
From the alumina reduction reaction A1203 + C -+ 2A1 +3CO 2 the theoretical production of aluminum can be calculated.
The production of 2 moles of Aluminum involves the consumption of 6 moles of electrons, which corresponds to 6 Faradays of electrical charge.
2 - Al atomic weight = 2 -26.98 = 53.96 g
mol
6 - Faraday = 6 .96,485 coulomb = 578910 coulomb
53.96 gAl gAl
The daily production of the cell can therefore be calculated as
9.32. 9.2-1~4 0s g Al I*-86,400 Coulomb seconds g Al
=
8.05--Coulomb second day day
Together with the alumina reduction reaction there is always a parasite back reaction
2A1 + 3CO2 -+ Al203 + 3CO
which implies that the total production is less than the calculated originally. Therefore, a term of current efficiency (r) has to be added to calculate the cell production. Most cells operate with current efficiencies of 90-95%. The best prebake available technology consumes 13.OkWh/kg Al with a current efficiency of 95%. Industrial average stays around 90% efficiency and a consumption of 15.OkWh/kg Al.
The energy consumed by the cell is a function of the voltage of the cell and the current flowing through it and can be calculated as
h Energy = Vceu - 1 -24
day
The production of aluminum by this electrolytic process involves the consumption of other raw materials apart from alumina.
In order to produce 1 kg of aluminum, the following materials are needed approximately:
2 kg aluminum oxide (Alumina A1203)
0.45 kg carbon
20 g aluminum fluoride (AIF3) 20 g cryolite (Na3AIF6)
13-15 kWh of electrical energy
Apart from this, other aspects as cell relining, labor or plant amortization are to be taken into account when calculating the cost of aluminum production, what will be treated
3.3
The Hall-Heroult cell
The reduction cell where the electrolytic process is carried receives the name of their inventors, and is known as the Hall-Heroult cell.
There are two different types of cells, depending on the way that the carbon anodes are produced. These two types are known as Soderberg cell and Pre-bake cell.
For the Pre-bake cells, the carbon anodes are manufactured in a different facility. Petroleum coke is mixed with pitch; the mixture is given a parallelepiped shape and then baked into furnaces to be transformed into a solid carbon block. These blocks are joined to rods and placed inside the cell. When the block is consumed it needs to be replaced.
On the other hand, in a Soderberg cell there is only one big anode per cell, housed inside a steel container. The mix of petroleum coke and pitch is introduced from the top of this container. The mix is baked while it moves from the top to the bottom, requiring some extra heat achieved by increasing the pot voltage. These anodes have a lower quality than the prebaked ones, and therefore Soderberg cells are always characterized by lower current efficiency.
The subject from this report will be mainly Pre-bake cells, since they are more common due to their better performances.
Fe H
Ce
e
m
f
shelThe picture above shows the typical configuration of a Pre-bake cell. The cell is composed of several elements with different functions. The cell has evolved since it was invented more than 100 years ago to accommodate the larger currents used nowadays. A typical modern reduction cell is about 6-9m long, 3-4m wide and 1-1.3m high.
The alumina reduction occurs in a vessel designed to fulfill several functions (17) Act as a container for the molten bath and aluminum
Resist to the high temperatures (around 9502C) of the molten liquids it contains
Resist to chemical attacks brought especially by the molten electrolyte constituents
Resist to wearing caused by alumina abrasive behavior
Reduce heat losses to a technical and economical optimal minimum
Be mechanically enough resistant, but also with sufficient elasticity in order to accommodate for the thermal and physical expansion of the materials it contains Collect the electrical current coming from the anodes with a minimum voltage drop
The vessel can be decomposed in several parts with a combination of different materials. The outer shell, usually referred as potshell, is made out of steel and serves as a container for other elements. At the bottom there are placed some layers of insulating and refractory bricks, which mission is mainly reduce the heat losses from the bath as well as stand the high temperatures from the bath
The inside of the cell is lined with carbon blocks, which are joined together with a mixture of pitch and carbon dust. These blocks constitute the container for the molten aluminum and the electrolyte. The bottom carbon lining collects the current exiting from the metal pad and transfers it to the current collector bars, made of iron, and whose mission is to transport the current outside the cell.
Due to the difference of densities between the molten aluminum and the electrolyte, the metal pad stays on the bottom of the cell while the electrolyte floats on top of it. It is in the electrolyte where the electrolytic reduction of alumina takes place, with the help of the carbon anodes which are placed on top.
On the inner walls of the container we can find a frozen ledge. The formation of this ledge is due to the difference of temperatures between the bath and the cell surroundings, and has two important functions. This ledge acts as a protective layer for the carbon lining, preventing the electrolyte from attacking the carbon lining. Without this protective layer, the aluminum and the carbon would form aluminum carbide, which would dissolve in the electrolyte causing the erosion of the wall. And it also acts as a temperature controller, being able to absorb the excess of heat produced in the bath and melt or grow thicker if the bath heat input decreases.
The carbon anodes can be also decomposed in several parts. It comprises a carbon block, a rod made with copper or aluminum, a yoke and studs made with iron. The carbon block is joined to the metallic stud pouring molten cast iron. Typical sizes for a carbon anode are 70cm wide, 125cm long and 50cm high (20). Up to 40 anodes can be found per pot, since the carbon of the anodes is consumed during the chemical reaction, and needs to be replaced on a regular basis. All the anodes are fixed to a structure, which distributes the electrical current to the anodes. An electrical motor and several levers are also placed in the structure, allowing the anodes to be raised or lowered, in order to control the voltage of the cell while operating.
The high temperature of the electrolyte makes it very reactive, so in order to avoid it burning to the air, on top of it there is a layer of material made of alumina and solidified bath, called 'crust'.
As the alumina reduction proceeds, the alumina dissolved into the cryolite is consumed and therefore needs to be restored on a regular basis. The mission of the alumina feeder is to restore the levels of alumina in the bath. To do this, it is equipped with a crust breaker, which opens a hole in the crust through which the alumina can reach the bath. Each cell can has from 1 to 6 alumina feeders and crust breakers, depending on the size.
As the reaction proceeds, C02 is produced in the anode, apart from other fumes that
need to be removed. These gases cannot be released into the atmosphere because they are contaminant so they need to be collected and directed towards the gas treatment
![Figure 2-9 Applications for the Liquid Metal Battery [Modified from (11)]](https://thumb-eu.123doks.com/thumbv2/123doknet/14107101.466173/33.918.235.743.388.730/figure-applications-liquid-metal-battery-modified.webp)