HAL Id: in2p3-00470415
http://hal.in2p3.fr/in2p3-00470415
Submitted on 6 Apr 2010
HAL is a multi-disciplinary open access
archive for the deposit and dissemination of
sci-entific research documents, whether they are
pub-lished or not. The documents may come from
teaching and research institutions in France or
L’archive ouverte pluridisciplinaire HAL, est
destinée au dépôt et à la diffusion de documents
scientifiques de niveau recherche, publiés ou non,
émanant des établissements d’enseignement et de
recherche français ou étrangers, des laboratoires
New gas-filled mode of the large-acceptance
spectrometer VAMOS
C. Schmitt, M. Rejmund, A. Navin, B. Lecornu, B. Jacquot, G. de France, A.
Lemasson, A. Shrivastava, P. Greenlees, J. Uusitalo, et al.
To cite this version:
C. Schmitt, M. Rejmund, A. Navin, B. Lecornu, B. Jacquot, et al.. New gas-filled mode of the
large-acceptance spectrometer VAMOS. Nuclear Instruments and Methods in Physics Research Section A:
Accelerators, Spectrometers, Detectors and Associated Equipment, Elsevier, 2010, 621, pp.558-565.
�10.1016/j.nima.2010.03.146�. �in2p3-00470415�
New gas-filled mode of the large-acceptance spectrometer
VAMOS
C. Schmitt, M. Rejmund, A. Navin, B. Lecornu, B. Jacquot, G. de France,
A. Lemasson, A. Shrivastava
1GANIL, CEA/DSM - CNRS/IN2P3, Bd Henri Becquerel, BP 55027, F-14076 Caen Cedex 5, France
P. Greenlees, J. Uusitalo
Department of Physics, University of Jyvaskyla, P.O. Box 35, FI-40014, Jyvaskyla, Finland
K. Subotic
VINCA Institute of Nuclear Sciences, P.0. Box 522, 11001 Belgrade, Serbia
L. Gaudefroy
CEA, DAM, DIF, F-91297 Arpajon, France
Ch. Theisen, B. Sulignano
CEA-Saclay DSM/IRFU/SPhN, F-91191 Gif/Yvette Cedex, France
O. Dorvaux, L. Stuttg´e
IPHC, UMR7178, IN2P3-CNRS et Universit ´e Louis Pasteur, BP28, F-67037 Strasbourg, France
Abstract
A new gas-filled operation mode of the large-acceptance spectrometer VAMOS at GANIL is reported. A beam rejection factor greater than 1010
is obtained for the 40
Ca+150
Sm system at 196 MeV. The unprecedented transmission efficiency for the evaporation residues produced in this reaction is estimated to be around 80% for αxn channels and above 95% for xnyp channels. A detailed study of the performance of the gas-filled VAMOS and future developments are discussed. This new operation mode opens avenues to explore the potential of fusion reactions in various kinematics.
Key words: Gas-filled spectrometer, Fusion reactions, Beam rejection, Transmission.
1. Introduction
Fusion-evaporation reactions permit prob-ing the structure and dynamics of fully equi-librated nuclei under extreme conditions of
1
Permanent Address: Nuclear Physics Division, Bhabha Atomic Research Centre, Mumbai 400085, India
angular momentum and/or temperature. For discriminating weakly populated evaporation channels from the overwhelming background due to other events, a highly selective and efficient device for detecting the evaporation
residues (ERs) around 0◦is necessary. This is
especially true at high beam intensities, where a good rejection of the unreacted projectile
is crucial. Additionally, since the evaporation residues after passing through the target are characterized by broad distributions in angle, energy and charge state, a large angular aper-ture and a high transport efficiency between the target and the detectors are required.
Depending on the ions involved, different arrangements of optical elements are used to achieve an adequate rejection of the beam and a reasonable collection efficiency of the ERs. While Wien Filters [1] or separated electric and magnetic dipoles [2] are based on a se-lection in velocity of the incoming ions, recoil mass spectrometers [3] disperse the particles according to their mass over charge state
ra-tio M/Q. Magnetic spectrometers select the
ions depending on the momentum over charge state ratio, or equivalently, magnetic
rigid-ity,Bρ = p/Q. Gas-filled magnetic separators
(Ref. [4] and references therein) take advan-tage of the difference in the mean charge state Q reached by beam and ERs along their trans-port in a gas at low pressure [5], yielding a magnetic rigidity which, to first order, is pro-portional to the mass of the ion [6]. This, in general, leads to a better rejection of the di-rect beam as compared to what is achieved
in vacuum. Additionally, theQ distribution is
narrow [7], resulting in an enhanced trans-mission of the ERs. Due to the deterioration of the mass resolution, caused mainly by charge exchange and multiple scattering in the gas, it is customary at gas-filled magnets to isotopically identify the reaction products by their characteristic decay (e.g. [8,9]). Al-though high beam rejection is currently pos-sible, the transmission is limited by the small acceptance of the existing devices [2,10–13].
Recently, a few large-acceptance magnetic spectrometers [14–17] were built and oper-ated under vacuum. We presently focus on the VAriable MOde Spectrometer (VAMOS) [16,17] at GANIL. VAMOS was originally designed to cope with the challenge inherent to the low-intensity SPIRAL1 radioactive ion beams. High efficiency and isotopic identification of the recoiling ion were among the major goals. Different modes of operation are available depending on the settings of the optical el-ements. The versatility of VAMOS has been exploited for the study of various mecha-nisms such as deep-inelastic collisions [18],
45 C foil He gas beam EXOGAM target quadrupoles dipole beam dump detection 1 m
Fig. 1. Schematic layout of the spectrometer and detec-tion system. VAMOS was placed at 0◦ with respect to
the beam axis. The focal plane detection system con-sists of two drift chambers followed by a Si wall and a Plastic scintillator. Typical trajectories calculated with ZGOUBI [22] for different angles at the target for beam particles (dashed lines) and evaporation residues (full lines) are shown.
fission [19] and direct reactions [20]. Isotopic identification of the reaction products was
achieved up toA ∼ 160. The present
commu-nication reports on the recent implementa-tion of a gas-filled operaimplementa-tion mode at VAMOS. This upgrade considerably extends the
capa-bilities of the device when operated at 0◦. To
characterize the new operation mode of VA-MOS, a fusion reaction studied previously [8] at gas-filled separators was used. Ion-optical calculations were performed to quantify the transmission of the ERs. The limitations of the new operation mode were identified, and further improvements are discussed.
2. Measurement and experimental results 2.1. Experimental set-up
The measurement was made using a 40
Ca beam at 196 MeV, delivered by the CSS1
cy-clotron of GANIL, incident on a 550µg/cm2
thick 150
SmF3 target evaporated on a carbon
backing (25µg/cm2
). A schematic of the exper-imental set-up is shown in Fig. 1. The spec-trometer consisted of a quadrupole doublet and a magnetic dipole (QQD configuration). The Wien filter was not used in the present work. The optical axis of VAMOS was placed
at 0◦ with respect to the beam axis. The first
quadrupole was placed at 40 cm from the
tar-get, and the dipole bending angle was 45◦.
Both the distance to the target and the dipole bending angle are variable at VAMOS [17]. In
the present configuration, a large acceptance in angle (Ω ∼ 60 msr) and in magnetic rigidity (∆Bρ/Bρ ≈ ±7%) is achieved, and the
max-imum magnetic rigidity Bρmax is 1.8 T-m. A
carbon foil ∼ 100µg/cm2
thick was placed 1 m upstream of the target to isolate the beam line from the gas-filled region. The whole section (∼ 8.6 m) between the carbon foil and the end of the detection chamber was filled with He gas at low pressure (p was varied between 0.1 and 1.4 mbar). The nominal magnetic
rigid-ity Bρ0, which defines the central (reference)
trajectory, was varied around the Bρ value
predicted by model calculations for the ERs produced in the reaction. The deflected direct beam was stopped inside the dipole chamber in a ”rake-like” plate made of tantalum and small aluminium pieces for minimizing the particles scattered onto the focal plane. The detection system consisted of two position-sensitive drift chambers (DCs), a windowless 500 µm thick Si wall (2 rows with 9 detectors of 5 cm × 7 cm size each) and a 15 mm thick
Plastic scintillator. The promptγ-rays emitted
by the reaction products at the target were detected using four segmented EXOGAM Ge clover detectors [21] placed at backward
an-gles. For each event, the position (x1, x2, y1,
y2) on the drift chambers, the energy loss
∆E = ∆E1 + ∆E2 in the DCs, the residual
en-ergy ESiin the Si wall, the chargeQP linduced
in the Plastic scintillator, and the time-of-flight between the target and the focal plane were recorded. The time-of-flight was derived using the timing signal of the Si detectors with
re-spect to either the time of theγ-ray detectors
(Tof) or the frequency of the cyclotron (TSi−hf).
The magnetic rigidity Bρ, angles (θ, φ) at
the target position and path along the spec-trometer were software reconstructed on an event-by-event basis [17] from the measured positions on the DCs. When combined with the time-of-flight, the trajectory reconstruc-tion permits the determinareconstruc-tion of the velocity vector of the recoiling nucleus at the target po-sition. The angle between the crystal of the EX-OGAM clover detector and the reconstructed velocity was used to obtain the Doppler
correc-tion to be applied to theγ-ray spectrum [17].
The energy loss ∆E, residual energy ESi and
chargeQP lwere used for tagging the reaction.
The ERs produced in the collision were
iso-0.5 1 1.5 2 2.5 10 10 10 10 10 1 10 -5 -4 -3 -2 -1
yield (%)
Gas mode
0.5 1 1.5 2 2.5 10 10 10 10 10 1 1 -5 -4 -3 -2 -1Vacuum mode
(T-m)
ρ
B
Bρ0±7% ERs beam target like FFFig. 2. Calculated magnetic rigidity distribution for the products of the40
Ca+150
Sm collision at 196 MeV. TheBρ distribution at the focal plane of the gas-filled VAMOS as obtained with ANAMARI [26] assumingp = 0.6 mbar is shown for the direct beam (dotted line) and the most prob-able reaction channels: target-like nuclei (dashed line), typical fission-fragment products (dashed-dotted lines) and ERs (full line). The inset shows theBρ distribution for direct beam (dotted line) and ERs (full line) as calcu-lated for the vacuum mode. The shaded areas define the acceptance of the spectrometer for ERs.
topically identified by the measurement of the
characteristic prompt γ-rays emitted at the
target and/or the radioactive α-decay in the
Si detectors.
The time-of-flight and energy loss were cali-brated using SRIM08 calculations [23] for the ERs produced in the reaction. The Si detectors were gain matched with a pulse generator and
calibrated using a233
U-239
Pu-241
Amα-source.
The resolution was typically ∼ 60 keV (FWHM). The energy of the heavy ions implanted in the
Si detectors computed with theα-calibration
was corrected for pulse height defect following the procedure given in Ref. [24]. The four EX-OGAM clovers were calibrated using standard sources, and the total photopeak efficiency was ∼ 3.5% at 1 MeV.
The fusion cross section for the present reac-tion was estimated to be ∼ 240 mb using a
sta-tistical model code [25]. The excited190
Pb com-pound nucleus decays either by fission (75%)
or particle evaporation (25%). TheBρ
distribu-tion at the focal plane of the gas-filled VAMOS calculated by the ANAMARI code [26] is shown in Fig. 2 for the unreacted projectiles and the dominant reaction channels. The calculation takes into account the charge equilibration, angular scattering and energy straggling in the 3
200 600 1000 1400 1800 0 10 20 30 40 50 60 70 80 90
E (MeV)
T
of(ns)
a)
target-like nuclei direct beam evaporation residues protonsHe atoms beam-like nuclei
0 10 20 30 40 50 60 70 80 0 5 10 15 20 25
E (MeV)
∆
E
Si(MeV)
b)
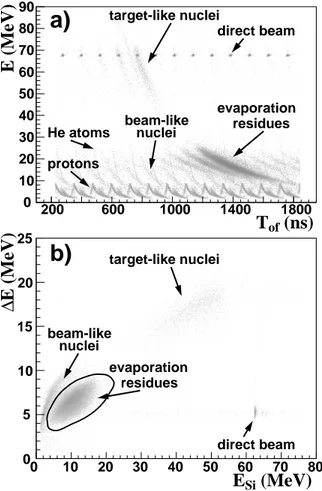
target-like nuclei direct beam evaporation residues beam-like nucleiFig. 3. Particle identification for Bρ0 = 1.5 T-m and
p = 0.1 mbar. a) Correlation between the total energy E = ∆E + ESiand the time-of-flight Tof. Repetition of the
structures every 122 ns is due to the cycling of the beam. b) Correlation between the energy loss ∆E and the resid-ual energy ESi. The contour illustrates the gate applied
for selecting ERs. In both panels, the contributions from the various kinds of particles are indicated. Note the sat-uration of the signal for direct beam particles in the Si detectors.
target and gas. The acceptance of the spec-trometer for ERs is indicated by the shaded area. The ERs are predicted to be well sepa-rated from the direct beam and other reaction products and efficiently transmitted (∼ 85% of
them reach the detectors forp = 0.6 mbar). The
inset shows theBρ distribution calculated for
the beam and ERs with the spectrometer in the vacuum mode, demonstrating the gain in beam rejection and transmission achieved by the gas-filled mode. With the vacuum mode of VAMOS, either the Wien Filter [27] or the dis-persive QQD mode achieves sufficient beam rejection in very asymmetric direct ics. For more symmetric and inverse
kinemat-2000 4000 6000 8000 100001kinemat-2000 14000 0 5 10 15 20 25 30 35 40 45
E
Si(MeV)
T
Si-Hf(a.u.)
protons He atomsFig. 4. Light-particle spectrum for Bρ0 = 1.57 T-m and
p = 0.12 mbar. Correlation between the energy ESi and
the time-of-flight TSi−hf for events in anti-coincidence
with the DCs.
ics, the measurements are restricted to low-intensity beams.
2.2. Particle identification and
characterization of the evaporation residues
The evaporation residues can in principle be discriminated from other reaction products using the correlation between the measured
total energy E = ∆E + ESiand the time-of-flight
Tof. Such a correlation is shown in Fig. 3a.
The direct beam and target-like nuclei can be seen to be well separated from the ERs. Beam-like particles scattered from the beam dump, protons originating from reactions in the beam dump as well as scattered He gas atoms can
also be observed. These overlap in the (E, Tof)
region of the evaporation residues, making the clean selection of the ERs based only on to-tal energy and time-of-flight difficult. The mea-sured energy loss was used for a further se-lection (Fig. 3b). The evaporation residues are well separated from beam-like particles in the (∆E, ESi) correlation. The signals induced by proton and He light particles are too low to trig-ger the DCs. These light particles lead to a non-negligible background in the energy spectrum
of the radioactiveα-decay of the ERs. Figure 4
shows the correlation between the energy
de-posited in the Si detectors ESiand the
time-of-flight TSi−hf. To select light particles, an
anti-coincidence with the DCs was required. Two intense structures are observed,
correspond-1000 3000 5000 7000 9000 0 500 1000 1500 2000 2500 3000 3500 4000
counts
E
Si(keV)
a)
185Hg
183Hg
186Pb
250 350 450 550 650 0 500 1000 1500 2000 2500 3000 3500 100 300 500 700 900 0 2000 4000 6000 X-rayscounts
E (keV)
186Hg 183Hg 185Tl 186Pbb)
Fig. 5. Isotopic identification of the evaporation residues. a) Spectrum of theα-decay of the ERs at the focal plane. The peaks are labelled by the parent nucleus. b) Selected region of the Doppler-correctedγ-ray spectrum in prompt coincidence with ERs. The main ERs are labelled. The characteristic X-rays can be seen in the inset.
ing to the protons produced in the beam dump and the scattered gas atoms. The fold-back in these structures at 9 and 32 MeV is consistent with the range of, respectively, protons and He
particles in 500µm of Si. The left (right) branch
of each structure corresponds to those parti-cles which punch through (stop in) the Si de-tectors. The He atoms were found to be ab-sent in the spectrum for a run collected dur-ing the measurement with VAMOS under vac-uum. Protons were detected even in the ab-sence of a target, and the correlation between their measured energy and time-of-flight was found to be consistent with the distance be-tween the beam dump and the detectors. To reduce the background caused by these light particles in the Si detectors, the Plastic scin-tillator was used as a veto.
10-2 10-1 1
yield (%)
a)
Bρ0=1.4 T-m p=0.3 mbar 10-2 10-1 1yield (%)
b)
Bρ0=1.5 T-m p=0.1 mbar 1 1.2 1.4 1.6 1.8 2 10-2 10-1 1yield (%)
(T-m)
ρ
B
c)
Bρ0=1.65 T-m p=0.8 mbarFig. 6. Experimental magnetic rigidity distribution. Re-constructedBρ of direct beam (dotted lines), target-like nuclei (dashed lines) and ERs (full lines) for different ex-perimental conditions: a)Bρ0= 1.4 T-m and p = 0.3 mbar,
b)Bρ0 = 1.5 T-m and p = 0.1 mbar, c) Bρ0 = 1.65 T-m
andp = 0.8 mbar.
The spectrum of the residual energy ESi
ob-tained from the events in anti-coincidence with both the DCs and the Plastic detector is shown in Fig. 5a. The observed peaks are assigned
to the radioactiveα-decay of185
Hg (Eα = 5653
keV),183
Hg (Eα= 5904 keV) and186
Pb (Eα= 6332
keV). The large size of the individual Si detec-tors used in the present work did not permit the correlation of the ER implantation with its decay at the focal plane. The implantation rate 5
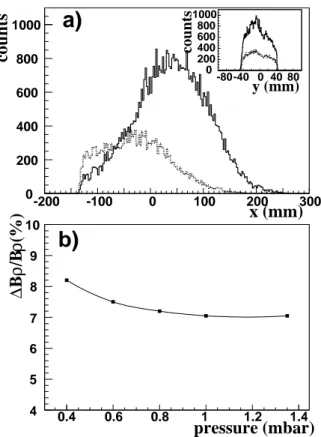
-200 -100 0 100 200 300 0 200 400 600 800 1000 -80-40 0 40 80 0 200 400 600 800 1000 counts y (mm)
counts
x (mm)
a)
0.4 0.6 0.8 1 1.2 1.4 4 5 6 7 8 9 10(%)
ρ
/B
ρ
B
∆
pressure (mbar)
b)
Fig. 7. Distribution of the evaporation residues. a) Distri-bution of the ERs in the horizontal (dispersive) direction at the focal plane forp = 0.8 mbar and two settings: Bρ0=
1.57 T-m (dashed line) and Bρ0= 1.65 T-m (full line). The
distributions in the vertical direction are shown in the inset. The two settings were normalized to the incident beam intensity. b) Width of the measuredBρ for ERs as a function of the He gas pressure forBρ0= 1.65 T-m.
in one Si detector was larger than the inverse of the half-life of the ERs. To improve this as-pect, an upgrade of the set-up is discussed in section 4.
The Doppler-corrected γ-ray spectrum in
prompt coincidence with the ERs is shown in
Fig. 5b. The most intense γ-ray transitions
observed are from 186
Hg (2p2n), 183
Hg (α3n), 185
Tl (p4n) and186
Pb (4n). Note that the183
Hg
and 186
Pb nuclei appear in both the prompt
γ - ray and the α-decay spectra. The 186
Hg
residue decays through β-radioactivity to a
stable nuclide, and its production was inferred
only from the γ-ray spectrum. The 185
Tl
nu-cleus preferentially decays by β-radioactivity
to185
Hg, the α-decay of which was measured
in the Si detectors. 0 50 100 150 200 250 300 0 600 1200 1800 counts Θlab (mrad)
a)
0.3 0.4 0.5 0.6 0.7 0.8 0.9 0 500 1500 2500 3500 counts V (cm/ns)b)
1.1 1.3 1.5 1.7 1.9 2.1 0 1000 2000 3000 4000 5000 counts Bρ (T-m)d)
3 5 7 9 11 0 500 1500 2500 3500 counts Qc)
Fig. 8. Simulation for the 183
Hg evaporation residues. The distribution in a) angle in the laboratory frame Θlab,
b) velocityV , c) charge state Q and d) magnetic rigidity Bρ are shown. The full lines represent the incident parti-cles, while the dashed lines comprise only those particles which are transmitted.
3. Performance of the gas-filled VAMOS 3.1. Beam rejection
Figure 6 shows the measured Bρ
distribu-tion for the direct beam, target-like nuclei and ERs. The various particles have been selected applying a condition on the (∆E, ESi) corre-lation. The distributions are shown for three
different values of Bρ0. The measurement
compares well with the ANAMARI calculation (Fig. 2). With increasing nominal rigidity, the yields of the direct beam and target-like nuclei
decrease due to their lowerBρ. For a value of
Bρ0 = 1.65 T-m, no un-reacted projectile was
detected at the focal plane for a beam intensity
of 1.2 × 10¹⁰
particles/s within a run of ∼ 30 min. The rejection factor for the direct beam is
therefore estimated to be better than 1010
. The current usable during the present measure-ment was limited by the counting rate in the Ge detectors due to reactions induced in fluo-rine in the target and in the carbon backing. 3.2. Transmission of the evaporation residues
The spatial distribution of the ERs at the fo-cal plane was studied as a function of both the nominal rigidity and the He gas pressure. The distribution was found to be centred on the
de-tectors and narrowest forBρ0 = 1.65 T-m and
0.85 0.9 0.95 1 1.05 1.1 -200 -100 0 100 200 θv (mrad) Bρ/Bρ0 All events a) 0.85 0.9 0.95 1 1.05 1.1 -200 -100 0 100 200 θv (mrad) Bρ/Bρ0 Transmitted events b) -200 -100 0 100 200 -200 -100 0 100 200 φv (mrad) θv(mrad) 1.0 < Bρ/Bρ0< 1.05 c) 0.85 0.9 0.95 1 1.05 1.1 -200 -100 0 100 200 φv (mrad) Bρ/Bρ0 -5 mrad <θv<5 mrad d)
Fig. 9. Acceptance of VAMOS. a) Correlation between the relative magnetic rigidityBρ/Bρ0 and the azimuthal
an-gle θv for the simulated183Hg evaporation residues. b)
Identical to a) for those ions which reach the detection system. Acceptance map of VAMOS c) in the (θv, φv) plane
for 1.0 < Bρ/Bρ0< 1.05 and d) in the (Bρ/Bρ0, φv) plane
for −5 mrad < θv< +5 mrad.
values are in agreement with model calcula-tions [26] and previous measurements [5,13].
The measured minimal width of theBρ
distri-bution of ∼ 6% is comparable to that measured at other gas-filled separators for similar reac-tions (Ref. [4] and references therein).
The transmission of a given evaporation residue is defined as the ratio of the number of residues reaching the focal plane detec-tors and the number of residues produced in the target. The transmission depends on the kinematics of the reaction and the acceptance of the spectrometer [12,17,28]. Monte-Carlo simulations were performed to understand quantitatively the measurements at the fo-cal plane, and unfold the role of the reaction kinematics and the finite acceptance of the spectrometer. The angle and energy distribu-tion of the ERs after the target was calculated based on fusion-evaporation kinematics [29] for those evaporation residues observed in the measurement. The charge state distribu-tion acquired by the ion along its transport in the gas was modelled following Ref. [5]. Fig-ure 8 shows the simulated distribution as a
function of laboratory angle Θlab, velocity V ,
charge state Q and magnetic rigidity Bρ for
the α3n channel (183
Hg). The transport of the particle through VAMOS was derived using
1.4 1.5 1.6 1.7 1.8 0 100 200 300 Bρ (T-m)
d)
1.4 1.5 1.6 1.7 1.8 0.4 0.5 0.6 0.7 EXPERIMENTa)
Bρ (T-m) V (cm/ns) 1.4 1.5 1.6 1.7 1.8 0.4 0.5 0.6 0.7 SIMULATIONb)
V (cm/ns) Bρ (T-m) 0.4 0.5 0.6 0.7 0 100 200 300 counts counts V (cm/ns)c)
Fig. 10. Comparison of the measurement with the simu-lation forBρ0 = 1.65 T-m and p = 0.6 mbar. Correlation
between the velocityV and the magnetic rigidity Bρ of the ERs as extracted a) from the experiment and b) from the calculation. The projections on theV and Bρ axis are shown in panel c) and d), respectively, for the measure-ment (full lines) and the calculation (dashed lines).
ion-optical calculations performed with the ZGOUBI code [22] in the three-dimensional
(Bρ/Bρ0, θv, φv) phase space. The subscript v
refers to the coordinate system of the spec-trometer [17]. A point-like beam was assumed. The charge exchange process along the trans-port in the gas was simulated by the use of a continuous charge state distribution (Fig. 8c). Model calculations [26] show that the domi-nant contribution to angular scattering of the ERs is due to the target. The above assump-tions are sufficient for the present purpose of determining the beam envelope along the optical elements [30]. The influence of the
acceptance on the transmission of the 183
Hg evaporation residue is illustrated in the upper panel of Fig. 9, where the relative magnetic
rigidityBρ/Bρ0 is plotted as a function of the
azimuthal angleθv. The simulated distribution
of183
Hg at the entrance of VAMOS is shown in panel a), while only the transmitted residues are displayed in panel b). The initial distri-bution is observed to be modified in a non-uniform manner as a result of the complex transport efficiency of the spectrometer in the
(Bρ/Bρ0, θv, φv) phase space. The calculated
acceptance map of VAMOS is shown in the lower panels of Fig. 9 as a function of (θv, φv)
and (Bρ/Bρ0, φv) for relevant ranges ofBρ/Bρ0
andθv. The loss of transmission observed at
Bρ/Bρ0 ≥ 1 for θv ∼ 0 in Fig. 9b is found to
arise from the limited range inφv covered by
0.2 0.4 0.6 0.8 1 1.2 1.4 1.6 20 40 60 80 100
Transmission (%)
target thickness (mg/cm
2)
Fig. 11. Transmission as a function of the target thick-ness. Calculated transmission at VAMOS for the 183
Hg evaporation residue produced in the reaction40
Ca+150
Sm at 196 MeV.
the spectrometer at large rigidities. The re-sults of the calculation for the transmitted 183
Hg residues are compared with the input distributions in Fig. 8. A detailed study of the transport efficiency at VAMOS can be found in [17]. A similar study was recently reported for the vacuum spectrometer PRISMA [31].
Figure 10 shows the comparison of the Bρ
and V distributions for the measurement
and the calculation (including all ERs). The good agreement between the simulated and the measured values shows that the present method can be used for reliably estimating
the transport efficiency. For the 40
Ca+150
Sm reaction at 196 MeV, the transmission was found to be better than 95% for nucleon (n and/or p) evaporation channels and ∼ 80% for α evaporation channels. The sensitivity of the calculation was estimated to be less than 10%. The relatively low transmission quoted for the α channels is limited by the angular spread
caused by the evaporatedα particle (Fig. 8a).
This is not applicable for xn evaporation chan-nels which are characterized by emission angles smaller than the angular aperture of VAMOS. The evolution of the transmission as
a function of the target thickness for the α3n
evaporation channel is shown in Fig. 11. The knowledge of the transport efficiency
and the number of characteristic α decays
measured at the focal plane were used to es-timate partial ER production cross sections. These were found to be in reasonable agree-ment with previous measureagree-ments [32] and
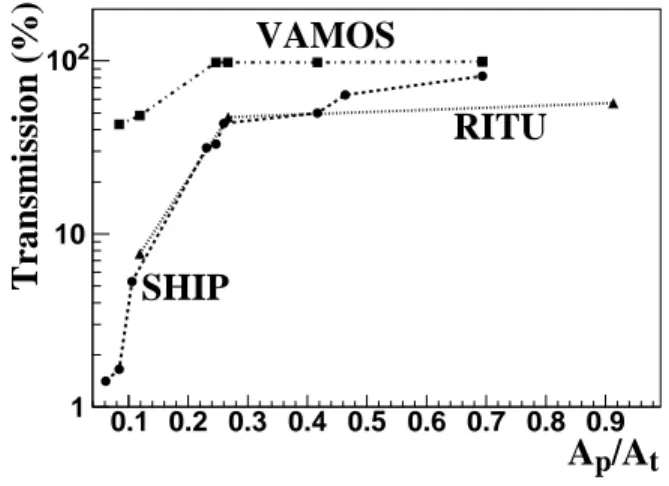
0.1 0.2 0.3 0.4 0.5 0.6 0.7 0.8 0.9 1 10 102
VAMOS
RITU
SHIP
A
p/A
tTransmission (%)
Fig. 12. Comparison of the transmission at VAMOS (squares), SHIP (circles) and RITU (triangles) as a func-tion of the ratio between the projectile and target masses (Ap/At). The transmissions quoted are for a given ER
after neutron evaporation. The values were taken from Ref. [28] and Ref. [13] for SHIP and RITU respectively. The systems considered range from12
C (60 MeV)+142
Nd to84
Kr (336 MeV)+92
Mo. The lines are to guide the eye.
statistical model calculations [25]. Under the present conditions a cross section of the order
of ∼ 30µb was measurable.
The present work is the first application of trajectory reconstruction methods for a gas-filled magnet. The reconstruction of the mag-netic rigidity permits an efficient determina-tion of the optimal settings for the measure-ment. This is especially crucial when rare pro-cesses are to be investigated [33]. Additionally, the reconstructed velocity vector of the residue at the target improves the Doppler correction
of the emitted γ-rays. This aspect will be
im-portant for an efficient use of next generation γ-arrays [34]. The large path length and Bρ limitations in VAMOS makes it unsuitable for the study of super heavy nuclei in reactions with lead or actinide targets. With the advent of the next generation radioactive beam facil-ity SPIRAL2 at GANIL, the gas-filled mode of VAMOS would be suitable for symmetric reac-tions and inverse kinematics.
3.3. Comparison with existing separators The main characteristics of routinely used gas-filled separators are summarized in Ta-ble 1. As can be seen from the taTa-ble, the ar-rangement of the optical elements at VAMOS differs from the commonly used DQQ
config-Table 1
Characteristics of existing gas-filled separators. For VAMOS the numbers refers to the current configuration. SASSYER [35] DGFRS [36] GARIS [37] BGS [38] RITU [39] TASCA [30] VAMOS [17]
Optics DQD DQQ DQQ(D) QDD QDQQ DQQ QQD
Ω (msr) 7 10 22 45 10 5-10 60
Bρmax(T-m) 2.2 3.1 1.85 2.5 2.2 3 1.8
Length (m) 4 4.3 4.8 4.7 4.7 4 7.6
Bending angle (deg) 23 23 45 70 25 23 45
Dispersion (cm/%) 0.67 0.63 0.78 2 1 0.6 1.6
uration. The DQQ configuration permits the minimization of the background at the focal plane. This is done by the removal of the pri-mary beam directly after the target, such that only the transmitted ions are further focused on the detectors. An additional dipole is some-times used for an improved rejection. As com-pared to other separators, the gas-filled VA-MOS has a large angular acceptance. Together with the high transport efficiency and detector size, it leads to the unprecedented transmis-sion values discussed in section 3.2.
The absence of focusing behind the dipole at VAMOS is less critical due to the large size of the detectors at the focal plane [17]. For the current configuration, the maximum magnetic
rigidityBρmaxis lower than that available
else-where. The use of an alternative configuration
permits increasingBρmax up to 2.2 T-m while
keeping a reasonably good angular acceptance (Ω ∼ 45 msr). The large dispersion and large area of the focal plane detectors leads to a se-lective and efficient measurement of the evap-oration residues.
Figure 12 shows a comparison of the transmission at VAMOS, at the velocity fil-ter SHIP [28] and at the gas-filled separator RITU [13]. The transmission of representative neutron evaporation channels produced in various reactions is displayed as a function
of the reaction asymmetry Ap/At. The values
predicted at VAMOS are much larger than those obtained at existing devices.
4. Future developments
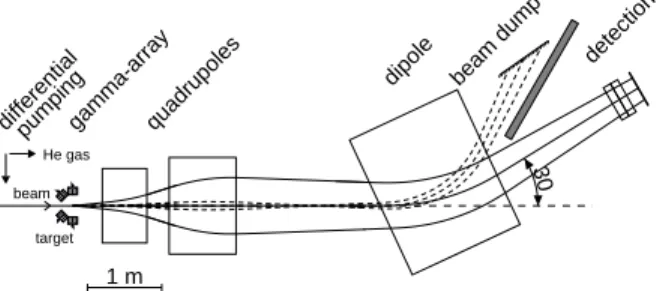
The gas-filled mode of VAMOS was imple-mented without any major modification of the existing setup. Hence, modifications of the setup are necessary for further
optimiz-ing the capabilities of VAMOS in this mode. Due to mechanical constraints related to the H-core shaped geometry of the dipole mag-net, the beam dump was located inside the dipole chamber (Fig. 1). Changing the posi-tion of the beam dump beyond the dipole, with additional shielding (Fig. 13), is expected to prevent particles scattered from the beam dump to reach the detectors. As mentioned earlier, a carbon foil was used in the present measurement to isolate the vacuum of the beam line from the gas-filled region. The use of a differential pumping improves the prop-erties of the beam at the target position. Both these changes would allow the use of higher beam intensities. A rotating target is already available to accept these high beam intensi-ties. The isotopic identification of the ER can be made correlating in position and time the ER and its decay [40]. The use of the large size and highly-segmented Si wall MUSETT (4 DSSSD elements of 10 cm × 10 cm area with 128 × 128 elements each) is envisaged for this purpose [41].
5. Conclusions
A new gas-filled operation mode was imple-mented at the VAMOS spectrometer at GANIL. It is shown to be a highly selective and
ef-ficient 0◦ spectrometer for the evaporation
residues produced in fusion reactions. For
the 40
Ca+150
Sm system at 196 MeV, a
rejec-tion factor better than 1010
was achieved for the direct beam. The transmission efficiency of the evaporation residues was estimated between 80% and 95%, depending on the evap-oration channel. The planned modifications are expected to further improve the sensitivity of the setup. To fully exploit the potential of 9
30 differentialpumping He gas beam gamma-array target quadrupoles
dipole beam dump
detection
1 m
Fig. 13. Schematic layout of the planned upgrade of the gas-filled VAMOS.
next-generation facilities based on intense ra-dioactive heavy-ion beams such as SPIRAL2, a very high rejection of the beam is required for fusion reactions in symmetric and inverse kinematics. The new gas-filled mode extends the capabilities of the large-acceptance
VA-MOS when operated at 0◦, opening new
av-enues for the study of nuclear structure and reaction dynamics at the limits. The success-ful operation of the gas filled mode adds to the versatility of the already existing vacuum mode of VAMOS.
6. Acknowledgments
We would like to thank J. Ropert for his technical contribution to the experimental set-up as well as the GANIL accelerator staff for smooth operation and high beam quality. We are also thankful to the GSI target laboratory
and G. Fremont for making the150
Sm targets. S. Pullanhiotan is acknowledged for his crit-ical reading of the manuscript. M. Mazzocco and J. Saren are thanked for providing the transmission data of SHIP and RITU, respec-tively, and for fruitful discussion. We would like to thank A. Spitaels for help during data taking.
References
[1] R. Anne et al., Nucl. Instr. and Meth.B 70 (1992) 276. [2] G. Munzenberg et al., Nucl. Instr. and Meth. 186
(1981) 423.
[3] C.N. Davids, Nucl. Instr. and Meth.B 204 (2003) 124. [4] M. Leino, Nucl. Instr. and Meth.B 204 (2003) 129. [5] A. Ghiorso et al., Nucl. Instr. and Meth.A 269 (1988)
192.
[6] B. Cohen and C. Fulmer, Nucl. Phys. 6 (1968) 547. [7] M. Paul et al., Nucl. Instr. and Meth.A 277 (1988)
418.
[8] J.F.C. Cocks et al., Eur. Phys. J.A 3 (1998) 17. [9] K. Sistemich et al., Nucl. Instr. and Meth. 130 (1975)
491.
[10] T.M. Cormier et al., Nucl. Instr. and Meth. 212 (1983) 185.
[11] V. Ninov et al., Nucl. Instr. and Meth.A 357 (1995) 486.
[12] S. Nath et al., Nucl. Instr. and Meth.A 576 (2007) 403.
[13] J. Saren et al., Contribution to the TASCA09 workshop, Darmstadt, Germany.
[14] A.M. Stefanini et al., Nucl. Phys.A 701 (2002) 217. [15] A. Cunsolo et al., Nucl. Instr. and Meth.A 484 (2002)
56.
[16] H. Savajols for the VAMOS collaboration, Nucl. Instr. and Meth.B 204 (2003) 146.
[17] S. Pullanhiotan et al., Nucl. Instr. and Meth.A 593 (2008) 343.
[18] S. Bhattacharyya et al., Phys. Rev. Lett. 101 (2008) 032501.
[19] A. Shrivastava et al., Phys. Rev. C 80 (2009) 051305(R).
[20] A. Obertelli et al., Phys. Lett.B 633 (2006) 33. [21] J. Simpson et al., Heavy Ion Phys. 11 (2000) 159. [22] F. M´eot et al., Nucl. Instr. and Meth.A 427 (1999)
353.
[23] J.F. Ziegler, SRIM - The Stopping Range of Ions in Matter, http://www.srim.org/index.htm.
[24] J.B. Moulton et al., Nucl. Instr. and Meth. 157 (1978) 325.
[25] A. Gavron et al., Phys. Rev.C 20 (1980) 230. [26] K. Subotic et al., Nucl. Instr. and Meth.A 481 (2002)
71.
[27] Ch. Theisen et al., unpublished.
[28] M. Mazzocco et al., Nucl. Instr. and Meth. B 266 (2008) 3467.
[29] M. Dahlinger et al., Nucl. Instr. and Meth. 219 (1984) 513.
[30] A. Semchenkov, Nucl. Instr. and Meth.B 266 (2008) 4153.
[31] D. Montanari et al., submitted to Nucl. Instr. and Meth.A.
[32] J. Pakarinen et al., Phys. Rev.C 72 (2005) 011304(R). [33] K.E. Gregorich et al., Phys. Rev.C 72 (2005) 014605. [34] D. Bazzacco et al., Nucl. Phys.A 746 (2004) 248c. [35] J.J. Ressler et al., Nucl. Instr. and Meth.B 204 (2003)
141.
[36] Yu.A. Lazarev et al., Proceedings of the International School-Seminar on Heavy Ion Physics, Dubna, Russia, 1993, Vol. 2, p. 497.
[37] K. Morita et al., Nucl. Instr. and Meth.B 70 (1992) 220.
[38] V. Ninov et al., Proceedings of the ENAM98, Bellaire, Michigan, 1998, AIP Conf. Proc. 455 (1998) 704. [39] M. Leino, Nucl. Instr. and Meth.B 99 (1995) 653. [40] R.S. Simon et al., Z. fur Phys.A 325 (1986) 197. [41] Ch. Theisen et al., to be published.