EFFECT OF DOSE AND DOSE RATE ON BENZO[a]PYRENE
INDUCED MUTATIONAL SPECTRA
IN HUMAN CELLS
byJIA CHEN
B.S., Beijing (Peking) University, 1986 M.A., College of William and Mary, 1989
Submitted in Partial Fulfillment of the Requirements for the Degree of
DOCTOR OF SCIENCE in
CIVIL & ENVIRONMENTAL ENGINEERING AND TOXICOLOGY
at the
MASSACHUSETTS INSTITUTE OF TECHNOLOGY May 1994
© Massachusetts Institute of Technology, 1994 All right reserved
Signature of A h
-uLI I J %r
Department of Civil and Environmental Engineering May 13, 1994 Certified by , -William G. Thilly Thesis Advisor Accepted by ( . Joseph M. Sussman Chairman, Departmental Committee on Graduate Student
OF TFC#PftY
.E
This doctoral thesis has been examined by a committee of the Department of Civil and Environmental Engineering as follows:
/~
Professor William Thilly.
Professor Harold Hemond
i, IO 1
Professor Howard Liber
Harvard School of Public Health
EFFECT OF DOSE AND DOSE RATE ON BENZO[a]PYRENE INDUCED MUTATIONAL SPECTRA
IN HUMAN CELLS by
Jia Chen
Submitted to the Department of Civil and Environmental Engineering in Partial Fulfillment of
the Requirement of the Degree of
Doctor of Science in Civil & Environmental Engineering and Toxicology
It is possible to find the causes of genetic change from human exposure to environmental agents by comparing the mutational spectrum of an individual (or a population) to that of the suspected mutagen. However, humans are chronically exposed to low levels of environmental mutagens, yet all of the mutational data available nowadays have been obtained using high-dose, short-term protocols. Since the possibility exists that different mutational mechanisms might operate under different conditions, it is important to evaluate whether the high-dose, short-term treatment protocols accurately mimic chronic exposures.
Herein the effect of dose and dose rate on Benzo[a]pyrene induced mutations in human cells has been studied. A human lymphoblast cell line (AHH-1) which constitutively expresses cytochrome P450IA1 in amounts similar to those found in human lung epithelia was used. To assure the statistical quality of the mutational spectra, a 4 liter human cell culture system which allows exposure to large number of cells (> 4 x
109) was designed. The combination of large-scale human cell cultures and hi-fi
PCR/DGGE enable us to study BP-induced human mutational spectra at a concentrations within the range of human exposure. Low-melting domain of hprt exon 3 induced spectra have been studied in duplicate cultures at each of the following conditions: 0.02 gM x 20 days, 0.5 gM x 6 days, 0.5 gM x 20 days, and 30 gM x 28 hours. The results demonstrate that the BP mutational spectra is markedly dose and dose rate dependent. This study suggests that different mutagenic pathway may be operative depending on dose rate. It is thus clear that the mutational spectra should not be used to define expectations for mutational spectra in human tissue. Rather the more difficult experiments of low-dose, long-term mutation studies are justified in terms of seeking better approximation to human mutational pathway.
Thesis Advisor: William G. Thilly
ACKNOWLEDGEMENTS
I would like to express my appreciation to my thesis advisor, Prof. Bill Thilly, whom I bumped into six years ago in the hallway of Bldg. 16. I was struck by Bill's confidence, enthusiasm, broad interest, and his ability to manipulate numbers (i.e. from 2x to 10Y). As a student in Oceanography at that time, I was eager to start a new career because of my propensity to sea sickness. Pursuing my degree under his guidance, I had an unique opportunity to experience life as both a toxicologist and an environmental engineer.
I would like to acknowledge the other members of my thesis committee, Professors. Harold Hemond and Howard Liber, for their insights, recommendations and guidance.
I would like to thank Gengxi Hu for enduring my endless barrage of questions; John Hanekamp and Lucy Ling for introducing me to the lab techniques; Konstantin Khrapko and Paulo Andre for their constructive suggestions about my research; Riitta Mustonen, Lata Shirname-More and Joyce Morrill, for their encouragement and friendship; and John Durant for his generosity and friendship. I am deeply indebted to other members of the "fabulous five" (Katz, MIT Thesis, 1993), Hilary, Tracy, Dave and Peter. Their friendship, moral support and humor made the notoriously harsh life at MIT bearable.
I would like to thank all my colleagues at the 6th floor of E18 for their continued support over the years. Special thanks to Rita DeMeo, Cindy Slick-Flannery, Jackie Goodluck-Griffith, Paula Lee, Xiaocheng Li, Aoy Tomita, Rita Cha, Shihong Wang, Emba Selvaraj and Al Atkinson. I am blessed to have such friends.
My family has been a constant source of inspiration, encouragement, and support over the years. None of my achievements would have been possible without them. Finally, I would like to express my deep appreciation to Xiaohong, whose love, patience and understanding helped me endure. His genius in math made all the numbers and equations personable to me.
TABLE OF CONTENTS
Title page 1 Acknowledgments 4 Table of contents 5 List of figures 7 List of tables 9 List of abbreviations 10 I. Introduction 12 II. Background 14 2.1. Mutational spectrometry 14 2.2. Definition of terminology 202.3. Experimental approaches to study low-dose mutations 21
2.4. BP as a model mutagen 24
2.4.1. Transport of BP 27
2.4.2. Metabolic activation of BP 27
2.4.3. DNA binding of BP and PAH 31
2.4.4. Repair of BP induced DNA adducts 36
2.4.5. BP induced mutations in human cells 36
2.4.6. Dose-dependence of BP mutagenesis in human cells 39
III. Experimental Design 44
3.1. A statistical model to estimate variance in long-term,
low-dose mutation assay 44
3.2. Design an experiment to study low dose rate mutations 46
3.3. Large-scale human cell cultures 51
IV. Methodology 58
4.2. Cell maintenance 63
4.3. Benzo[a]pyrene treatment 64
4.4. Determination of survival and mutant fraction 65
4.5. Reducing background mutant fraction 69
4.6. Molecular analysis of point mutations on low-melting domain of hprt exon 3 70
V. Results and discussion 77
5.1. Selection of dose and dose rate 77
5.2. Toxicity and mutagenicity of BP in large cultures 83
5.3. Statistical analysis of variance in large-scale human cell cultures 90
5.4. Dose dependence of BP mutational spectra 98
5.4.1. Definition of mutational hotspot 98
5.4.2. Low-melting domain of hprt exon 3 as the target sequence 100
5.3.3. BP mutational spectra under various dose and dose rate 101
5.4.4. Characteristics of BP mutational spectra 107
5.5. Significance toward human study 115
5.5.1. A model to estimate BP exposure in human lungs 117
5.5.2. Estimation of BP concentrations in human lungs 119
5.6. How do mutants disappear? 121
5.6.1. General considerations on BP mutagenesis 121
5.6.2. Hypotheses for disappearing mutants 122
A. Selective pressure or neutrality of 6TGr phenotype 124
B. Gene amplification 125
C. Original Heterogeneity 133
D. BP Induced Heterogeneity 144
VI. Summary and conclusions 151
VII. Suggestions for future research 154
LIST OF FIGURES
Figure
Number Title
2.1 Determination of mutational spectra from a treated bulk
culture using PCR/DGGE 16
2.2 Comparison of mutational spectrum obtained by PCR/DGGE method 18
2.3 Shapes of dose-response curves for chemically induced mutations 22
2.4 Proposed pathway to BP mutagenesis in human cells 25
2.5 Metabolic fate of BP 29
2.6 Stereochemistry of BP activation 33
2.7 BPDE spectra in human cells 37
2.8 Summary of long-term, low-dose BP mutagenesis in AHH-1 cells 40
2.9 Comparison of long-term, low-dose with short-term, high-dose
BP-induced mutation in AHH-1 cells 42
3.1 Effect of number of cells treated on dispersion of mutation rate 49
3.2 Schematic design of large scale human cell cultures 52
3.3 Protocol for long-term, large-scale human mutation assay 56
4.1 Concentration dependence of BP induction of AHH activity 59
4.2 Time course of AHH activity induction 61
4.3 Determining survival by growth curve extrapolation 66
4.4 Protocol for molecular analysis of 6TGr mutant population
71 4.5 Layout and sequences of primers used for the analysis of 6TGr
mutations in the low-melting region of hprt exon 3 73
5.1 Dose and dose rate dependence of BP mutagenesis in small
stationary AHH-1 cultures 79
5.2 Selection of doses and duration for large-scale human cell
cultures 81
5.3 Mode of exposure with selected dose rates 84
5.4 Growth curves of spontaneous, 0.02 pM and 0.5 g±M BP treated
Figure
Number Title Pagc
5.5 Growth curves for 30 pLM BP treated cultures 88
5.6 Summary of BP induced mutant fraction in large-scale AHH-1 ceel 91
5.7 A proposed model of the hprt catalytic domains 102
5.8 DGGE analysis of BP induced mutations in the low-melting
domain of hprt exon 3 under various dose and dose rate 104
5.9 Display of BP mutational hotspot under various dose and dose rate 110
5.10 Test for neutrality of 6TGr phenotype 126
5.11 Illustration of "onionskin" model for gene amplification 130
5.12 Test for gene amplification 134
5.13 Hypothesis of original cell heterogeneity 138
5.14 Short-term toxicity and mutagenicity of BP to AHH-1 cells 140
5.15 Short-term toxicity of BP in "disturbed" and "disturbed"
AHH- 1 cells 142
5.16 Hypothesis for BP induced heterogeneity 145
LIST OF TABLES Table
Number
Title
Pag
2.1 DNA adducts of BP and PAH from various sources 35
3.1 Experimental conditions for large-scale design 48
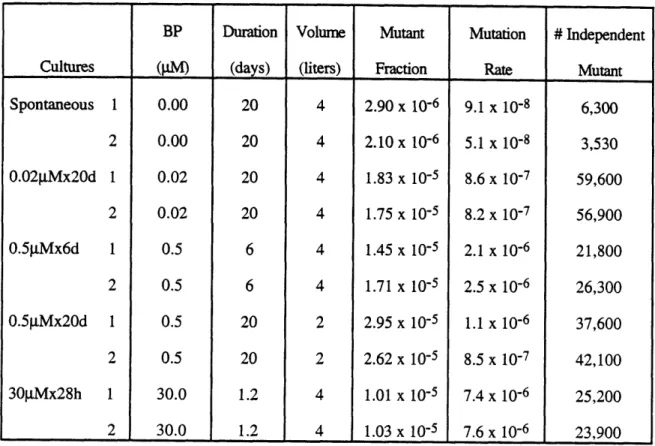
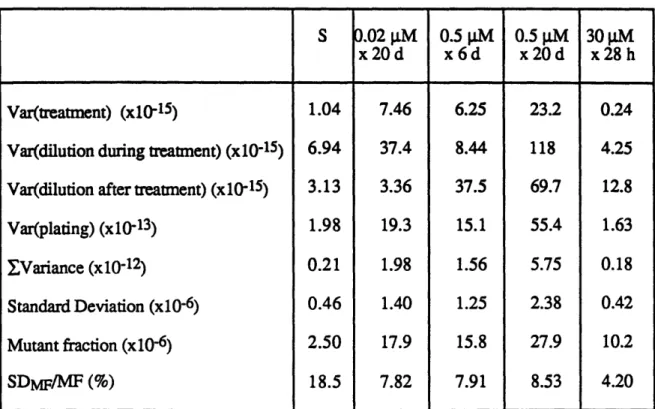
5.1 Summary of the large-scale cell culture experiment 93
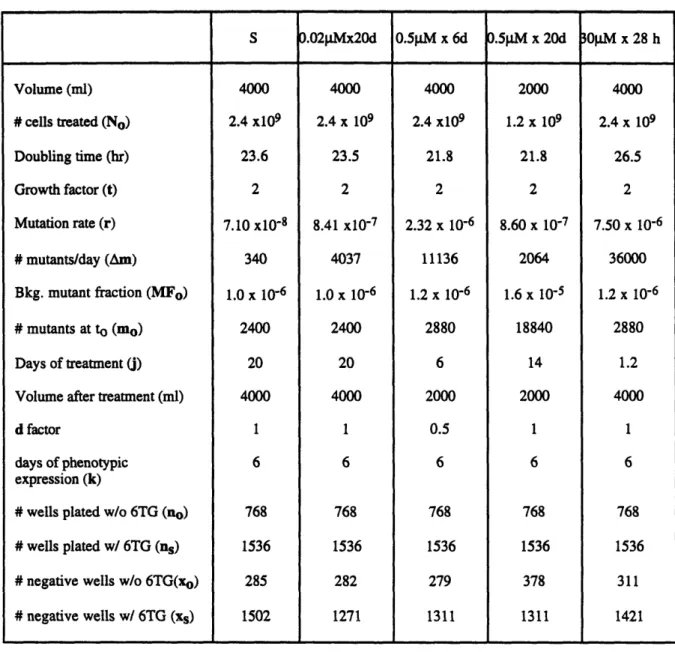
5.2 Experimental conditions used in large-scale cell cultures 95
5.3 Variance of mutant fraction in large-scale human cell cultures 96
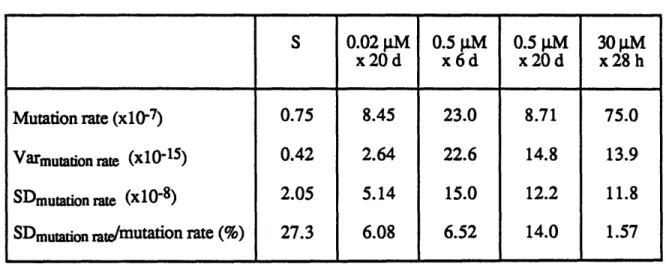
5.4 Variance of mutation rate in large-scale human cell cultures 97
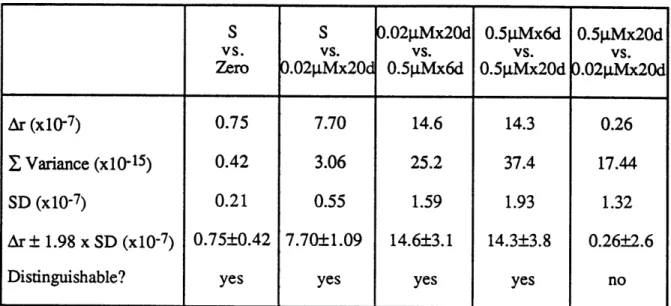
5.5 Comparison of mutant rate under various doses 99
5.6 Summary of BP hotspots in the low-melting domain
of hprt exon 3 107
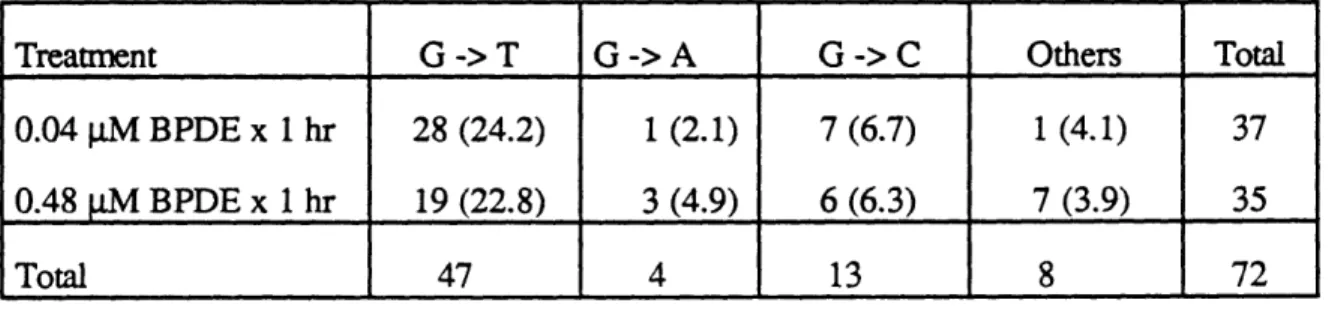
5.7 Contingency table analysis of clone by clone BPDE induced
mutations under different doses 116
5.8 Human non-occupational and occupational exposure to BP 120
5.9 Analysis for selective pressure on 6TGr phenotype 128
LIST OF ABBREVIATIONS
AHH aryl hydrocarbon hydrolase
BP benzo[a]pyrene
bp base pair or base position
d day(s)
DGGE denaturing gradient gel electrophoresis
DMSO dimethyl sulfoxide
EMS ethylmethanesulfonate
H helical structures
HAT 2x10⁻⁴ M hypoxanthine + 8x 10⁻⁷M aminopterin + 3.5x10⁻⁵ M thymine
hi-fi high-fidelity
hprt hypoxanthine-guanine phosphoribosyl transferase
J treatment time point
Jay average of the treatment time points
j
days of treatmentk days of phenotypic expression
mo the number of mutant at time zero
Am the number of mutant generated each day
MF mutant fraction
MFo mutant fraction at time zero
MFO mixed function oxidase
MNNG methylnitronitrosoguanidine
MNU methylnitrosurea
NO the number of cells at time zero
Nt the number of cells there would be at a particular time
ni the number of observation at each time point PAGE polyacrylamide gel electrophoresis
PAH polyaromatic hydrocarbon PCR polymerase chain reaction PE plating efficiency r mutation rate S spontaneous culture(s) ss single strand SD standard deviation t growth factor 6TG 6-thioguanine 6TGr 6-thioguanine resistant TH 3.5 x 10⁻⁵ M thymine + 2 x 10⁻⁴ M hypoxanthine Var variance WT wild type P3 beta strand ' doubling time
I. INTRODUCTION
The central premise of genetic toxicology applied to humans is that:
environmental mutagens to which human are exposed cause a significant portion of their genetic changes. One line of scientific argument hypothesized that it will be
possible to estimate the genetic risks inherent in human exposure to environmental agents
by comparing the mutational spectrum of an individual (or a population) to that of the
suspected mutagen. Efforts have been made to assess the genetic risk of particular mutagens by using single-cell and whole-animal bioassays, both of which use dose levels much higher than human would likely encounter. Attempts to extend these investigations to low-dose ranges common to human experience are limited by the time, cost and
statistical precision. Quantitative assessment of genetic risk has primarily relied on mathematical extrapolation of risk from high dose animal or cell culture study to the anticipated human scenario which in general is chronic exposure to low levels of environmental mutagens. However, the possibility exists that different mutational mechanisms might operate under different conditions, it is important to evaluate whether the high-dose, short-term treatment protocols widely used in risk assessment accurately mimic chronic exposures in humans.
Our lab endeavored to mimic human exposure phenomena and genetic changes by developing a human lymphoblast mutation assay. To develop a system for the study of the induction of gene mutations which closely approximates human, a gene-locus
mutation assay using diploid human lymphoblast lines was designed in our lab (Thilly et
al., 1980). Crespi and Thilly (1982) improved the system by isolating a human
lympoblast line, AHH-1, competent for xenobiotic metabolism. Danheiser et al. (1989) performed the first study to assess the mutagenic effects of long-term, low-level exposure to a chemical (benzo[a]pyrene) requiring activation to its mutagenic counterparts in
human cells. They demonstrated the lowest detectable concentration of benzo[a]pyrene (0.02 gM), common to human experience, for statistically significant mutations in human cells. In addition, nonlinearity of the dose-dependence of mutagenicity was observed at high dose ranges.
In this study, I extend the work of Danheiser in mimicking human exposure scenario in cell cultures and studying the mutational spectra resulted from such exposure. This is the first time anyone has studied the long-term, low-dose mutational spectra in human cells or any living organism as well as the dose effects. It is a crucial study before mutational spectra is used to diagnose whether human suffers any genetic damage related to exposure of suspected mutagens.
The dose-dependence of DNA base sequence changes in the coding region of the
hprt gene in human lymphoblast cells (AHH-1) has been examined using benzo[a]pyrene
(BP) as a model mutagen. To achieve that, an experimental system was designed in such a way that the distribution of BP-induced mutations in a human cell population could be accurately analyzed when cells were treated with BP at a concentration common to human experience (0.02 jM).
This study demonstrates BP induces mutations by molecular pathways that are dose-dependent. It suggests that short-term, high- or toxic-dose protocols commonly used in regulatory decision making can not predict health risk of human experiencing chronic exposure to low levels of environmental mutagens.
I. BACKGROUND
2.1. MUTATIONAL SPECTROMETRY
When a homogenous cell population is exposed to a mutagen under certain exposure conditions, there exists a specific reproducible pattern of genetic changes: the mutational spectrum. This fact was discovered by Benzer and Freese (1958) who
showed that the position and frequency of mutations in a genome of the T4 bacterial virus was reproducible among independent experiments and unique for untreated and chemically treated virus populations. Since their observation over 30 years ago, the study of
mutational spectrometry has extended to bacteria, fungi, rodent, and human cells. Mutational spectrometry has become a powerful tool for exploration of the molecular biology of mutagenesis, of structure and function relationships of proteins and nucleic acids, and perhaps most importantly, of the quantitative relationships between exposure to environmental mutagens and genetic disease (reviewed by Southam and Thilly, 1994).
Two general approaches have been widely used in the field mutational
spectrometry: use of endogenous genes such as hprt or shuttle vectors carrying E. coli
supF tRNA gene or the E. coli lacI gene. Shuttle vector system involves the mutagen
treatment of naked plasmid DNA containing a reporter gene. The plasmid must contain a selectable sequence. After treatment in vivo with a mutagen, the plasmid is transfected into a mammalian cell where it is acted upon by repair enzyme and replicated. The plasmid is isolated from the mammalian cells and transfected into bacteria for selection of mutant phenotype. The major advantage of shuttle vector system is allowing the host cell machinery to work on mutagen treated DNA, so the repair mechanism of the host cell can be studied. But it is often the case that much higher proportion of damage is achieved when plasmids are treated outside of the cell compared to a living cell. As a result, one
plasmid often contains several mutations. Endogenous genes, however, are treated and selected in situ, and thus more relevant to mutagenic process in vivo.
In addition, two modes of phenotypic selection have been applied: clone by clone and en masse selection. In the former case, the descendants of each mutation are isolated as a separate colony and their sequences are analyzed on a clone by clone basis. Such practice is always tedious and seldom generates sample size large enough to analyze mutational spectrum with statistical significance. In the latter, one uses cell cultures in which descendants of induced mutations are selected and analyzed en masse. By increasing culture size, one may obtain enough to mutants to study their mutational spectra.
Since 1980's, our lab has innovated the means for elucidating mutational spectra (Thilly, 1985; Cariello and Thilly, 1986). The development of denaturing gradient gel electrophoresis (DGGE) (Fischer and Lerman, 1983), which discriminate DNA with single base difference, was coupled with the polymerase chain reaction (PCR) (Mullis and
Faloona, 1987), which allows rapid reproduction of specific target DNA sequences. Such technique was further improved by optimizing the fidelity of the polymerase (Keohavong
et al., 1990; Ling et al., 1991) so that induced mutations should not be obscured in
polymerase induced "noise".
PCR/DGGE technique (Fig. 2.1) is a powerful tool for determining the spectra from selected population of cells (Thilly, 1985; Cariello and Thilly, 1986; Cariello et al., 1988; Keohavong and Thilly, 1992). By treating a bulk human cell culture en masse with a suspected mutagen, one can induce at least 10,000 independent survival independent mutants, which insures the statistical quality of the mutational spectrum. Of course, only mutations exceeding the sensitivity of the assay, now about 0.2% of total mutants, are detected.
Fig. 2.2 represents mutational spectra data from some of the studies using
Fig. 2.1
Determination of mutational spectra from a treated bulk culture using PCR/DGGE
DGGEIPCR Method
Tratw/mutarmpt
to give looo0000 urvivtn
mutants
Surviving mutants and wild type caB
Generatiomn for phantypic cprmion and selection Isolate DNA w/al HPRT mutants Boil and rearneal with ecs wild typ load on DGG
atant heteroduplexes
type homoduplex
Recover from gel
and sequence
stational spectrum bp posw culture Sequare seuec - Wildr--ý
~C7...
-ap
Fig. 2.2
Comparison of mutational spectrum obtained by PCR/DGGE method
The kinds, positions and frequencies of 6TGr mutations in hprt exon 3, represented by
base positions 135-318. The frequencies of mutations relative to total 6TG mutations are represented by the vertical bar. The kinds of the predominant hotspots were indicated on the top of each spectrum, and those for other hotspots were indicated on the top of the vertical bars.
Mutational Spectra in axon 3 of hprt using
DGGEIPCR method
Spe-fma-e SpWrma COUr.15
i2-km ir mi0lwm
IPDE Spectrun tunve. t•, i
c-T
SI'
I4 I" 130 200 220 2 2W0 200 300 MN psaosm omit"en JMNNcpja ,, r."se14 W10 ISO 200 220 240 20 20 300 lms petr pglltt 4Specurman 2 (r.tro c0 t20 220 240 230 230 300 NW rv rclm I U' .40ii
I I -IT 0 10 230 I20 240 200 200 300 Im eN asr elten 10 ISO 20 220 240 20 20 300 bIC-91 e• posittn•ICA-191 Specutrut Mwulew. 1990)
I 30o. 2 0· II,. ri 4o 0 3W In 200 220 240 20 230 300 km sew OpWIl.a a I" In 000 21o o 20 3"00 Dows igear psittll
X-ray $prman Ikt,
demonstration that mutational spectrum is indeed unique to each mutagen. This implies that one can use mutational spectrum can be used as a "fingerprint" of each mutagen to
study causative effect, if any, of a mutagen on human genetic integrity.
2.2. DEFINING DOSE AND DOSE RATE
The "dose" implies the amount of mutagen administered or being exposed to over a period of time (i.e. the whole life span or length of the experiment). The "dose rate" is the temporal pattern of the total dose, so the dose can be calculated by integration of dose rate over time.
The human situation is exposure to mutagens occurs at very low levels over long period of time. A principal question facing environmental scientists concerns how to measure mutations induced by low level of mutagens. As analyzed in Liber et al. (1985), cellular exposure to mutagens occurs via four modes:
(I) High dose rate x short time, yielding a high dose; typical in cell and animal assays;
(II) High dose rate x long time, yielding a very high dose; usually marked by extreme toxicity;
(III) Low dose rate x short time, yielding a low dose; (IV) Low dose rate x long time, yielding a high dose.
As one can see, Modes I and II only reflect extreme circumstances outside of human experience, so such protocols may be unrealistic in terms of mimicking human exposure. In order to devise experiments which useful in predicting human health effects which result from living and working in the presence of low levels of environmental pollutants, then our interests must focus on low dose rates, in which exposure occurs intermittently or continuously (Mode IV).
2.3. EXPERIMENTAL APPROACHES TO STUDYING LOW-DOSE
MUTATIONS
Long-term, low-dose exposure to chemicals, a situation more likely to be
encountered by man, can be mimicked in vitro. Low dose rate x short time protocol can
be repeated many times with a defined time interval separating the exposure. The
background mutant fraction (which is always non-zero), and the population size
determine the sensitivity of the mutation assay. As stock cultures age, mutants arising
spontaneously accumulate and the background mutant fraction rises. As a result, the
sensitivity of the mutation assay decreases. To study low-dose mutations we require that
the treated and concurrent control mutation rates demonstrate a statistically significant
difference. One thus needs to treat large number of cells with a mutagen for a long period
of time. Such an approach is experimentally difficult and costly.
The common strategy used to overcome such limitations is to use doses that are
much higher than those encountered in the environment. The results are then
extrapolated to the dose levels of interest, usually using dose-response relationships with
little biological evidence. Thus the establishment of a reasonable dose-response
relationship becomes crucial in the process.
Four most common dose-response relationships are illustrated in Fig. 2.3. Type (I)
is a linear function of the mutagen concentration as seen with methylnitronitrosoguanidine
(MNNG) in human cells (Penman and Thilly, 1976) and hamster cells (Schwartz and
Samson, 1983). It may be the case of direct-acting mutagen without enzymatic induction
of DNA repair. Linearity is a common phenomenon among many other mutagens at low
dose levels (i.e. Nakamura and Okada, 1983), but departure from linearity is frequently
observed at high dose rates. Penman (1980) showed that the dose response of
ethylmethanesulfonate (EMS) was linear at low doses and switched to another linear
relatioship with an higher slope (concave upward); and
4-nitroquinoline-N-Fig. 2.3
Shapes of dose-response curves for chemically induced mutations
Graphs illustrate four basic curve shapes observed in cell culture using mutant fraction as genetic endpoint.
I: Linear;
II: Plateau; III: Concave-up;
DOSE
w
z
2
rccw
z
I \Ioxide (4NQO) switched from a linear relationship at low doses to a nonlinear relationship at high doses (plateau). Nakamura and Okada (1981) studied mutational dose-rate effects of gamma rays in mouse lymphoma cells. Their data indicated a quadratic curve at the high dose rate, but a linear curve with a lower slope at the low dose rate. Nevertheless, similar treatment yielded a linear quadratic equation in both low and high dose rate in Chinese hamster cells (Thacker and Stretch, 1983). Type (II) is a plateau with increasing mutagen concentration. Such a relationship may be explained by saturation in transport and/or metabolism of the mutagen, and/or the induction of repair enzymes. ICR-191 (DeLuca et al., 1977) and aflatoxin B1 (Kaden et al., 1987) demonstrated type (II)
response. Type (III) is concave up as mutagen concentration rises as seen in MNU or methylnitrosourethane (Thilly et al., 1976; Penman et al., 1979). This response may be the result of saturation of DNA repair. Type (IV) is a combination of type (II) and (m). ENU-induced mutations in mouse spermatogonia falls into this category (Russell et al.,
1982). The mutant fraction shows a significant departure from linearity at both high and
low dose. This type of response may be the result of induced DNA repair at low dose and saturation of mutagen transport and metabolism at high dose.
2.4. BP AS A MODEL MUTAGEN
Benzo[a]pyrene, a member of the polyaromatic (or polycyclic) hydrocarbon (PAH) family, is an ubiquitous environmental pollutant. It is released into the
atmosphere, along with other PAH, during the combustion of fossil fuels and vegetation, and is present in tobacco smoke and food. The exposure to BP is virtually unavoidable (Baum, 1978; Weinstein, 1988).
Mutagenesis of BP is a cascade process which may be modeled as a series of steps (Fig. 2.4), and each process can be dose-dependent. BP is transported into cells and metabolized into electrophilic forms that are reactive with nucleophilic sites on DNA,
Fig. 2.4
BP
Transport
Metabolism/Activation
DNA Binding
Potentially mutagenic Lesion
Correct Repair
Replication
Wild
Type
Misrepair
No Repair
Misrep
Nonreplication
lication
4
N
. Mismatch Repairr
Wild Type
Cell Death
\ýk
I
Mmmaaomforming DNA adducts (Miller and Miller, 1981; Singer and Grunberger, 1983; Lawley, 1989). DNA binding of carcinogen and the damage caused by this are thought to constitute the initial step in the complex multistage phenomenon of chemical carcinogenesis (Lawley, 1989). Accordingly, studies of factors, such as dose effects, that influence mutagenesis in human cells should enhance our understanding of cancer etiology.
2.4.1. Transport of BP
The first step of BP mutagenesis is the transport of BP into the cell. Modes of transport include passive diffusion and active transport (Timbrell, 1991). Most chemicals cross cell membranes by simple diffusion. Small hydrophilic compounds diffuse across lipid membranes through aqueous channels, whereas larger organic molecules diffuse across hydrophobic, lipid domain. Passive diffusion is a process driven by the
concentration gradient across the cell membrane. The rate of diffusion is proportional to the concentration gradient, and thus is a dose-dependent process.
BP was also shown to be transported across the membrane by lipoprotein (Hanson-Painton et al., 1983). It was shown that BP bound to the protein carrier was preferentially transferred to the microsomes. The carrier protein fraction transferred levels of BP many-fold in excess of its BP-binding capacity. In addition, the carrier fraction if capable of both transferring BP to the microsomes and accepting oxidized BP from microsomes. It is not hard to imagine that such active transport process can be saturated at high doses.
2.4.2. Metabolic Activation of BP
BP is metabolized to exert its mutagenic function onto DNA. The primary BP-metabolizing enzyme system is the cytochrome P450IAl-dependent enzyme called aryl hydrocarbon hydroxylase (AHH). The oxidative metabolism of BP is catalyzed by AHH
that is part of the endoplasmic reticulum and consist of a terminal cytochrome (P450) and an electron transport chain (Sipes and Gandolfi, 1986). A highly significant positive correlation between the lung microsomal AHH activity and formation of BPDE-DNA adducts was reported (Alexandrov et al., 1992). This result suggests that in human lung
BPDE-DNA adducts are mediated predominantly by P450IA1 as rate-limiting step.
The level of P4501A1 is found in all human tissues examined, including liver (Selkirk et al., 1975), placenta (Nebert et al., 1969), Bronchus (Cohen et al., 1976), Lung (Prough et al., 1979), Colon (Autrup et al., 1978), Kidney (Prough et al., 1979),
lymphocytes (Busbee et al., 1972; Kellermann et al., 1973), monocytes (Bast et al., 1974;
1976) and lung macrophages (Bast et al., 1973), bladder (Selkirk et al., 1983) and
esophagus (Harris et al., 1979), and both increases and decreases in activity have been reported. The inducibility of AHH (P450IA1) activity to exposure of PAH is controlled
by a single Ah locus, which encodes the cytosolic Ah receptor involved in the regulation
of P450 genes (Gonzales et al., 1986).
The induction of P450IA1 (AHH) activity has been associated with the
appearance of human cancer. In a study carried out in lung cancer patients (Anttila et al., 1991), P4501A1 activity was detected in all but one cancer patients, but in none of the controls. Law (1990) also reported about half of the studies found higher P450IA1 inducibility in lung cancer cases than controls.
A summary of the metabolic pathways of BP metabolism is shown in Fig. 2.5. The mechanism and stereoselectively of BP metabolism was reviewed by Gelboin (1980). Five phenols have been identified as metabolites: 1-OH; 3-OH, 6-OH, 7-OH, and 9-OH. The phenols can be converted to quinones like 1,6-, 3,6-, and 6,12-quinones. Three dihydrodiols: 4,5-, 7,8-, and 9,10-dihydrodiols are produced from corresponding arene oxides. The primary epoxides can be conjugated to glutathione S-conjugates and the
Fig. 2.5
Metabolic fate of BP
METATOLIC FATE OF BENZO[a]PYRENE 12 1 9 8 7 6 5 P4
GSH conjugates :- Arene Oxides
GSH Conjugates
A
P450 Phenols - - Ouinones 4,5- 7,8- 9,10-Epoxide Hydrolase Glucuronides & Sulphate Esters --- Dibydrodiols 4,5- 7,8- 9,10-9-OH-4,5-diol 6-OH-7,8-diol 1-(3-)OH-9,10-diol Glucuronides Sulphate Esters IP450 GSH Conjugates -~ 7,8-diol-9,10-epoxide 9,10-di01-7,8-epoxide 1- 7-3- 9- 1,6-3,6 6,12-Tetraolsphenols and diols can be conjugated to water-soluble compounds by either sulfate conjugation or glucuronide conjugation. The 7,8-diol is converted to four stereoisomers of 7,8-diol-9,10-epoxides illustrated in Fig. 2.6. The diol epoxides are highly reactive and react with macromolecules such as DNA or protein. The stereochemistry of the diol epoxides plays important roles in BP toxicity and mutagenicity. Anti-(+)-BP-7,8-diol-9,10-epoxide (BPDE) is considered the ultimate mutagen and has been shown to be mutagenic in most of the experimental system.
Metabolite profile differs among human tissues. Three major classes of metabolite were detected in human system using liver microsomes. They include dihydrodiols
(9,10-, 7,8- and 4,5-dihydrodiols), phenols and quinones. The major metabolite produced by human peripheral blood lymphocytes were phenols. Quinones, trans-7,8-dihydrodiol
BP, and one unidentified metabolites were also reported (Vaught et al., 1978). The metabolite profiles in human lymphocytes also depends on the incubation time with BP (Selkirt et al., 1975). During a 30 minute incubation no trans dihydrodiols were
observed, the major metabolites were phenols and quinones. During a 24 hour incubation, human lymphocytes produce 4,5-, 7,8-, and 9,10- trans dihydrodiols, quinones and phenols.
2.4.3. DNA Binding of BP and PAH
DNA adduct levels measured in human tissues can be compared with the known
level of exposure to allow assessment of potential individual risk (Perera, 1988; Van Zeeland, 1988). The levels of DNA adducts may reflect the dose of environmental mutagens, it is thus important biomakers which can provide information about the exposure to mutagens and the effect of genotoxic compound.
Extensive work has been done on DNA binding of total PAH in human tissues, but detection of BP-DNA adduct in human tissues had not been successful till recently. This
is because antibody designed to recognize BP-DNA adduct in immunoassay shows various level of cross-reactivity with other PAH, while 32P-postlabeling of adducts gives unknown spots of unidentified nature. In this section, DNA bindings of both BP and PAH in humans are reviewed.
The binding of BP and PAH is highly complex because of the stereochemistry of the BP and PAH metabolites (Fig. 2.6). Most of the data on BP or PAH adduct concern BPDE. The major BP adduct is formed by binding to the exocyclic N2-atom of guanine
(Baird et al., 1975; Osborne et al., 1981; Cooper et al., 1983), but other binding sites have been identified as well. The minor products of BPDE include C-8, N-1, N3, N-7 and 06
atom of guanine (Cooper, 1983).
DNA adducts in exposed individual can be quantified by radiolabeling (i.e. 32p. postlabeling), chromatographic (i.e. HPLC; GC-MS), immunological (ELISA), or physicochemical (i.e. SFS) methods. All the techniques are sufficiently sensitive and specific for the detection of environmental and occupational exposure (Bartsch et al.,
1988).
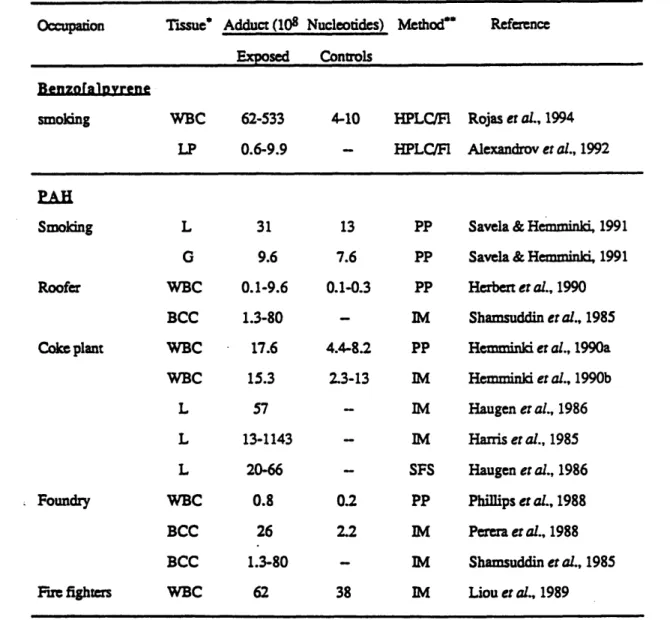
Table 2.1 summarizes the level of BP and PAH adduct in person exposed from various sources. For BP-DNA adduct, a new HPLC-fluorometric assay was used. Human occupational data for PAH were obtained by immunoassay analysis (ELISA, USERIA) using antibodies against BPDE-DNA, while total binding of aromatic DNA adducts was measured by 32P-postlabeling. Synchronous fluorescence spectrometry was
applied to detect aromatic DNA adducts in peripheral blood lymphocytes of workers in foundries and production of coke. As one can see from the table, the adduct levels in the exposed populations are in general higher than the controls.
Fig. 2.6
Stereochemistry of BP activation
Formation of BP metabolites responsible for the mutagenicity and carcinogenicity of the parent hydrocarbon. Solid arrows indicate major metabolic pathways.
STEREOCHEMISTRY OF BP ACTIVATION
11
12 1
j2
o~
i
9 7 6 0 7 . 6 5BP
OH OH OH I: (+)-BP-7R,8S-OXIDE II: (-)-BP-7R,8R-DIHYDRODIOL m: (anti)(+)-BP-7R,8S-DIOL-9S,10OR-EPOXIDE-2 IV: (syn)(-)-BP-7R,8S-DIAL-9R,10S EPOXIDE-1 V: (-)-BP-7S,8R-OXIDEVI: (+)-BP-7S,8S-DIHYDRODIOL
VII: (syn)(+)-BP-7S,8R-DIOL-9R, 10 OS-EPOXIDE-1 VIII: (anti)(-)-BP-7S,8R-DIOL-9R,10S-EPOXIDE-2 o OH 0H OHO 0 OH OH OH OH Viii VII
Table 2.1. DNA Adducts of BP and PAH from Various Exposure
Occupation Tissue' Adduct (108 Nucleotides) Method* Reference
Exposed Controls
Benzoralpyvrene
smoking WBC 62-533 4-10 HPLC/FI Rojas et aL., 1994 LP 0.6-9.9 - HPLC/FI Alexandrov et al., 1992
PAH
Smoking L 31 13 PP Savela & Hemminki, 1991
G 9.6 7.6 PP Savela & Hemminki, 1991 Roofer WBC 0.1-9.6 0.1-0.3 PP Herbert er al., 1990
BCC 1.3-80 - M Shamsuddin er al., 1985 Coke plant WBC 17.6 4.4-8.2 PP Hemminki er al., 1990a
WBC 15.3 2.3-13 IM Hemminki et al., 1990b
L 57 - IM Haugen er al., 1986
L 13-1143 - IM Harris er al., 1985
L 20-66 - SFS Haugen et al., 1986
Foundry WBC 0.8 0.2 PP Phillips et al., 1988
BCC 26 2.2 IM Perera et al., 1988
BCC 1.3-80 - lM Shamsuddin et al., 1985 Fire fighters WBC 62 38 IM Liou et al., 1989
* WBC: white blood cells; L: lymphocytes; LP: lung parenchyma; G: granulocytes; BCC: buffy coat cells.
** HPLC/Fl: HPLC-Fluorometric assay; PP: 3 2P-postlabeling, IM: immunoassay; SFS:
2.4.4. Repair of BP Induced DNA Adducts
The damage induced by PAH, and particularly the formation and repair of BP adducts, have been studied in mammalian cells (Maher et al., 1977; Cerutti et al., 1978; Busbee et al., 1984, McCormick and Maher, 1978, 1985; Chen et al., 1992). BP-DNA adducts can be repaired through excision pathways. In a study with XP12DE cells, the kinetics of the removal of DNA adducts formed by BPDE, cytotoxicity and the formation of mutagenic lesions were about the same. Residues were removed by repair enzymes of the normal cells over a period of four days. There was no loss of adducts in excision-deficient XP12BE cells (McCormick and Maher, 1985).
The repair of BP-DNA adducts occurs preferentially on transcribed strand of the gene (Chen et al., 1990, 1991, 1992; Andersson et al., 1992). A cell cycle-dependent strand bias was observed in repair-proficient human cells (Chen et al., 1990), but not in excision repair-deficient human cells (Chen et al., 1991). The preferential repair of
BP-DNA adducts also occurs on an activated gene compared to an inactivated genes (Chen et al., 1992).
2.4.5. BP Induced Mutations in Human Cells
Most of the studies on BP-induced human cells involve BPDE, the genetically active form of BP. It is because few of the human cell lines used today have the ability to activate BP. The BPDE mutational spectra were obtained by using either shuttle vectors containing BPDE adduct (Yang et al., 1987) or selectable genes (Keohavong and Thilly;
1992; Yang et al., 1991; Chen et al., 1990; Carothers and Grunberger, 1990). Fig. 2.7 is a
display of BP spectra in hprt exon 3. One has to bear in mind that most of the studies, except the one by Keohavong and Thilly (1992), used clone by clone analysis (see Section
Fig. 2.7
BPDE spectra in human cells
Mutational spectra of BPDE were obtained on the low-melting domain of hprt exon 3.
The horizontal axis represents the target sequence from position 215-318. The frequency
of each mutation is represented either as number of observations (panel A-C) or as
percentage of total 6TG
rmutations. The kind of the predominant hotspots were indicated
on the top of each spectrum and those for other hotspots were indicated on the top of the
vertical bars.
Panel A: Human fibroblasts, S phase (Chen et al., 1990);
Panel B: Human fibroblasts, G1 phase (Chen et al., 1990);
Panel C: Human fibroblasts, synchronous (Yang
et
al., 1991);
BPDE SPECTRA
IN
HUMAN CELLS
A G -> T FIBROBLASTS S phase N = 24 B G -> T FIBROBLASTS Glphase N = 24 I I! C G -> T FIBROBLASTS N = 34 A A D G -> T LYMPHOBLASTS N = 18,200 0 < 135 155 175 195 215 235 255 275 295 315Base Position
3-cc2.1), so the sequence specificity of the mutation was not statistically significant. Yet it is obvious from Fig. 2.7 that BPDE induces predominantly G ->T transversion mutations based on the fact that the repair of the BP adduct occurred preferentially on transcribed strand (see Section 2.5.4).
2.4.6. Dose-Dependence of BP Mutagenesis in Human Cells
Effects of dose and dose rate on BP mutagenicity has been studied in human lymphoblast cells (Danheiser, 1985; Danheiser and Thilly, 1989). AHH-1 cells were treated with BP up to 20 days at concentrations between 0.02-1 rM, and
dose-dependence of BP mutagenicity was observed (Fig. 2.8 & 2.9). When AHH-1 cells were exposed to BP between 0.1 and 1 jtM, the induced rate of mutation was high and constant from 0 to 5 days, after which the rate dropped sharply and remained steady until 20 days. Exposure to low concentrations of BP (0.02 jiM) resulted in a low but constant mutation rate throughout 20 days of treatment (Fig. 2.8). For a given integral dose (BP
concentration x time of exposure), long-term, low-dose exposure induced 4 times as many mutations as short-term, high-dose exposure (Fig. 2.9). Thus, it is impossible to extrapolate from a short-term, high-dose mode of BP exposure to a long-term, low-dose mode.
The striking feature of Danheiser's findings is the saturation effect after 5 days exposure to BP at 0.1 tM or higher. There are several steps along the BP mutagenesis pathway (Fig. 2.4) at which this saturation response might be affected, such as the blockage of BP transport into the cells; saturation of BP metabolism; or induction of DNA repair. Danheiser's results suggest that the DNA binding rate has not been a factor in the saturation effect. The event leading to the observed drop of mutation rate with time is occurring after DNA binding, either by enhanced adduct removal or induced DNA repair.
Fig. 2.8
Summary of long-term, low-dose BP mutagenesis in AHH- 1 cells
Weighted least squares lines for 0, 0.02, 0.1, 0.5, and 1 gM BP were fit to the mean mutant fraction of 3 independent experiments (performed in duplicate or triplicate) over a treatment period of 20 days. Numbers on the line indicate mutation rates (mutation per cell per day).
(Adapted from Danheriser, 1985).
I IKA
K.
I I
TIME OF TREATMENT (DAYS)
50 z 0 40 t--rr 30 LL z ~-20 10 0 6r0 -1 - • | 10 15 20
Fig. 2.9
Comparison of long-term x low-dose with short-term x high-dose BP-induced mutations in AHH-1 cells
0 5
BP CONCENTRATION X TIME (uM X DAYS)
4,2 CD,61 O I-5 04 U-z 3 02 LU 0 zl -dose 1-dose 10 ___
III. EXPERIMENTAL DESIGN
3.1. A STATISTICAL MODEL TO ESTIMATE VARIANCE IN LONG-TERM, LOW-DOSE MUTATION ASSAY
A long-term, low-dose protocols used in this experiment permits evaluation of BP
mutagenesis in the context similar to human experience. However, imprecision of such protocol arising from random error and systematic bias limits our ability to obtain mutational spectra with desired statistical precision and to distinguish mutational distribution from different dose conditions. As one might imagine, random error is increased by extending the treatment period, by decreasing the number of mutants
generated each day (low mutation rate) and by increasing the number of cycles of growth and dilution (during treatment and phenotypic lag). Oller et al. (1989a) developed a statistical model to analyze the variance of long-term, low-dose protocol, which allows the design of experimental protocol that can provide any desired degree of dispersion around the estimated mutant fraction and mutation rate. This model separates the physical steps of mutation assay and calculate the dispersion expected from each step. The dispersion is expressed in terms of statistical variance. These variances from each
steps of the assay are summed up to predict the variance expected from the long-term, low-dose protocol.
Experimental conditions are designated as follow: At the beginning of the
experiment (to), No cells and mo mutants were present. The background mutant fraction (MFo) at the beginning was determined by plating, so mo was calculated by No x MFo. The growth factor t was around 2 since AHH-1 cells doubled every day. Each day, Am mutants were generated. It could be quantified from the mutation rate. For the
spontaneous cultures Am represented the spontaneous mutants generated each day and for treated cultures Am represented the sum of spontaneous plus induced mutants generated
each day. During the j day treatment followed by k day phenotypic expression, there
were j + k -1 dilution steps with a dilution factor of 1/t. The repeated sampling and
dilution steps contributed to the variance of mutant fraction. At last, cells were plated into microtiter plates to determine their colony forming ability in the presence and absence of selective conditions.
Variance of Mutant Fraction
The experimental protocol used in large-scale human cell cultures consists four physical steps: 1) cell treatment with BP; 2) cell dilution during treatment; 3) phenotypic expression of the mutations after treatment; 4) plating for mutant fraction. Each independent step was the source of random error. The total variance of the protocol could be obtained by summing the variance of each step:
Var(MF)dilution during j days of treatment (1-1/t)*[(j*Am/t*2)+mo]*(j- 1)/N02
Var(MF)treatment for j days (j*Am/t+m0)/N02
Var(MF)dilution during k days of phenotypic lag (1-1/t)*(m0+j*Am/t)*k/d*N02
Var (MF)plating [(1-d)/d]*(mo+j*Am/t)/N02
+[(j*Am/t+mo)/N 0]2* ( [1-(xs/ns)]/xs*[ln(xs/ns)] 2+[1-(xodno)]/xo*[ln(xo/no)]2
---= Total Var(MF) (Eq. A)
Variance of Mutation Rate
The variance of the mutation rate can be approximated as follows:
a
2(mutation rate) = X[nj-(J-Jav)2-aj2]/[nj.(J-Jav)2]2 (Eq.B)J: treatment time point;
Jay: average of the treatment time points;
aj: variance at treatment time point calculated by Eq. A.
Goals for quantitative studies of BP-induced mutations are to discriminate between 1) zero mutation rate with untreated cultures and low spontaneous mutation rate; 2) treated cultures mutating at low mutation rate and untreated cultures; 3) cultures with different treatment conditions.
3.2. DESING AN EXPERIMENT TO STUDY LOW DOSE RATE MUTATIONS
The determining factor for designing a mutation assay is the ability to discriminate between a treated culture mutating with the same mutations rate as the untreated culture or a treated culture that is mutating at a low mutation rate such a twice the spontaneous rate (doubling dose of a chemical). Thus, to study mutagenicity of a chemical, one has to design an experiment which allows us to study mutations at a rate of 10-7 mutation per cell per day (or generation). To compare the mutation rates we could calculate the 95% confidence interval for the difference of the mutation rate based on Eq. B. If that confidence interval excludes zero, we can reject the hypothesis of equal mutation rate.
Oller et al. (1989a) demonstrated an analysis of variance in a long-term, low-dose
study. Using total hprt mutagenicity as an end-point, they indicated that 500 ml human cell cultures enables them to discriminate a treated culture that is mutating at a low
mutation rate (3 x 10⁻⁷) such as twice the spontaneous rate (1.5 x 10⁻⁷).
The end-point of this study, however, is a mutational hotspot comprised of mutant population carrying the same mutations. Such hotspot may contain 1% of total hprt mutants (discussed in Section 5.4.1). So we have to design an experiment to study the mutations arise at a rate of 10-9. We now consider a culture with a hotspot mutation rate
of 1.0 x 10⁻⁹ mutation per cell per day. In order to distinguish spontaneous rate (1.0 x
10-7) from zero, 1.0 x 10⁻⁹ ± (1.96 x SDspontaneous) has to exclude zero. As a result, the
dispersion around the estimated mutation rate has to be less than 50% (SDspontaneous <
0.5 x 10⁻⁹ ).
From the model discussed in Section 3.1, one can estimate the variance of mutation
rate by Eq. B. Herein, I calculated the variance of mutation rate using the conditions
reported in Table 3.1. These conditions were based on a long-term, low-dose experiment performed by Danheiser et al. (1989), but at a larger scale. The major difference is that studying mutational hotspot doesn't involve microtiter plating. The mutant cells are obtained by en masse selection with a selective agent. The variances of this process is likely to be small, since large number of mutants are selected. As a result, our statistical model only includes chemical treatment, cell dilution during treatment, and culture sampling and growth after treatment. One can see from the Eq. B that variance of mutation rate is markedly affected by the number of treated cells. Fig. 3.1 illustrates the dispersion around the mutation rate expressed as SDmutation rate/mutation rate decreases as the number of cells treated increases, for a given mutation rate. In order to achieve SDmutation rate/mutation rate < 0.5 at a mutation rate of 1 x 10⁻⁹, one has to treat 3 x 10⁹
cells, equivalent of 3 liters of human cell culture. To ensure the statistical quality, a 4 liter culture system was used in this study.
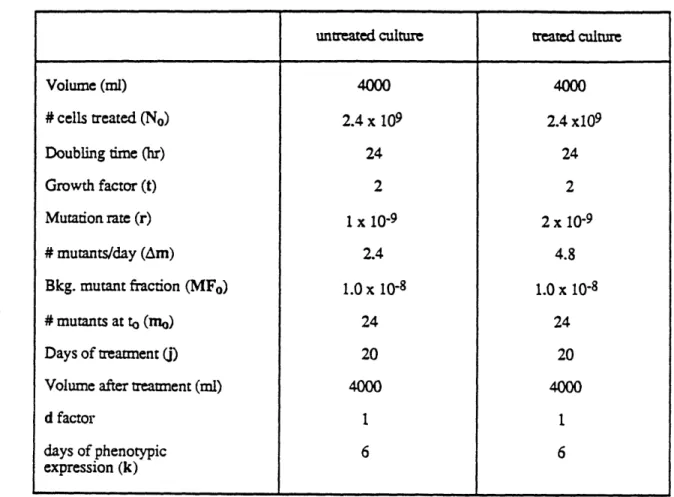
Now, let's examine whether a 4 liter culture allows us to distringuish mutational spectra between untreated culture and culture treated with a doubling dose. As a numerical example to illustrate this point, let's consider spontaneous and mutation rates for a mutational hotspot to be 1.0 x 10⁻⁹ and 2.0 x 10⁻⁹ mutation per cell per day, respectively (Table 3.1). So the difference between them (Ar) is 1.0 x
Table 3.1. Experimental Conditions for Large-Scale Design
untreated culture treated culture
Volume (ml) 4000 4000
# cells treated (No) 2.4 x 10⁹ 2.4 x10⁹
Doubling time (hr) 24 24
Growth factor (t) 2 2
Mutation rate (r) 1 x 10⁻⁹ 2 x 10⁻⁹
# mutants/day (Am) 2.4 4.8
Bkg. mutant fraction (MFo) 1.0 x 10⁻⁸ 1.0 x 10⁻⁸
# mutants at to (mo) 24 24
Days of treatment (j) 20 20
Volume after treatment (ml) 4000 4000
d factor 1 1
days of phenotypic 6 6
Fig. 3.1
Effect of number of cell treated on dispersion of mutation rate
Effect of the number of cells treated (No) on the percentage dispersion around the
estimated mutation rate. The statistical model was applied to protocol described in Table
3.1. Calculations were made for the following mutation rate: (o) 1 x 10
-9mutations per
N
1 1 1 1 1 1 1 1 1 1 I I I I I I I I I I12
16
20
Number of cells treated x 109 (NO)
0.8-
0.6-
0.4-
0.2-vo e3 Cu a *am ·I10-9. The variance of mutation rate (4 liter culture, NO = 4 x 10⁹) are 2.1 x 10⁻¹⁹ and 1.5
x 10-19 (Fig. 3.1). The variance of the difference of the mutation rate is then equal to 3.7
x 10-19 (the sum of the two). The confidence interval for the difference in mutation rate
becomes 1.0 x 10⁻⁹±(1.96 x 6.0 x 10-10). The lower bound of the interval is -1.8 x 10⁻¹⁰ which is extremely close to zero. This indicates a 4 liter culture system is the minimum requirement to study mutational spectrum induced by a doubling dose.
3.3. LARGE-SCALE HUMAN CELL CULTURES
Device for Lare Cultures
Large scale human cell culture was designed using modified 7 liter spinner flasks.
A schematic is shown in Fig. 3.2. One sidearm was fitted with a silicone stopper with an
air outlet, an air inlet and a sampling tube. Oxygen was provided as filtered air pumped through a sparger at a rate of 500 ml per min (see below for discussion). The culture was sampled daily through the sampling tube. The other sidearm of the flask was fitted with a medium inlet port and cell outlet port. A portion of the cell culture was pumped out (depending upon the cell density) and fresh medium of equal volume was replenished through the medium inlet port, so a constant volume was maintained. Sterile connections were made using C-flex splicable tubing (Cole-Parmer, Chicago, IL) spliced with a sterile connection device (Haemonetics Corp., Braintree, MA). Temperature was maintained at
37'C by placing cultures in water jacketed incubators. The working volume was between
2 and 4 liters. Cells were grown in RPMI 1640 media supplemented with 5% donor horse serum.
Fig. 3.2
Schematic design of large scale human cell cultures
Cell cultures were carried out in modified spinner flask. The working volume was between 2 and 4 liters. Cultures were maintained on a stirring plate in 37'C dry
incubator. No C02 was enriched into the incubator.
S"Vent
m In
I Out
Sar
Oxven Reauirement
It is worth mentioning that oxygen is an essential requirement for the normal growth of mammalian cells, but in excess or shortage of oxygen may inhibit the growth and metabolism of the cells. Oller et al. (1989b) studied the growth of another human lymphoblast cell line (TK6) at various oxygen concentrations. No adverse effect of oxygen on TK6 cell survival was seen for concentrations ranging from 60 jLM to 410 jiM.
Such range of dissolved oxygen has a pronounced effect on the design of large-scale mammalian cell culture devices.
The oxygen transfer rate in a fermentor is described by:
OTR = KLa (Cgas -Cliq),
where
OTR = oxygen transfer rate in gmol 1 -Ih-1;
KLa = mass transfer coefficient in h-l;
Cgas = gas-phase oxygen (equilibrium) concentration in gM; Cliq = liquid-phase oxygen concentration in gM.
Air is 21% oxygen. It was shown (Schumpe et al., 1978) that the concentration of oxygen in medium in equilibrium with dry air at 37'C is approximately 200 JIM. It was also shown by Oiler et al. (1989b) that the oxygen concentration in medium dropped to
50 gM prior to dilution. In addition, they indicated KLa of 2.5 h-1 for oxygen transfer in
a system similar to this study. The oxygen transfer rate attainable using air in the system is thus 370 inmol -1h-1.
Does this oxygen transfer rate sustain AHH-1 cells grow at 1 x 10⁶ cells per ml? AHH-1 cell line has an oxygen consumption rate of 0.1 pmole cell-h -1 (personal
communication with Dr. W.G. Thilly). The concentration of AHH-1 cell culture is around 1 x 10⁶ cells per ml, the oxygen consumption then becomes 100 jimol 1-h-1. This
indicates the oxygen transfer rate of the system (370 pmol l-lh-1) is enough to sustain the
growth of AHH-1 cells in culture.
General Protocol for Long-term. Low-dose Study
The experimental protocol is illustrated in Fig. 3.3. The cultures were diluted daily to 5 to 6 x 10⁵ cells per ml. BP was added daily to the culture with fresh media
containing BP at desired concentration (see Section 5.1). At the end of treatment period, cells were centrifuged (1,000 g x 10 min) and resuspended in fresh media and carried over for 6 days for the phenotypic expression of hprr mutants. 6TG was then added to each culture to the final concentration of 1 gig per ml. Cells were grown with the presence of 6TG for 3 days, and then spun down from 6TG and resuspended in fresh media. After around 15 days, 6TGr cells grew back and were harvested for the molecular
analysis. Throughout the experiment, all cells removed from the culture during daily dilution were spun (1,000g x 10 min) and frozen at -1350C for later analyses.
Fig. 3.3
Protocol for long-term, large-scale human mutation assay
AHH- 1 cells were HAT treated for 3 days, followed by a 2 day recovery period in
TH. HAT treated cells were then scale up and continually exposed to BP from 0 to 20
days, during which time samples were taken for mutant fraction determination and
molecular analysis. At sampling, BP was removed from the cultures and 6 days were
allowed for phenotypic expression. To determine mutant fraction, the cells were plated in
the presence and absence of 6TG. Plates were incubated at 37"C in
5%
C02 humidified
incubators and scored 14 days later. Cells for molecular analysis were grown in 6TG (1
gg/ml) for 3 days after phenotypic expression and resuspended into fresh medium.
Exponential growth resumed 15 days later. Cells were then harvested for molecular
analysis. Throughout the experiment, all cells removed from cultures during daily
dilution were frozen and stored at -135"C.
TIMES (days) Remove BP etc. Phenotypic Expression (6 days) Plate (w/ & w/o 6TG) Score Plates Determine MF 6TG Selection (14-18 days)
Harvest Mutant Cells
DNA Isolation Mutational Spectrum hifi-PCR/DGGE I I I LL HAT 2 etc. I t I
IV. MATERIALS AND METHODS
4.1. CELL LINE
A human lymphoblast cell line, AHH-1, was developed in our lab and licensed to
the Gentest Corp. (Woburn, MA). This cell line was isolated and characterized by Dr. C. L. Crespi (Crespi, Ph. D thesis, MIT, 1982; Crespi and Thilly, 1984).
AHH-1 cell line was isolated by from a subclone of the RPMI-1788 human
lymphoblast line with some BP-oxygenating ability (Freedman et al. 1979a, b; Moore and Minowada, 1969). RPMI-1788 cells contained high basal and induced level of P4501A1 (AHH) activity. This activity could be induced about 3.5-fold by pretreatment with 10 p.M BP for 48 hours. Because the RPMI-1788 cell line was contaminated with
mycoplasma, mycoplasma-free subclones were isolated, and the cell were subject to antibiotic treatment. One of the mycoplasma-free clone was found to be hypersensitive to BP-induced growth inhibition and was designated AHH-1. This cell line has been
routinely tested for mycoplasma contamination and all tests have been negative. AHH-1 cell line is competent in oxidative xenobiotic metabolism, thus it is sensitive not only to directly active mutagens (i.e. EMS, ICR-191) but also mutagens which require metabolic activation (i.e. BP, aflatoxin B i). It expresses high basal levels
and inducible benzo[a]pyrene hydroxylase (AHH) activity and 7-ethoxyresofurin deethylase activity, but minimum level of epoxide hydrolase. These activities can be induced by pretreatment with various PAH such as BP or 8-naphthoflavone. A
significant induction of AHH activity was observed after a 24 hr pretreatment of 0.01 gM BP with a plateau of 13.8-fold increase in AHH activity after treatment of AHH-1 cells with 10 g.M BP for 24 hrs (Fig. 4.1). The time course of AHH activity was also
determined (Fig. 4.2). Significant induction occurred after a 1 hr delay with exposure to 10 .rM BP. AHH activity increased linearly with time, reached a maximum at 24 hrs, and
Fig. 4.1
Concentration dependence of BP induction of AHH activity
Cells were treated with different concentrations of BP for 24 hours. Cells were washed and AHH activity measured. Each point represents the mean of 4 independent determinations (2 independent experiments). Confidence limits represent on standard deviation.
Fig. 4.2
Time course of AHH activity induction
Relative AHH activity is plotted vs. time (0 - 72 hours) after induction of AHH-1 cells with 10 pLM.
LO
OhO
remained fairly stable up to 72 hrs. Phenol production (indicative of AHH activity) was found to increase linearly with induced hprr mutations (Crespi, Ph.D. Thesis, MIT,
1982).
Many aspects of AHH-1 cell biotransformation resembles that of human peripheral lymphocyte. AHH- 1 cells produces primarily phenolic metabolites of BP with minor amounts of quinones and dihydrodiols. However, AHH-1 cells don't produce any known amount trans-dihydrodiol-BP metabolite. BP-adduct analysis showed that BP-4,5-oxide accounts for 7% of the adduct and 9-hydroxy-4,5-oxide-BP accounts for about 2%. The majority of adducts consist of uncharacterized species (Crespi, Ph.D. Thesis, MIT, 1982).
AHH-1 cells, in addition to being competent for xenobiotic metabolism, are phagocytic (Crespi et al., 1985). This characteristic can be used for studying the effects of xenobiotics present in particulate, since materials carried by particulate are extracted under near-physiological conditions.
4.2. CELL MAINTENANCE
AHH-1 cell line is anchorage independent, so it grows in both stationary and stirred cultures with a doubling time of around 24 hrs. AHH- 1 cells were grown in RPMI 1640 media (JRH Biosciences, Lenexa, KS) supplemented with 5% donor horse serum (JRH Biosciences, Lenexa, KS). It should be noted that response of AHH- 1 cells to inducers of AHH activity is strongly influenced by unknown serum factors. Screening of serum batches is necessary in order to sustain the cells' expression of cytochrome P450 enzyme (Drs. Crespi and Penman, personal communication). The cultures were diluted daily to
5-6 X 10⁵ cells per ml and maintained in 37"C incubator with a 5% C02 atmosphere. Care
was exercised that the cell concentration never exceeded 1.2 x 10⁶ cells per ml. In stationary cultures, cells were maintained in 175 cm2 T-flasks. They tend to grow as