HAL Id: hal-00508529
https://hal.archives-ouvertes.fr/hal-00508529
Submitted on 4 Aug 2010HAL is a multi-disciplinary open access archive for the deposit and dissemination of sci-entific research documents, whether they are pub-lished or not. The documents may come from teaching and research institutions in France or
L’archive ouverte pluridisciplinaire HAL, est destinée au dépôt et à la diffusion de documents scientifiques de niveau recherche, publiés ou non, émanant des établissements d’enseignement et de recherche français ou étrangers, des laboratoires
Coupling of reed bed filters and ponds: an example in
France
A. Lienard, C. Boutin, R. Bois
To cite this version:
A. Lienard, C. Boutin, R. Bois. Coupling of reed bed filters and ponds: an example in France. 2nd international specialized conference on design and operation of small wastewater treatment plants, Jun 1993, Trondheim, Norway. p. 201 - p. 208. �hal-00508529�
oc,"d if'Le^notvQooL Specialized Contener* ce
WASTCW/ATtC TCtATHEKjT P L A
Design
í
COUPLING OF REED BED FILTERS AND PONDS : AN EXAMPLE IN FRANCE
A. Liénard*, C. Boutin*, R. Bois**
*CEMAGREF (CEntre national du Machinisme Agricole, du Génie Rural, des Eaux et des Forêts), Division Qualité des Eaux, 3 bis, Quai Chauveau, CP 220, 69336 Lyon Cedex 09, France
**DDASS (Direction Départementale des Affaires Sanitaires et Sociales), Service Santé Environnement, 1 Rue des Argentiers, 16017 Angoulême Cedex, France
ABSTRACT
The study of wastewater treatment series based on the use of macrophyte beds, in accordance with a design initially developed in Germany by Dr. Seidel, was initiated by CEMAGREF in 1983. The number of plants constructed was deliberately limited and they were subject to regular assessments and improvements. It was thus shown that only reed bed filters that were drained and alternately fed, were able to handle a pollutant load of the order of 80 g COD m-2 day-1 with satisfactory treatment reliability over a period of several years. The Gensac la Pallue plant, in the Charente department, is original since it combines this type of filter in the first treatment stage with three microphyte ponds designed with a low theoretical residence time of 21 days (compared with the usual residence time of 30 days in tertiary treatment). The whole treatment series only occupies an effective surface area of approximately 6 m2 per p.e. (about 1 m2 and 5 m2 for filters and ponds respectively).
After 5 years of operation and monitoring, it has been clearly established that filters dosed with raw wastewater at a rate of 65 g of COD and 30g of TSS m-2 per day, regularly achieve a removal rate of 70 to 85 % of these same elements without clogging. The daily hydraulic load that the filter can withstand in service regularly exceeded 2 meters in the month of November 1992.
The ponds finish the treatment and this article limits itself to analysing results relating to the elimination of nutrient, which reaches 35% for nitrogen and 55% for phosphorus. Residence times that are too short in winter, in conjunction with a large part of the sewerage system being of combined type, can sometimes temporarily lead to an increase in the amounts of nitrogen and phosphorus discharged to the natural environment.
KEYWORDS
Elimination of nutrients ; reed bed filters
wastewater treatment. vertical flow systems ; waste stabilisation ponds
INTRODUCTION
In complete treatment, the majority of French wastewater treatment plants using natural waste stabilization ponds (WSP) comprise a series of three ponds (of so called microphyte type) covering a total surface area of 10 m2/p.e. (Ministère de l'Environnement, 1979). The average residence time of the wastewater in such plants is around 60 days. In France there are currently 2,500 natural WSP.
f
The planting of rooted hydrophytes (Typha, Juncus, Carex, Scirpus, Sparganiumetc.) m the third or (and) in the second pond was recommended in the early design such plants so as to limit the discharge of microscopic suspended algae Accordino to a national survey, it is estimated that 10% of second ponds and 25% of third ponds are nla Measurements enabling a judgement to be made as to whether these devices are well-foundori not, either in terms of reductions in suspended matter or in terms of elimination of nutrient« °r
very few and their results are controversial. On the other hand, it is certain that oolr'J* constraints each winter involving clearing of the withered exposed part of the oían substantial. Very few communities are ready to perform such operations in a correct and i manner. In view of this fact, the systematic use of partially immersed rooted hydroohvte on™ after microphyte ponds is no longer recommended. ^ P a s
The Gensac la Pallue experimental wastewater treatment plant, presented in this article althmmh including planted stages, is very different and unique in France. The first stage comprises dr a
filters made up ui several layers of gravel, planted with reeds and alternately fed It is followed h a senes of 3 ponds that finish the treatment. This plant was designed to meet the specific: need, of the community who wished to increase the treatment capacity of its plant. However it was assigned as a full scale experiment to confirm the interesting potential of reed bed filters that had already been foreseen (Boutin C, 1987).
DESCRIPTION OF THE GENSAC LA PALLUE PLANT (CHARENTE)
¿ n « ; H , ^ a n iS c o n n e c t e d t 0 t h e sewerage system. This system is mostly of combined
type and includes 8 pumping stations. A district of some 60 inhabitants is however connected to a S ! 3 H ,5™6'8 9 6 S y S t e m a n d a S p e c i f i c p u mPi n9 s t a t i o a T h e screening summarily is
performed by screens equipped with grinder pumps placed in the pumping stations
bince this is a rural community, the wastewater is basically of domestic origin However in 1989 the setting up in the community of a factory to produce de-mineralized water (used to manufacture Cognac) using ion exchange resins has caused a change in the wastewater quality
The effluent standards must normally meet the following levels : TSS s 120 mg/l", COD (filtered sample) s 120 mg/l, BOD5 (filtered sample) s 40 mg/l (Circulaire interministérielle, 1980).
Reed bed filters
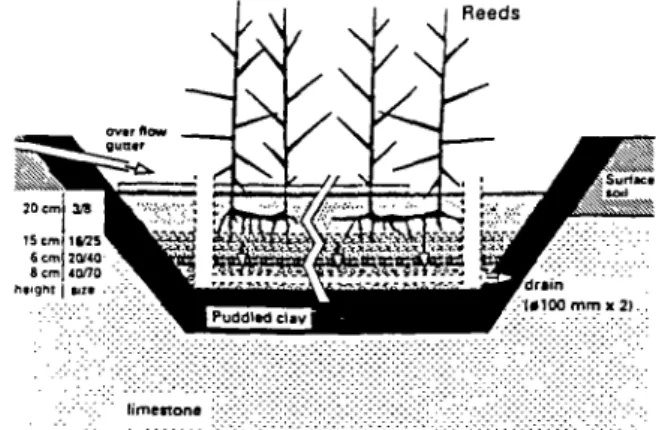
The design of the 8 filters, having a total infiltration surface area of 1,913 m2 (an average of 239 m2 each), making up the first treatment stage ( Fig. 1) was based on experience acquired by CEMAGREF concerning plants of the Max Planck Institute Process type as initially designed bv Dr. S E I " ' - " ' ~ ' " ' '
then it i
* The unit of sizes of the gravel is in mm.
Fig. 1. Longitudinal cross section of a reed bed filter.
Aseries of three microphyte ponds, of total surface area 8390 m2 make up the second treatment jtage. D u e t 0 topological constraints, they have complicated shapes and above all are shallow (55 to 70 cm). The effective volume of these ponds is thus relatively small, it can be estimated to 5 300 m3. The surface area of the 3 ponds is only 4.9 m2 per p.e., which represents the area that is usually required for natural tertiary treatment ponds for which a residence time of 30 days is considered to be sufficient (Ministère de l'Environnement, 1979).
MONITORING
Five monitoring periods each of 48 hours were carried out by the CEMAGREF in September 1988. March 1989, June 1989, June 1990 and November 1992.
Two 24 hours monitoring periods were performed in November 1987 and June 1991 by the DDASS, who in addition carried out 17 short visits between January 1988 and August 1992.
Flow measurements
Trie flow rates into the plant were measured using pump operating time of the last two pumping stations. On the bed outlets, a control flume, equipped with a V-notch weir coupled to a bubble flow meter enables the flow rate entering the ponds to be measured. An identical device is used on the final outlet after the third pond.
The measurement of the flow through each pump and the flow rates at the bed and pond outlets was only performed during monitoring periods of 24 or 48 hours. The daily flow rate input to the station can be calculated using the daily pump operating times taken by the local council operators on working days.
Sampling
This is performed using automatic samplers, at the same points and in proportion to the flow measurements during the 24 or 48 hours monitoring periods. Snap samples were taken at the filters outlet and at the final outlet during short visits.
WASTEWATER CHARACTERISTICS
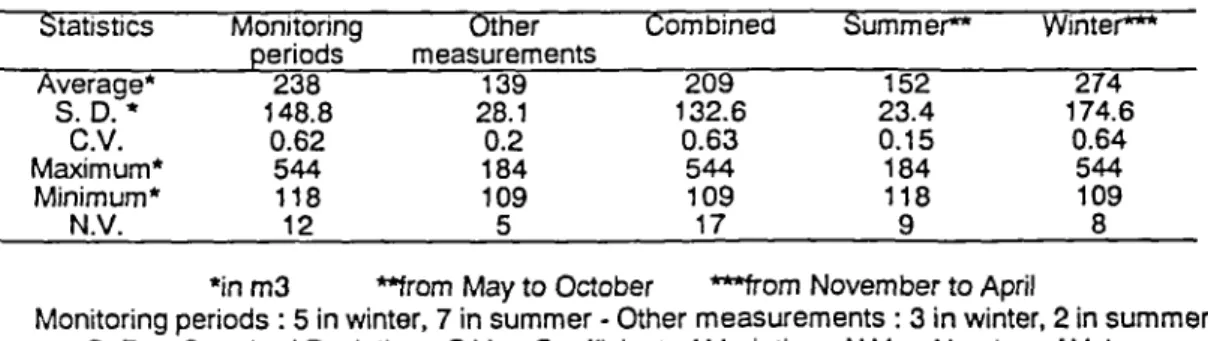
Detailed examination of the results of 12 daily flow measurements, during the 24 and 48 hours monitoring periods together with data of pump operating times during five other periods corresponding to DDASS short visits reveal important seasonal variations (Table 1).
Most of the sewerage system is of combined type, which has a considerable effect on the volumes treated, especially in winter, which is normally the period with the highest rainfall.
TABLE 1 Daily Variations in Flow Rate
Statistics Monitoring Other Combined Summer** Winter*** periods measurements Average* S.D.* C.V. Maximum* Minimum* N.V. 238 148.8 0.62 544 118 12 139 28.1 0.2 184 109 5 209 132.6 0.63 544 109 17 152 23.4 0.15 184 118 9 274 174.6 0.64 544 109 8
•in m3 **from May to October ***from November to April
Monitoring periods : 5 in winter, 7 in summer - Other measurements : 3 in winter, 2 in summer S. D. = Standard Deviation ; C.V. = Coefficient of Variation ; N.V. = Number of Values
The maximum flow rate of 544 m3 was measured during a monitoring period at the end of November 1992. Between the 2nd and the 26th of November, the daily average was determined as 475 m3. The rated hydraulic load in dry weather is 255 m3 day-1.
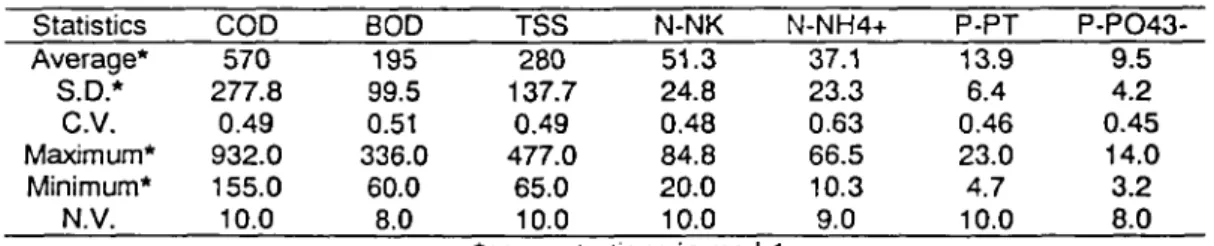
The concentrations given below come from analysis of average daily samples, proportional to the flow rate and taken at the plant inlet in November 1987, September 1988, June 1989, June 1991 and November 1992 for predominantly domestic wastewater.
The results of the June 1990 monitoring period were distorted by malfunctions of the neutralization system for acidic and alkaline solutions used for resin regeneration in the de-mineralized water production plant. They have been separated and are given as results for predominantly industrial wastewater.
Predominantly domestic wastewater.
With the exception of suspended solids which are ground as they pass through the pumping stations, this wastewater has average concentrations of approximately 25% lower than those measured in separated sewerage systems of comparably sized agglomerations.
TABLE 2 Principal Characteristics of Predominantly Domestic Wastewater Statistics Average* S.D.* C.V. Maximum* Minimum* N.V. COD 570 277.8 0.49 932.0 155.0 10.0 BOD 195 99.5 0.51 336.0 60.0 8.0 TSS 280 137.7 0.49 477.0 65.0 10.0 N-NK 51.3 24.8 0.48 84.8 20.0 10.0 N-NH4+ 37.1 23.3 0.63 66.5 10.3 9.0 P-PT 13.9 6.4 0.46 23.0 4.7 10.0 P-PO43-9.5 4.2 0.45 14.0 3.2 8.0 Concentrations in mg 1-1
Maximum values were observed in September 1988 and June 1991 and minimum values in November 1992 when dilution due to run-off water was high.
Predominantly industrial wastewater.
The higher concentrations of organic matter (COD and BOD) are certainly due to cleaning and dissolving of organic deposits accumulated in the pipes and pumping stations caused by the pH of the industrial effluent varying between 6 and 12.5. Nitrogen and phosphorus content are only slightly different from the maximum values previously noted for predominantly domestic wastewater accounting for the low dilution due to run-off water in June 1990.
TABLE 3 Principal Characteristics of Predominantly Industrial Wastewater COD BOD TSS N-NK N-NH4+ P-PT P-PO43-27th June 1990 1460 475
28th June 1990 962
concentrations in mg 1-1
The wastewater also had increased concentrations of suspended solids and very high salt content (conductivity reaching 20,000 pS cm-1). The mineral percentage of TSS was 70 % the first day and 45% the second (whereas it was only 15 to 25% during the other monitoring periods). The lack of information concerning the frequency of malfunctions of the intermediary storage, mixing and neutralization device unfortunately does not enable any conclusions to be drawn as to the resistance of reeds to attacks from such effluents.
793 431 91.5 52.6 66.0 72.4 21.9 19.2 10.0 7.5
Calculated using results from the 7 monitoring periods, the organic loads treated by the plant represent on average around 60 % of its rated capacity for COD and BOD.
TABLE 4 Rated and Average Treated Organic Load
COD BOD •—Rated load* 170 Treated load* 121 TSS "P^PT 77 43 60 11 * in kg day-1 REED BED FILTER OPERATION
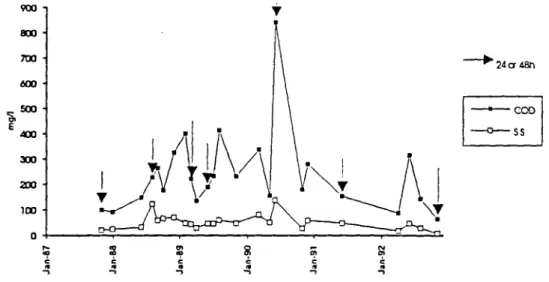
This can only be correctly assessed using the results obtained during the 24 and 48 hours monitoring periods. However, results of analysing snap samples taken by the DDASS are also given for information only (Fig. 2). Industrial effluent in June 1990 considerably disrupted the operation of the beds and COD removal was notably more affected than that of TSS (respectively 28.9 and 77.4%). The purifying biomass attached to the gravel was partially destroyed by the acidic and basic solutions, whereas the physical filtration process is naturally much less affected.
900 800 7 0 0 • «00 500 -400 300 200 1 0 0 • 0 2<tcr 4 8 h
Fig. 2. The variation in COD and TSS concentrations at the filters outlet.
The average levels of elimination, calculated using average daily samples, give a fairer and more accurate picture of the operation (Table 5).
Removal of nitrogen and phosphorus is poor and irregular. This can be explained by the coarseness of the gravel, its mineralogy (silica) and the shallowness of the 3/8mm size layer of medium.
TABLE 5 Elimination Rates for Reed Bed Filters Treating Domestic Wastewater
Average S.D. C.V. Maximum Minimum N.V. COD 68.1 6.3 0.09 80.1 58.1 10 BOD 72.3 6.4 0.09 83.9 60.4 8 TSS 87.2 2.3 0.03 92.2 84.3 10 N-NK 28.9 8.9 0.31 43.1 19.8 10 P-PT 22.0 14.6 0.66 41.9 0.0 10
Average, Standard Deviation (S.D.), Maximum and Minimum in %
The operation is very satisfactory in terms of parameters indicating degradation of organic matter In addition, these levels of performance were obtained with hydraulic loads of between 0.5 and 2.2 m3m-2 day-1 on the filter in service at the time of taking the measurements. It can thus be considered that the RBF correctly carry out the role for which they were designed, that of eliminators of organic pollution. After five and a half years of service, the height of the organic deposits is no more than 5 or 6 cm, they are well mineralized and rich in earth-worms and their permeability remains high.
OPERATION OF THE WASTE STABILIZATION PONDS SERIES
Compared with the guidelines for design of natural WSP in France (50 g of BOD m-2 day-1), ¡t can be seen that the Gensac La Pallue ponds only receive a loading of 2.5 g of BOD m-2 day-1 (5.6 g of COD m-2 day-1). In addition to complementary degradation of organic matter, the main role assigned to them is that of eliminating nutrients. It is thus with regards to-this particular aspect that we will investigate their operation.
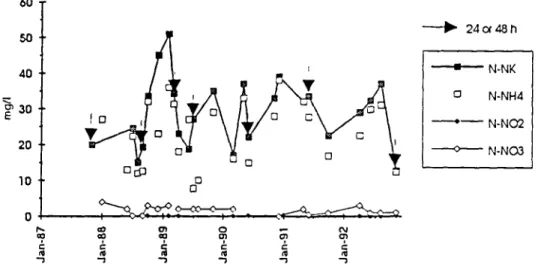
The graphical representation of the concentrations of the various forms of nitrogenous substances, as recorded from 24 snap and average samples, only gives a partial insight into their operation (Fig. 3). It can, however, be seen that the nitrite and nitrate contents are always low, but that the Kjeldahl nitrogen concentration (principally ammonium salts) fluctuates considerably and sometimes reaches high values.
24 Of 48 h
Fig. 3. Variation in nitrogen concentrations at the outlet of the ponds.
It is well known that the concentration is not the best adapted parameter by which to judge the efficiency of WSP, and is even less so when it is subject to a very variable hydraulic loading as has been shown by the inlet flow measurements for the plant. In addition, it has been shown that WSP almost behave as infinitely mixed reactors (Racault et al., 1984). It is thus possible to calculate a theoretical residence time (TRT) in the ponds based on the total daily inlet volume until the volume of each pond is reached. Table 6 summarises the results of calculations based on inlet flows to the plant during 10 monitoring periods (5 in summer, 5 in winter) between November 1987 and November 1992. A reduction in residence time can be seen in winter. In addition, the variability is significantly greater as the minimum and maximum values show.
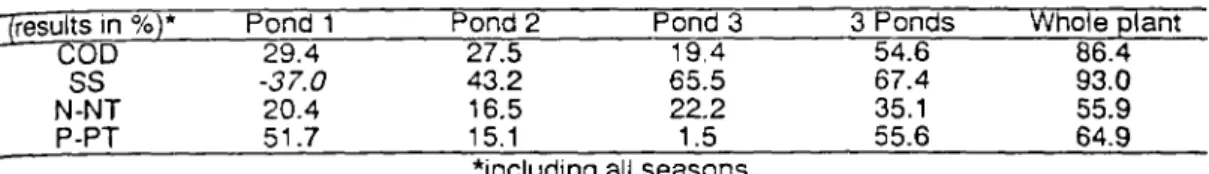
The loads and the elimination rates for each pond were calculated (Table 7) based on the average flow rates used for the calculation of residence time. At the outlet of pond 1, the pullulation of phytoplancton negatively affects the elimination of suspended solids. It naturally rights itself in ponds 2 and 3 where, in the summer season, large populations of micro-crustacaa
(Daphnia) can be observed, especially in the last pond.
Pond 1 Pond 2 Pond 3 3 Ponds Pond 1 Pond 2 Pond 3 3 Ponds SUMMER (from May to October) WINTER (from November to April) Average* Maximum* Minimum* 11.0 13.1 7.8 8.8 12.4 4.7 18.0 24.0 10.9 37.8 49.2 23.3 8.0 11.9 3.1 6.7 11.4 1.9 15.9 23.4 4.6 30.6 44.1 9.6 * values in days
Observed as a whole, the elimination of nutrients reaches levels that other less rustic treatment plants would be happy to achieve. However, this apparently good performance may not be satisfactory under all circumstances, if the plant was subjected to an effluent level of 2 mg/1 for phosphorus and a total nitrogen concentration of 20 mg/l (Circulaire interministérielle, 1980). Taking these figures as a basis for the rated daily flow rate, the load limits have been calculated.
TABLE 7 Iresults in %)* COD SS N-NT P-PT
Averaae Percentaae Elimination Pond 1 29.4 -37.0 20.4 51.7 Pond 2 27.5 43.2 16.5 15.1 in the Ponds Pond 3 19.4 65.5 22.2 1.5
and in the Plant 3 Ponds 54.6 67.4 35.1 55.6 as a Whole WholejDlant 86.4 93.0 55.9 64.9 including all seasons
These were shown on a graph of TRT against the loads calculated using the average influent flow rates during periods corresponding to when the samples were taken. This approach reveals discharge of excess total nitrogen and phosphorus loads (Fig. 4) as already mentioned (Boutin P. era/., 1987) when the average TRT in the ponds is less than respectively 30 or 40 days. There appears to be more room for manoeuvre at the present time in terms of nitrogen, but it could become worse if additional users should be connected (the rated flow rate in dry weather only allowing a TRT of 21 days).
a^oercgescmpie
s =snapsanpie
10 20 30
Thvoreticd residence time (days)
N-NT-a N-NT-S P-PT-a P-PT-S w.N-NT • cv.P-PT
Fig. 4. Variation in nutrient loads in the final effluent as a function of the TRT in the 3 ponds It should also be remembered that the normal accumulation of sediment on the bottom of the ponds is constantly reducing the effective volume. The residence time is certainly not the only factor to be accounted for, and it can be imagined that the temperature and the seasons also have an effect that it was not possible to accurately determine.
CONCLUSION - DISCUSSION
Operation of the Gensac la Pallue reed bed filters, which have been in service for the last five and a half years, has been studied in 7 monitoring surveys and have been found to be operationally very reliable. They regularly achieve elimination rates of 85% for suspended solids whilst being dosed with raw wastewater of very variable flow rate. In winter, the sewerage system, that is mostly of combined type, collects significant volumes of run-off water which causes peaks in hydraulic load of 2 to 2.5 meters day-1 on the filter in service. No significant clogging occurs. The practice of alternating dosing, combined with a drained and aerated filtering system is absolutely essential to allow aerobic mineralization of the organic deposits retained on the infiltration medium and to avoid clogging either in the short or long term. The reed (Phragmites communis) appears, according to current understanding, to be the plant species that is best suited to widely fluctuating hydrous conditions depending on dosing and rest phases. In addition, its large root network, combined with an ability to regularly put out new stems from rhizome nodes, makes it an element providing active maintenance of permeability levels compatible with purifying demands on surface areas of around 1 m2 per p.e.
The shallow ponds (0.5 to 0.7 m), have a total water surface area of a little less than 5 m2 per p.e. which gives them an average residence time of 21 days at the rated flow rate. Under these conditions, and in spite of the elimination rates of nutrients comparable in summer with those observed in natural WSP designed for complete treatment, high residual loads of nitrogen and phosphorus, essentially in soluble form, can be discharged to the natural environment in winter. The phytoplancton content at the outlet is generally low since the average COD measured for the non-filtered effluent do not exceed 95 mg/l. Lastly, the everyday maintenance of this plant is characterised by its simplicity, only requiring 40 days per year.
The experience acquired on the 1 st stage of this site should be of benefit in designing filtration systems with a view to limiting the discharge of phytoplancton in the outlet of natural WSP. They could usefully replace more controversial macrophyte ponds.
ACKNOWLEDGEMENTS
We would like to thank the local council of Gensac la Pallue for the interest and confidence shown with respect to this new and experimental type of plant.
REFERENCES
BOUTIN C. (1987). Domestic wastewater treatment in tanks planted with rooted macrophytes : case study, description of the system, design criteria and efficiency. Wat. Sci. Tech., Vol.19, N°10, pp. 29-40.
BOUTIN P., SATESE DES DEUX-SEVRES (1987). Stabilization ponds in South-West France: Effluent quality. Wat. Sci. Tech., Vol.19, N°12, pp. 329-332.
CIRCULAIRE INTERMINISTERIELLE (1980). Circulaire du 4 Novembre 1980. Journal Officiel de
la République Française, 29 Novembre 1980, pp. 10390-10395.
LIENARD A., BOUTIN C, ESSER D. (1990). Domestic wastewater treatment with emergent hydrophyte beds in France. In : Constructed wetland in Water Pollution Control. Advances in Water Pollution Control, ed Cooper PF et Findlater BC. Pergamon Press, pp. 183-192. MINISTERE DE L'ENVIRONNEMENT ET DU CADRE DE VIE, AGENCE FINANCIERE DE
BASSIN LOIRE-BRETAGNE (1979). Lagunage naturel et lagunage aéré. Procédés d'épuration des petites collectivités. Etude Inter Agences, 72 p.
RACAULT Y., BOUTIN P. (1984). Etude par traçage du comportement hydraulique d'une lagune d'épuration ; influence de la géométrie du bassin. Rev. Fr. Sci. Eau, Vol.3, N° 2, pp. 197-218.