arXiv:1110.6908v1 [astro-ph.SR] 31 Oct 2011
Spectroscopic variability and magnetic fields of HgMn stars
⋆S. Hubrig1,⋆⋆, J.F. Gonz´alez2, I. Ilyin1, H. Korhonen3, 4, I.S. Savanov5, T. Dall6, M. Sch¨oller6, C.R. Cowley7, M. Briquet8,◦, and R. Arlt1
1
Leibniz-Institut f¨ur Astrophysik Potsdam (AIP), An der Sternwarte 16, 14482 Potsdam, Germany 2
Instituto de Ciencias Astronomicas, de la Tierra, y del Espacio (ICATE), 5400 San Juan, Argentina 3
Niels Bohr Institute, University of Copenhagen, Juliane Maries Vej 30, 2100 Copenhagen, Denmark 4
Finnish Centre for Astronomy with ESO (FINCA), University of Turku, V¨ais¨al¨antie 20, FI-21500 Piikki¨o, Finland 5
Institute of Astronomy, Russian Academy of Sciences, Pyatnitskaya 48, Moscow 119017, Russia 6
European Southern Observatory, Karl-Schwarzschild-Str. 2, 85748 Garching bei M¨unchen, Germany 7
Department of Astronomy, University of Michigan, Ann Arbor, MI, 48109-1042, USA 8
Instituut voor Sterrenkunde, Katholieke Universiteit Leuven, Celestijnenlaan 200 D, 3001 Leuven, Belgium Received 2011 Sep 23, accepted 2011 Sep 29
Published online 2011
Key words stars: atmospheres – stars: abundances – stars: chemically peculiar – stars: magnetic fields – stars: individual: AR Aur, HD 11753, HD 101189 – techniques: polarimetric
The discovery of exotic abundances, chemical inhomogeneities, and weak magnetic fields on the surface of late B-type primaries in spectroscopic binaries has important implications not only for our understanding of the formation mechanisms of stars with Hg and Mn peculiarities themselves, but also for the general understanding of B-type star formation in binary systems. The origin of the abundance anomalies observed in late B-type stars with HgMn peculiarity is still poorly understood. The connection between HgMn peculiarity and membership in binary and multiple systems is supported by our observations during the last decade. The important result achieved in our studies of a large sample of HgMn stars is the finding that most HgMn stars exhibit spectral variability of various chemical elements, proving that the presence of an inhomogeneous distribution on the surface of these stars is a rather common characteristic and not a rare phenomenon. Further, in the studied systems, we found that all components are chemically peculiar with different abundance patterns. Generally, He and Si variable Bp stars possess large-scale organised magnetic fields that in many cases appear to occur essentially in the form of a single large dipole located close to the centre of the star. The presence of magnetic fields in the atmospheres of HgMn stars has been demonstrated in several studies. In addition to the measurements of longitudinal and quadratic magnetic fields, this work also showed evidence for a relative magnetic intensification of FeIIlines produced by different magnetic desaturations induced by different Zeeman-split components.
c
2011 WILEY-VCH Verlag GmbH & Co. KGaA, Weinheim
1 Introduction
Observational data suggest that approximately two-thirds of all solar-type field stars form in binary, triple, or higher-order systems and that all massive stars are in multiple systems, preferentially in higher-order systems rather than in binaries (e.g., Duquennoy & Mayor 1991; Tokovinin & Smekhov 2002; Kobulnicky & Fryer 2007). Studies of stars of various mass in binary systems are of particular interest for a number of reasons. Binarity makes it possible to obtain solid data on stellar fundamental properties such as mass and radius as well as the evolutionary status of both com-ponents. Furthermore, the analysis of the chemical compo-sition of the components gives clues to the origin of their frequently observed chemical surface anomalies.
Over the last years, we have performed extensive spec-troscopic studies of upper-main sequence specspec-troscopic bi-⋆ Based on ESO Archival data, from ESO programme 083.D-1000(A). ⋆⋆ Corresponding author: shubrig@aip.de
◦
Postdoctoral Fellow of the Fund for Scientific Research of Flanders (FWO), Belgium.
naries with late B-type primaries (spectral types B7–B9) with the goal to understand why the vast majority of these stars exhibits certain chemical abundance anomalies, i.e. large excesses of P, Mn, Ga, Br, Sr, Y, Zr, Rh, Pd, Xe, Pr, Yb, W, Re, Os, Pt, Au, and Hg, and underabundances of He, Al, Zn, Ni, and Co (e.g. Castelli & Hubrig 2004a). Strong isotopic anomalies were detected for the chemical elements Ca, Pt, and Hg with patterns changing from one star to the next (Hubrig et al. 1999a; Dolk et al. 2003; Castelli & Hubrig 2004b; Cowley et al. 2008). The presence of weak emission lines of various elements was for the first time reported by Wahlgren & Hubrig (2000). Observation-ally, these stars are characterized by low rotational veloci-ties (hv sin ii ≤ 29 km s−1, Abt et al. 1972). The fraction of these chemically peculiar stars, usually called HgMn stars, decreases with increasing rotational velocity. Evidence that stellar rotation does affect abundance anomalies in HgMn stars is provided by the rather sharp cutoff in such anomalies at a projected rotational velocity of 70–80 km s−1(Hubrig & Mathys 1996).
More than 2/3 of the HgMn stars are known to belong to spectroscopic binaries (Hubrig & Mathys 1995) with a preference of orbital periods in the range between 3 and 20 days. It is striking that the inspection of SB systems with a late B-type primary in the 9th Catalogue of Spectroscopic Binary Orbits (Pourbaix et al. 2004) indicates a strong cor-relation between the HgMn peculiarity and membership in a binary system: among bright well studied SB systems with late B-type slowly rotating (v sin i < 70 km s−1) primaries with an apparent magnitude of up toV ≈ 7 and orbital
peri-ods between 3 and 20 days, apart from HR 7241, all 21 sys-tems have a primary with a HgMn peculiarity. Based on this fact, it is very likely that the majority of slowly rotating late B-type stars formed in binary systems with certain or-bital parameters become HgMn stars, indicating that careful studies of these peculiar stars are important for the general understanding of B-type star formation in binary systems. Since a number of HgMn stars in binary systems is found at the zero-age main sequence (ZAMS) (e.g., Nordstrom & Johansen 1994; Gonz´alez et al. 2010), it is expected that the timescale for developing a HgMn peculiarity is very short.
A large number of HgMn stars belong to triple or even quadruple systems according to speckle interferome-try, diffraction-limited near-infrared imaging with NAOS-CONICA at the VLT (Cole et al. 1992; Isobe 1991; Sch ¨oller et al. 2010) and observations of X-ray emission that ap-pears to always come from a cool companion (Hubrig & Bergh ¨ofer 1998; Hubrig et al. 2001).
HgMn stars were assumed in the past not to possess magnetic fields or to exhibit spectral line variability such as commonly shown by chemically peculiar magnetic Ap and Bp stars. As more than 2/3 of the HgMn stars are known to belong to spectroscopic binaries, the variation of spec-tral lines observed in any HgMn star is usually explained to be due to the orbital motion of the companion. The as-pect of inhomogeneous distribution of some chemical ele-ments over the surface of HgMn stars was, for the first time, discussed by Hubrig & Mathys (1995). From a survey of HgMn stars in close SBs, it was suggested that some chem-ical elements might be inhomogeneously distributed on the surface, with, in particular, preferential concentration of Hg along the equator. In close SB2 systems where the orbital plane has a small inclination to the line of sight, a rather large overabundance of Hg was found. By contrast, in stars with orbits almost perpendicular to the line of sight, mer-cury is not observed at all.
The first definitively identified spectrum variability which is not caused by the companion was reported for the binary HgMn starα And by Wahlgren, Ilyin & Kochukhov
(2001) and Adelman et al. (2002). They suggested that the spectral variations of the HgIIline atλ3984 ˚A discovered in high-dispersion spectra are not due to the orbital motion of the companion, but produced by the combination of the 2.8-d period of rotation of the primary and a non-uniform surface distribution of mercury which is concentrated in the equatorial region, in good correspondence with the results
of Hubrig & Mathys (1995). The variability of the HgIIline atλ3984 ˚A was interpreted with a Doppler Imaging code revealing high-contrast mercury spots located along the ro-tational equator. Using Doppler Imaging reconstruction of spectroscopic time series obtained over seven consecutive years, Kochukhov et al. (2007) suggested the presence of a secular evolution of the mercury distribution.
Importantly, recent results (e.g., Nu ˜nez, Gonz´alez & Hubrig 2011) show that line profile variability is a general characteristic of HgMn stars, rather than an exception. This variability is caused by an inhomogeneous chemical ele-ment distribution, and implies that most HgMn stars present a non-uniform distribution of one or more chemical ele-ments.
2 Spectroscopic variability as a general
characteristics of HgMn stars
As a result of our extensive spectroscopic studies in the last years, we could establish that chemical inhomogeneities are widespread among B7–B9 HgMn primaries of spectro-scopic binaries and that previous failures to detect them were largely related to a small number of repeated observa-tions of the same targets and traditional focus on the sharp-lined stars, for which the spectrum variations are much harder to detect. High-quality spectra of a representative sample of HgMn stars were obtained with UVES (Ultra-violet and Visual Echelle Spectrograph) at the VLT and the Fiberfed Extended Range Optical Spectrograph (FEROS) at the ESO 2.2-m telescope within the framework of our ESO programs aimed at a careful study of line profile variations of various elements. In Fig. 1 we present numerous exam-ples of the variability of various spectral lines belonging to different elements in HgMn stars.
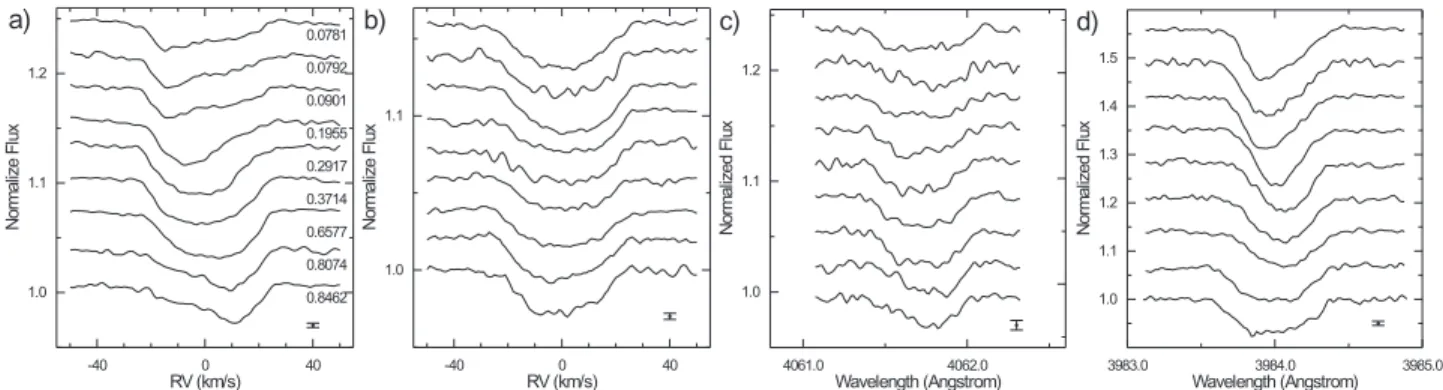
Using nine high signal-to-noise high-resolution UVES spectroscopic observations of the eclipsing SB2 HgMn binary star AR Aur it was soon demonstrated that the spots ofα And are not unique (Hubrig et al. 2006a). The
zero-age main-sequence (ZAMS) eclipsing binary AR Aur (HD 34364, B9V+B9.5V) with an orbital period of 4.13 d at an age of only4×106years belongs to the Aur OB1 as-sociation (Nordstrom & Johansen 1994) and presents the best case for a study of evolutionary aspects of the chemi-cal peculiarity phenomenon. The problem of analysing the component spectra in double-lined spectroscopic binaries is difficult, but, fortunately, in the past few years several tech-niques for spectral disentangling have been developed. For each observed phase we applied the procedure of decompo-sition described in detail by Gonz´alez & Levato (2006). In Fig. 2, we show the behavior of the line profiles of a few el-ements over the rotation period. We found that ZrII, NdIII, PtII, and HeIlines appear rather weak, but still their vari-ations are definite. Interestingly, while the behavior of the line profiles of YII, PtII, HgII, SrII, and NdIII is rather similar over the rotation period, the line profiles of ZrIIand HeIseem to vary with a 180◦phase shift.
Fig. 1 (online colour at: www.an-journal.org) Examples of line profile variability in various HgMn stars. In each plot the middle panel has the same scale as the lower panel. The curves in the upper panels present a smoothing of the residual points using convolution with a Gaussian ofσ = 2.05 pixels.
Fig. 2 Variations of line profiles in spectra of the zero-age main-sequence eclipsing binary AR Aur phased with the rotation periodP = 4.13 days: a) YII, b) ZrII, c) PtIIλ 4061.7 ˚A, d) HgIIλ 3983.9 ˚A. The rotational phase increases from top to bottom – see a). Error bars in the lower corner on the right side indicate the standard error of the line profiles. The spectra are shifted in vertical direction for display purposes.
First Doppler maps for the elements Mn, Sr, Y, and Hg using nine spectra of AR Aur observed with the UVES spec-trograph in 2005 were for the first time presented at the IAU Symposium 259 by Savanov et al. (2009). In the most re-cent analysis of this system (Hubrig et al. 2010) based on the spectra obtained with the Coud´e Spectrograph of the 2.0-m telescope of the Th ¨uringer Landessternwarte (TLS; Oct. 2008–Feb. 2009) and the SES spectrograph of the 1.2-m STELLA-I robotic telescope at the Teide Observatory (Nov.–Dec. 2008), we used the improved Doppler imaging code IA introduced by Freyhammer et al. (2009). This code uses Tikhonov regularization in a way similar to the Doppler Imaging (DI) method described by Piskunov (2008) with a grid of 6◦×6◦. In the DI reconstruction, we search for the minimum of the regularized discrepancy function, which in-cludes the regularization function and the discrepancy func-tion describing the difference between observed and calcu-lated line profiles. For the Doppler Imaging reconstruction, we selected the elements Fe and Y with the clean unblended spectral lines FeII4923.9 ˚A and YII4900.1 ˚A, and show-ing distinct variability over the rotation period. The results of the reconstruction using UVES spectra (SET1) and most recent spectra obtained with smaller telescopes (SET2) are presented in Figs. 3 and 4, respectively.
The inspection of the resulting Fe and Y distribution maps separated by four years shows that Fe is overabundant by up to +1.5 dex and Y is overabundant by up to +3.9 dex in several spots. The positions and the shape of the spots with the highest Fe overabundance slightly changed from 2005 to 2009, and the level of the Fe overabundance shows a significant increase, especially in the spot located close to the equator at the phases 0.50–0.75 and in the polar spot at the phases 0.75–0.83. In the Y maps, the evolution of over-abundance, shape, and position of the spots appears much more remarkable, revealing a region of huge overabundance having a shape of a belt, which is broken around phase 0. In-triguingly, in this phase we observe the hemisphere which is permanently facing the secondary. Such a behavior is likely
observed also for Sr in the UVES spectra and was discussed in our previous study (Hubrig et al. 2006a).
For one SB1 system with a well pronounced variabil-ity, the HgMn star HD 11753, it was possible to gather a large number of spectra with the CORALIE ´echelle spec-trograph attached to the 1.2-m Leonard Euler telescope on La Silla in Chile (Briquet et al. 2010). In total, we obtained 113 spectra at a spectral resolution of 50 000. The radial ve-locities and equivalent widths were found to vary with the periodP = 9.54 d. We used Doppler imaging technique to
reconstruct surface distribution of Ti, Sr, and Y. Ti and Y have numerous transitions in the observed optical spectral region allowing us to select unblended spectral lines with not too different line formation depths. The relevance of ver-tical abundance stratification in HgMn stars was previously discussed by Savanov & Hubrig (2003).
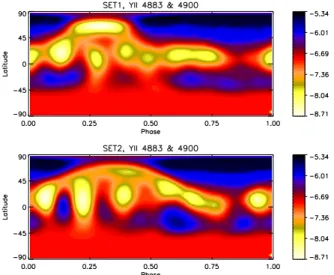
The two sets of observations of HD 11753 obtained in 2000 September 28 – October 11 (SET1) and in 2000 De-cember 02 – 15 (SET2) consist of 76 and 28 observations, respectively, evenly spread over the stellar rotation cycle. Surprisingly, results of Doppler imaging reconstruction re-vealed noticeable changes in the surface distributions of TiII, SrII, and YIIbetween the datasets separated by just 65 days, indicating the presence of the hitherto not well un-derstood physical processes in stars with radiative envelopes causing rather fast dynamical chemical spot evolution, not of the order of years, but rather months. We assume here that the features are real, and not an artifact of the method-ology. All Ti, Sr, and Y abundance maps reveal a structure reminiscent of broken rings of low and high abundance. As an example, the maps obtained from YIIlines 4883 ˚A and 4900 ˚A are presented in Fig. 5. The maps show broken abun-dance rings with the high abunabun-dance region extending from the latitude45◦ to the pole. The Y abundance distribution shows high latitude lower abundance spot around phases 0.2–0.4, similarly to the Ti abundance maps. The equatorial region is dominated by a belt of lower abundance spots, and the regions below the equator by high abundance features. The average abundance of the Y maps is−6.77, which is
phase=0.00
phase=0.25
phase=0.50
phase=0.75
-5.5 -4.9 -4.3 -3.6 -3.0phase=0.00
phase=0.25
phase=0.50
phase=0.75
Fig. 3 (online colour at: www.an-journal.org) The Fe abundance map of AR Aur obtained from the FeII4923.9 ˚A line for SET1 (left) and SET2 (right).
phase=0.00
phase=0.25
phase=0.50
phase=0.75
-8.5 -7.9 -7.3 -6.6 -6.0phase=0.00
phase=0.25
phase=0.50
phase=0.75
Fig. 4 (online colour at: www.an-journal.org) The Y abundance map of AR Aur obtained from the YII4900.1 ˚A line for SET1 (left) and SET2 (right).
significantly higher than the solar abundance of−9.80. We
note that all the features revealed in the maps show abun-dances that are higher than the solar abundance of Y. Simi-lar to the Ti maps, we observe in the Y maps that the lower abundance high latitude feature at phases 0.2–0.4 becomes much less prominent in SET2.
The abundance maps of HD 11753 presented in the work by Briquet et al. (2010) exhibit clear differences be-tween the surface abundance distribution of Ti, Sr, and Y.
We also detect distinct differences in the spot configurations obtained from the same lines for different data sets, indi-cating a rather fast dynamical evolution of the abundance distribution with time. Different dynamical processes take place in stellar radiation zones. An interaction between the differential rotation, the magnetic field, and the meridional circulation could possibly play a role in the generation of dynamical evolution of chemical spots. From the compari-son of maps we find that it is possible that the Y
distribu-Fig. 5 (online colour at: www.an-journal.org) The Y abundance map of HD 11753 obtained for SET1 (upper panel) and SET2 (lower panel). The color indicates the abundance with respect to the total number density of atoms and ions.
tion shows indications of increasing rotation rate towards the rotation pole, so-called differential rotation of anti-solar type. On the other hand, these results are not sufficient to claim the presence of a surface differential rotation and fur-ther analyses of the elemental surface distribution in a larger sample of HgMn stars should be carried out before the im-plication of these new results can be discussed in more de-tail.
3 Magnetic fields of HgMn stars
Based on spectropolarimetric studies carried out during more than a dozen of years, it now became clear that weak magnetic fields do exist in a number of HgMn stars (Hubrig et al. 2008, and references therein). The most widespread method to detect a magnetic field is to obtain polarimet-ric spectra recorded in left- and right-hand polarized light to measure the mean longitudinal magnetic field. Another approach to study the presence of magnetic fields in upper main sequence stars is to determine the value of the mean quadratic magnetic field,
hBqi = (hB2i + hBz2i)1/2,
which is derived through the application of the moment technique, described by, e.g., Mathys & Hubrig (2006). HerehB2i is the mean square magnetic field modulus (the average over the stellar disc of the square of the modulus of the field vector, weighted by the local emergent line in-tensity), whilehB2
zi is the mean square longitudinal field (the average over the stellar disc of the square of the line-of-sight component of the magnetic vector, weighted by the local emergent line intensity).
The mean quadratic magnetic field is determined from the study of the second-order moments of the line profiles
recorded in unpolarized light (that is, in the Stokes param-eter I). The second-order moment R(2)I (λI) of a spectral line profile recorded in unpolarized light about its center of gravityλI is defined as
R(2)I (λI) = 1
Wλ
Z
rFI(λ)(λ − λI)2dλ.
The integration runs over the whole width of the observed line (see Mathys 1988 for details).Wλis the line equivalent width;rFIis the line profile:
rFI = 1 − (FI/FIc).
FI(resp.FIc) is the integral over the visible stellar disk
of the emergent intensity in the line (resp. in the neighboring continuum). The analysis is usually based on consideration of samples of reasonably unblended lines of FeIand FeII. Using this method, Mathys & Hubrig (1995) could demon-strate the presence of quadratic magnetic fields in two close double-lined systems with HgMn primary stars, 74 Aqr and
χ Lup.
Another method which can be applied to study magnetic fields in HgMn stars employs the relative magnetic intensi-fication of the two FeIIlines of multiplet 74,λ 6147.7 and λ 6149.2 ˚A, which have the same equivalent width to within 2.5 % in non-magnetic late B and A-type stars, but very different Zeeman patterns (Lanz & Mathys 1993; Hubrig et al. 1999b; Hubrig & Castelli 2001). The observed dis-crepancy between the equivalent widths of these two lines in magnetic stars is attributed to magnetic intensification. As the relative intensification is roughly correlated with the strength of the magnetic field, it is a powerful tool for de-tecting magnetic fields which have a complex structure and are difficult to analyze by polarization measurements. For a few HgMn stars, Hubrig & Castelli (2001) showed evi-dence for a relative magnetic intensification of FeIIlines of multiplet 74, produced by different magnetic desaturations induced by different Zeeman-split components.
A previous survey of magnetic fields in 17 HgMn stars (Hubrig et al. 2006b) using low-resolution (R = 2000)
cir-cular polarization spectra obtained with FORS 1 at the VLT led to field detections in only four stars. This small sample of HgMn stars also included the spectrum variable HgMn starα And, for which a magnetic field of the order of a few
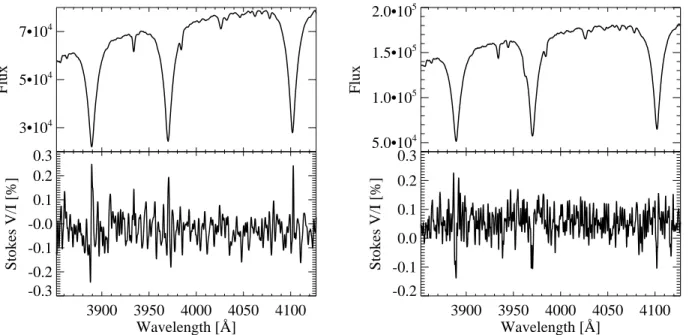
hundred Gauss was detected. The HgMn star HD 65949, for which a magnetic field was detected with FORS 1 in 2006, was followed-up by additional FORS 1/2 observations in 2007 and in 2011. We were able to confirm the presence of the field withhBzi = −116 ± 32 G measured in 2007, andhBzi = −182 ± 34 G measured in 2011 (Hubrig et al., in preparation). It is of interest that the spectrum of this star reveals the extremely large overabundance of Hg, Pt, Os, and especially Re (Cowley et al. 2010). In Fig. 6 we present the most recent FORS 1/2 StokesI and Stokes V spectra of
HD 65949.
To further pinpoint the mechanism responsible for the surface structure formation in HgMn stars, we recently ob-tained spectropolarimetric observations of AR Aur and
in-3•104 5•104 7•104 Flux 3900 3950 4000 4050 4100 Wavelength [A] -0.3 -0.2 -0.1 -0.0 0.1 0.2 0.3 Stokes V/I [%] ˚ 5.0•104 1.0•105 1.5•105 2.0•105 Flux 3900 3950 4000 4050 4100 Wavelength [A] -0.2 -0.1 0.0 0.1 0.2 0.3 Stokes V/I [%] ˚
Fig. 6 FORS1/2 observations of StokesI and Stokes V spectra of the HgMn star HD 65949. The left panel corresponds
to the data obtained in 2007, while the right panel to the data from 2011. Distinct Zeeman features appear at the position of hydrogen lines H8, Hǫ, and Hδ.
vestigated the presence of a magnetic field during a rota-tional phase of very good visibility of the spots with over-abundant elements (Hubrig et al. 2010). Since most ele-ments are expected to be inhomogeneously distributed over the surface of the primary of AR Aur, magnetic field mea-surements were carried out for samples of Ti, Cr, Fe, and Y lines separately. Among the elements showing line variabil-ity, the selected elements have numerous transitions in the observed optical spectral region, allowing us to sort out the best samples of clean unblended spectral lines with differ-ent Land´e factors. A longitudinal magnetic field at a level higher than 3σ of the order of a few hundred Gauss is
de-tected in FeII, TiII, and YIIlines, while a quadratic mag-netic field hBi = 8284 ± 1501 G at 5.5σ level was
mea-sured in TiIIlines. No crossover at 3σ confidence level was
detected for the elements studied. Further, we detect a weak longitudinal magnetic field,hBzi = −229 ± 56 G, in the secondary component using a sample of nine FeIIlines.
The diagnosis of the quadratic field is more difficult than that of the longitudinal magnetic field, and it depends much more critically on the number of lines that can be employed. Interestingly, the detection of a kG quadratic magnetic field in the primary and of a weak longitudinal magnetic field in the primary and the secondary of AR Aur is in accordance with results of Mathys & Hubrig (1995) who reported the detection of a weak magnetic field in the secondary of an-other SB2 binary,χ Lup, while in the same work they
dis-covered a quadratic magnetic field of 3.6 kG in the primary component of 74 Aqr. The secondaries in both, the AR Aur andχ Lup, systems, are mentioned in the literature to have
characteristics very similar to early Am stars.
The only longitudinal magnetic field measurements car-ried out for AR Aur were reported recently by Folsom et al. (2010), who used the LSD (Least-Squares Deconvolution) technique to combine 1168 lines of various elements. No magnetic field was detected in their analysis of polarimet-ric spectra obtained in 2006. One possibility for this non-detection could be related to an unfavorable element spot configuration or even to the absence of some element spots at the epoch of their observations, since the authors report that no variability of the Ti and Fe lines was detected. It is of interest that strong Fe and Y element concentrations are almost missing in our first map based on SET1 observations in 2005, which are the closest in time to the observations reported by Folsom et al. New spectropolarimetric obser-vations of AR Aur were recently obtained with the SOFIN spectropolarimeter installed at the 2.56-m Nordic Optical Telescope on La Palma. The current element distribution ap-pears somewhat different compared to our previous Doppler maps and the measured magnetic field is much weaker than that reported by us in 2010 (Hubrig et al., in preparation). Clearly, an extensive spectropolarimetric monitoring over several years is urgently needed to understand the puzzle of the dynamical evolution of chemical spots on the surface of these stars and the underlying structure of their magnetic fields.
Recently, Makaganiuk et al. (2011a) reported their study of magnetic fields in HgMn stars using a polarimeter at-tached to the HARPS spectrograph at the ESO 3.6-m tele-scope. The authors used LSD profiles calculated for several hundreds of spectral lines. No detections at 3σ level were
reported for HgMn stars. Strangely enough, although the authors were aware of the possible inhomogeneous
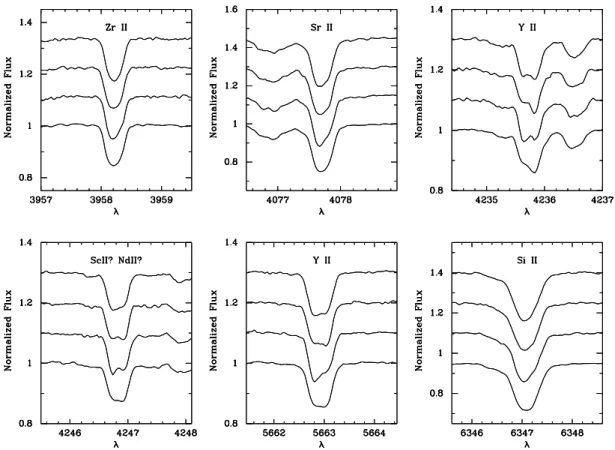
distri-Fig. 7 Various degrees of variability of line profiles in the spectra of HD 101189 obtained with FEROS on four different nights. For convenience, individual spectra are shifted in vertical direction.
bution of elements on the surface of HgMn stars, no Zee-man signature analysis was done on inhomogeneously dis-tributed elements separately. Since a kind of symmetry be-tween the topology of magnetic fields and the element dis-tribution is expected, the method of using all element spec-tral lines together is not advisable and leads to doubtful re-sults. Furthermore, their technique does not allow to mea-sure other moments of the magnetic field.
On the other hand, our own spectropolarimetric obser-vations indicate that not every HgMn star possesses a mag-netic field. As an example, the HgMn star HD 71066 was observed by our team and by other groups, but no field was detected in any study (Hubrig et al. 1999b, 2006b; Maka-ganiuk et al. 2011b). Still, we do not know yet whether the magnetic field is variable on secular time scales, as it ap-pears to be the case for AR Aur.
To make ourselves familiar with HARPS polarimetric spectra, we downloaded from the ESO archive in spring 2011 the Makaganiuk et al. publically available obser-vations of the classical Ap star γ Equ and of the
typi-cal variable HgMn star HD 101189. The single-lined star HD 101189 was already studied by us in the past with ESO instruments. As an example of the variability of HD 101189, we present in Fig. 7 four spectra acquired on four different
nights with FEROS on La Silla, where spectral lines of sev-eral elements exhibit various degrees of variability.
The details on the downloaded observations are listed in Table 1. Obviously, the quality of the spectra of HD 101189 is especially poor with achieved signal-to-noise ratios (S/N) between 12 and 52. The data were reduced using the ESO HARPS pipeline. For theγ Equ spectropolarimetric
obser-vations, which are usually used to test the functionality of spectropolarimeters, the magnetic field measurements using the moment technique yieldhBzi = −904 ± 68 G and for the null spectrumhBzi = −3 ± 15 G. The obtained longi-tudinal magnetic field fully agrees with the results of the FORS 1 measurements by Hubrig et al. (2004).
On the other hand, the measurements of the spectra of HD 101189 deliver the same magnetic field (of the order of
−200 G) for both the regular science Stokes V observations
and the null spectrum. As shown in Fig. 8, the reason for this is that the spectrum with the best S/N ratio (52 in this case) significantly contributes to the null spectrum. This re-sult implies that if the observations are carried out with low S/N, and, in addition, if the difference in S/N in the sub-exposures is large, the magnetic field cannot be measured conclusively. The field can be measured rather accurately, but there is no use in the null spectrum to prove whether or not the detected field is real. Makaganiuk et al. (2011b) re-port a non-detection withhBzi = −95 ± 66 G calculating
Table 1 HARPS observations.
Target Date Mod. Jul. Date Signal-to-Noise Numb.. of Spectra
γEqu 01-06-2009 54 983.3703 97–216 4 HD 101189 31-05-2009 54 982.9744 12–52 4 4591.0 4591.5 4592.0 4592.5 4593.0 Wavelength [A] -4 -2 0 2 4 Stokes V/I [%] ˚
Fig. 8 HARPS observations of HD 101189. Stokes V
spectrum (solid line) and null spectrum (dashed line) are overplotted.
the LSD profile for the same spectrum. As in the meantime additional HARPS spectra of HgMn stars became publically available, we plan their investigation in the near future.
4 Conclusions
Most stars in the studied sample of HgMn stars present a non-uniform distribution of several chemical elements. However, for only three stars the surface element distribu-tion and its evoludistribu-tion over different time scales have been studied until now. It is presently a fundamental question whether magnetic fields play a significant role in the de-velopment of abundance anomalies in HgMn stars, which are frequently members of binary and multiple systems. An-swering this question is also important for the understanding of the processes taking place during the formation and evo-lution of B stars in multiple systems in general. A scenario describing how a magnetic field can be built up in binary systems was presented some time ago by Hubrig (1998) who suggested that a tidal torque varying with depth and lat-itude in a star induces differential rotation. Differential ro-tation in a radiative star can be prone to magneto-roro-tational instability (MRI).
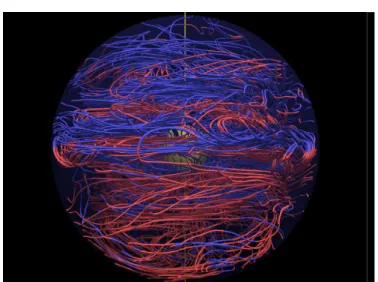
Magnetohydrodynamical simulations by Arlt, Holler-bach & R¨udiger (2003) revealed a distinct structure for the magnetic field topology similar to the fractured
elemen-Fig. 9 (online colour at: www.an-journal.org) Magneto-hydrodynamical simulations reveal a distinct magnetic field topology, which is similar to the fractured elemental rings observed on the surface of HgMn stars.
tal rings observed on the surface of HgMn stars. The ini-tial model differenini-tial rotation was hydrodynamically stable (Taylor-Proudman flow), but the introduction of a magnetic field excites the MRI on a very short time-scale compared to the time-scale of microscopic magnetic diffusion. Although fields are not very strong, complex surface patterns can be obtained from the nonlinear, nonaxisymmetric evolution of the MRI as shown in Fig. 9. New simulations of the MRI in stellar radiation zones are currently being performed and will deliver more details in the near future. The aim of the future research projects is to search for a link between the magnetic nature and fundamental properties of a represen-tative sample of spectroscopic binaries with late B-type pri-maries using spectroscopic and spectropolarimetric obser-vations and the Magnetic Doppler Imaging technique.
References
Abt, H.A., Chaffee, F.H., Suffolk, G.: 1972, ApJ 175, 779 Adelman, S.J., Gulliver, A.F., Kochukhov, O.P., Ryabchikova,
T.A.: 2002, A&A 390, 1023
Arlt, R., Hollerbach, R., R¨udiger, G.: 2003, A&A 401, 1087 Briquet, M., Korhonen, H., Gonz´alez, J.F., et al.: 2010, A&A 511,
A71
Castelli, F., Hubrig, S.: 2004a, A&A 425, 263 Castelli, F., Hubrig, S.: 2004b, A&A 421, L1
Cole, W.A., Fekel, F.C., Hartkopf, W.I., et al.: 1992, AJ 103, 1357 Cowley, C.R., Hubrig, S, Castelli, F., et al.: 2008, in: N.C. Santos, L. Pasquini, A.C.M. Correia, M. Romaniello (eds.), Precision
Spectroscopy in Astrophysics, p. 269
Cowley, C.R., Hubrig, S., Palmeri, P., et al.: 2010, MNRAS 405, 1271
Dolk, L., Wahlgren, G.M., Hubrig, S.: 2003, A&A 402, 299 Duquennoy, A., Mayor, M.: 1991, A&A 248, 485
Folsom, C.P., Kochukhov, O., Wade, G.A., et al.: 2010, MNRAS 407, 2383
Freyhammer, L.M., Kurtz, D.W., Elkin, V.G., et al.: 2009, MNRAS 396, 325
Gonz´alez, J.F., Levato, H.: 2006, A&AS 448, 283
Gonz´alez, J.F., Hubrig, S., Castelli, F.: 2010, MNRAS 402, 2539 Hubrig, S.: 1998, Contributions of the Astronomical Observatory
Skalnate Pleso 27, 296
Hubrig, S., Mathys, G.: 1995, Comments in Astrophys. 18, 167 Hubrig, S., Mathys, G.: 1996, A&AS 120, 457
Hubrig, S., Bergh¨ofer, T.W.: 1998, in: K. Koyama, S. Kitamoto, M. Itoh (eds.), The Hot Universe, IAU Symp. 188, p. 217 Hubrig, S., Castelli, F.: 2001, A&A 375, 963
Hubrig, S., Castelli, F., Mathys, G.: 1999a, A&A 341, 190 Hubrig, S., Castelli, F., Wahlgren, G.M.: 1999b, A&A 346, 139 Hubrig, S., Le Mignant, D., North, P., Krautter, J.: 2001, A&A
372, 152
Hubrig, S., Kurtz, D.W., Bagnulo, S., et al.: 2004, A&A 415, 661 Hubrig, S., Gonz´alez, J.F., Savanov, I.: 2006a, MNRAS 371, 1953 Hubrig, S., North, P., Sch¨oller, M., Mathys, G.: 2006b, AN 327,
289
Hubrig, S., Gonz´alez, J.F., Arlt, R.: 2008, Contributions of the As-tronomical Observatory Skalnate Pleso 38, 415
Hubrig, S., Savanov, I., Ilyin, I., et al.: 2010, MNRAS 408, L61 Isobe, S.: 1991, Astronomical Society of Australia 9, 270 Kobulnicky, H.A., Fryer, C.: 2007, BAAS 39, 726
Kochukhov, O., Adelman, S.J., Gulliver, A.F., Piskunov, N.: 2007, Nature Phys. 3, 526
Lanz, T., Mathys, G.: 1993, A&A 280, 486
Makaganiuk, V., Kochukhov, O., Piskunov, N., et al.: 2011a, in: C. Neiner, G. Wade, G. Meynet, G. Peters (eds.), Active OB Stars: Structure, Evolution, Mass Loss, and Critical Limits, IAU Symp. 272, p. 202
Makaganiuk, V., Kochukhov, O., Piskunov, N., et al.: 2011b, A&A 525, A97
Mathys, G.: 1988, A&A 189, 179
Mathys, G., Hubrig, S.: 1995, A&A 293, 810 Mathys, G., Hubrig, S.: 2006, A&A 453, 699 Nordstrom, B., Johansen, K.T.: 1994, A&A 291, 777
Nu˜nez, N.E., Gonz´alez, J.F., Hubrig, S.: 2011, in: D.O. Kudryavt-sev, I.I. Romanyuk (eds.), Magnetic Stars, p. 361
Piskunov, N.: 2008, Phys. Scr. 133, 014017
Pourbaix, D., Tokovinin, A.A., Batten, A.H., et al.: 2004, A&A 424, 727
Savanov, I. S., Hubrig, S.: 2003, A&A 410, 299
Savanov, I.S., Hubrig, S., Gonz´alez, J.F., Sch¨oller, M.: 2009, in: K.G. Strassmeier, A.G. Kosovichev, J.E. Beckman (eds.), Cos-mic Magnetic Fields: From Planets, to Stars and Galaxies, IAU Symp. 259, p. 401
Sch¨oller, M., Correia, S., Hubrig, S., Ageorges, N.: 2010, A&A 522, A85
Tokovinin, A.A., Smekhov, M.G.: 2002, A&A 382, 118 Wahlgren, G.M., Hubrig, S.: 2000, A&A 362, L13