New Phytologist Supporting Information
Article title: Admixture mapping in interspecific Populus hybrids identifies classes of genomic architectures for phytochemical, morphological and growth traits
Authors: Luisa Bresadola, Céline Caseys, Stefano Castiglione, C. Alex Buerkle*, Daniel Wegmann*, Christian Lexer*
* joint senior authors
Article acceptance date: 06 May 2019
The following Supporting Information is available for this article:
Fig. S1 Posterior inclusion probabilities in genomic windows of different size Fig. S2 Kinship matrix calculated by GEMMA
Fig. S3 Local ancestries for all analyzed seedlings
Fig. S4 Admixture linkage disequilibrium in all chromosomes
Fig. S5 Decay of admixture linkage disequilibrium along all chromosomes
Fig. S6 Levels of phenotypic differentiation between P. tremula, hybrids and P. alba for all
traits
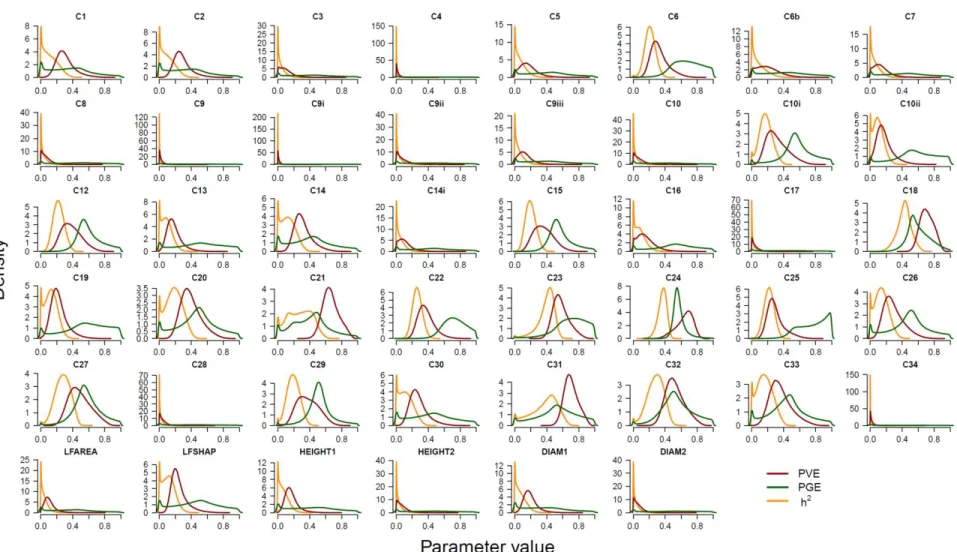
Fig. S7 Relationship between genome-wide ancestry and phenotype for all traits Fig. S8 Posterior distributions ofPVE, PGE and heritability for all phenotypic traits Table S1 Number of seedlings per family and common garden location
Table S2 Phenotypic data used in this admixture mapping GWAS study
Table S3 Probabilities from posterior distributions of heritability, PVE, PGE and n_gamma Table S4 Candidate genes in genomic windows with high posterior inclusion probability Methods S1RAD-seq data processing, reference-mapping and variant calling
Methods S2 Inference of local and genome-wide ancestry
Methods S3 Rationale for choice of plant traits measured in this study
Methods S4 Admixture mapping with GEMMA: model choice and validation
Notes S1Genomic windows highlighted by alternative modeling approaches in GEMMA Notes S2 Additional information on candidate genes
Fig. S1. Posterior Inclusion Probabilities (PIP) summed within windows of 0.5 Mb (a), 1 Mb
Fig. S2. Centered kinship matrix calculated by GEMMA. Each square represents the
relatedness between a pair of individuals for inferred ancestry states. Color shades represent the deviation of the relatedness between a pair of individuals from the mean relatedness value. Labels indicate name of the seedling families and their location corresponds to the first individual of the family.
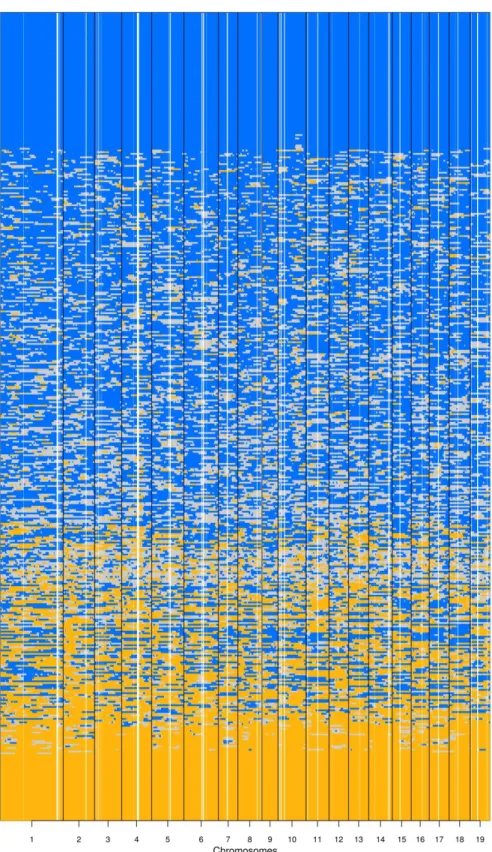
Fig. S3. Summary of local ancestries along the chromosomes (x axis) of 472 common garden
seedlings, ordered along the y axis according to their genome-wide ancestry (each row is an individual). Blue represents chromosomal segments with P. alba ancestry, grey indicates hetero-specific ancestry, orange P. tremula ancestry. Darker color shades indicate more confidence in the local ancestry estimate.
Fig. S4. Admixture linkage disequilibrium (LD) in all chromosomes, calculated as pairwise squared correlation between averaged
Fig. S5. Decay of admixture LD with physical distance shown for all chromosomes. N sites represents the number of markers
Fig. S6. Levels of differentiation between P. tremula (T), hybrids (H) and P. alba (A) for all traits analyzed in this study. Boxes
represent the first and third quartiles, whiskers extend to the lowest and highest data points within 1.5 x IQR (interquartile range) from the first and third quartile, respectively.
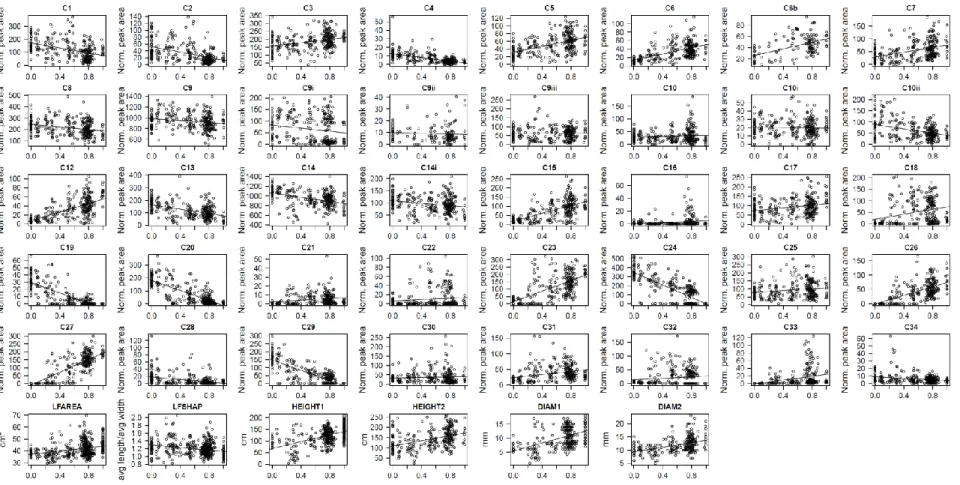
Fig. S7. Relationship between genome-wide ancestry (q) and the phenotypic traits. P. tremula-like individuals are on the left, where q
<0.05, while P. alba-like individuals are on the right, where q >0.95. Hybrid seedlings exhibit intermediate values of q. Linear
regression lines are shown as visual guides only and are not intended to suggest that a linear regression function represents the best fit to the data.
Table S1. Overview of common garden seedling families, ordered by planting year. The number of individuals per family per
common garden location is reported for each phenotypic trait analyzed in the study. y = planting year, cg = common garden location (FR = Fribourg and SA = Salerno).
Family y cg Phenotypic traits
C1, C2, C3, C4, C5, C6, C7, C8, C9, C9i, C9iii, C10, C10i, C10ii, C12, C13, C14, C14i, C15, C16,
C17, C18, C19, C20, C21, C22, C23, C24, C25, C26, C27, C28, C29, C30, C31, C32, C33, C34
C6b, C9ii
LFAREA,
LFSHAP HEIGHT1 DIAM1
HEIGHT2, DIAM2 F011 2010 FR - - 6 6 6 - F018 2010 FR - - 28 28 28 - F008 2011 FR 17 17 17 17 17 17 SA 8 - 8 - - 8 F009 2011 FR 13 13 13 13 13 13 SA 7 - 7 - - 7 F020 2011 FR 7 7 7 7 7 6 F021 2011 FR 7 7 7 7 7 5 SA 10 - 10 - - 10 F022 2011 FR 7 7 7 7 7 7 SA 9 - 9 - - 9 F026 2011 FR 16 16 16 16 16 16 SA 9 - 9 - - 9 F030 2011 FR 7 7 7 7 7 7 SA 10 - 10 - - 10 F031 2011 FR 7 7 7 7 7 6 SA 9 - 6 - - 9 F032 2011 FR 13 13 13 13 13 12 SA 6 - 6 - - 6
F033 2011 FR 7 7 7 7 7 7 SA 10 - 10 - - 10 F036 2011 FR 5 5 5 5 5 3 SA 10 - 10 - - 10 F039 2011 FR 7 7 7 7 7 7 SA 4 - 4 - - 4 I345 2011 FR 7 7 7 7 7 7 SA 14 - 11 - - 13 I373 2011 FR 7 7 7 7 7 7 SA 9 - 9 - - 9 I396 2011 FR 6 6 6 6 6 6 SA 8 - 6 - - 8 I397 2011 SA 10 - 8 - - 10 F054 2014 FR - - 2 2 2 - F057 2014 FR - - 13 13 13 - F059 2014 FR - - 34 33 34 - F062 2014 FR - - 1 1 1 - F063 2014 FR - - 3 3 3 - F064 2014 FR - - 1 1 1 - F066 2014 FR - - 5 5 6 - F067 2014 FR - - 4 4 4 - F068 2014 FR - - 7 7 7 - F069 2014 FR - - 6 6 6 - F071 2014 FR - - 4 4 4 - F072 2014 FR - - 1 1 1 - F073 2014 FR - - 7 7 7 - F074 2014 FR - - 6 6 6 - F075 2014 FR - - 1 1 1 - F076 2014 FR - - 2 2 2 - F077 2014 FR - - 13 13 13 -
F078 2014 FR - - 14 14 14 -
F079 2014 FR - - 12 12 12 -
F080 2014 FR - - 13 13 13 -
F083 2014 FR - - 6 6 6 -
Table S2. Phenotypic data used in this admixture mapping GWAS study (enclosed as a separate
spreadsheet dataset).
Table S3. Probabilities from posterior distributions for the parameters heritability (h2), PVE,
PGE and n_gamma. Probabilities are rounded to the fourth decimal. Traits marked with a star
satisfied the requirements explained in Materials and Methods and their genomic windows with Posterior Inclusion Probability (PIP) ≥0.4 were searched for candidate genes. An additional trait (C19) was added to the list of focal traits (see Results and Table 2 for details).
Traits Probabilities
h2<0.01 h2<0.05 PVE<0.01 PVE<0.05 PGE<0.01 PGE<0.05 n_gamma>0
C1 0.1165 0.2993 0.0001 0.0010 0.0709 0.1237 0.9505 C2 0.1256 0.3250 0 0.0009 0.0748 0.1307 0.9481 C3 0.2955 0.6628 0.0667 0.2870 0.0881 0.1337 0.9311 C4 0.6645 0.9601 0.3662 0.8568 0.1179 0.1652 0.9024 C5 0.1806 0.4679 0.0210 0.1094 0.0690 0.1124 0.9485 C6* 0.0029 0.0097 0 0.0001 0.0016 0.0031 0.9989 C6b 0.1847 0.4350 0.0277 0.1240 0.0725 0.1175 0.9463 C7 0.2113 0.5249 0.0355 0.1746 0.0699 0.1101 0.9466 C8 0.3514 0.7254 0.1184 0.4513 0.0833 0.1208 0.9330 C9 0.6319 0.9424 0.3403 0.8222 0.1090 0.1547 0.9103 C9i 0.7555 0.9825 0.4752 0.9252 0.1410 0.1902 0.8811 C9ii 0.3707 0.7261 0.1179 0.4310 0.0942 0.1402 0.9256 C9iii 0.2332 0.5843 0.0251 0.1600 0.0838 0.1326 0.9364 C10 0.3808 0.7631 0.1173 0.4332 0.0984 0.1443 0.9215 C10i* 0.0169 0.0569 0.0001 0.0012 0.0094 0.0166 0.9934 C10ii 0.0775 0.2479 0.0083 0.0621 0.0274 0.0432 0.9793 C12* 0.0003 0.0021 0 0 0.0002 0.0004 0.9998 C13 0.1031 0.3065 0.0022 0.0285 0.0472 0.0777 0.9659 C14 0.0832 0.2214 0 0.0002 0.0514 0.0915 0.9647 C14i 0.2460 0.5948 0.0467 0.2441 0.0736 0.1128 0.9429 C15* 0.0007 0.0050 0 0.0001 0.0004 0.0008 0.9997 C16 0.1460 0.3750 0.0357 0.1545 0.0427 0.0653 0.9668 C17 0.4761 0.8490 0.1955 0.6168 0.1019 0.1458 0.9168
C18* 0.0001 0.0001 0 0 0 0.0001 1.0000 C19** 0.0652 0.1921 0.0011 0.0127 0.0313 0.0521 0.9772 C20* 0.0464 0.1211 0 0 0.0313 0.0566 0.9786 C21* 0.0344 0.0773 0 0 0.0294 0.0557 0.9808 C22* 0.0001 0.0003 0 0 0.0001 0.0001 1.0000 C23* 0.0046 0.0110 0 0 0.0037 0.0074 0.9976 C24* 0 0 0 0 0 0 1.0000 C25* 0.0009 0.0044 0 0.0001 0.0010 0.0009 0.9996 C26 0.0552 0.1610 0.0002 0.0028 0.0310 0.0533 0.9781 C27* 0.0048 0.0128 0 0 0.0035 0.0063 0.9977 C28 0.4736 0.8668 0.1772 0.6132 0.1041 0.1495 0.9157 C29* 0.0091 0.0318 0 0.0002 0.0055 0.0095 0.9962 C30 0.0856 0.2418 0.0001 0.0019 0.0481 0.0860 0.9666 C31* 0.0226 0.0499 0 0 0.0197 0.0378 0.9871 C32* 0.0087 0.0211 0 0 0.0067 0.0120 0.9953 C33* 0.0474 0.1359 0.0001 0.0009 0.0285 0.0512 0.9801 C34 0.6678 0.9510 0.3850 0.8518 0.1186 0.1644 0.9012 DIAM1 0.1590 0.4313 0.0005 0.0119 0.0799 0.1345 0.9427 DIAM2 0.3488 0.7289 0.1228 0.4721 0.0779 0.1138 0.9376 HEIGHT1 0.1483 0.4266 0.0013 0.0275 0.0673 0.1130 0.9517 HEIGHT2 0.3485 0.7354 0.1043 0.4230 0.0839 0.1261 0.9337 LFAREA 0.2431 0.6442 0.0174 0.1712 0.0845 0.1323 0.9352 LFSHAP 0.0852 0.2400 0 0.0006 0.0475 0.0804 0.9658
Table S4. Candidate genes identified in the genomic windows with Posterior Inclusion Probability (PIP) ≥0.4.
Genes Chromosome Start Pos. End Pos. Traits Category
Arabidopsis thaliana corresponding
gene
Protein name Description
Potri.001G005100 Chr01 339493 342618 C32 Flavonoid AT3G13540.1 ATMYB5,
MYB5 myb domain protein 5
Potri.001G007000 Chr01 493207 494619 C32 Flavonoid AT1G15670.1
Galactose oxidase/kelch repeat superfamily protein.
Negatively regulate phenylpropanoid biosynthesis by targeting the phenypropanoid biosynthesis enzyme phenylalanine ammonia-lyase.
Potri.003G138200 Chr03 15639785 15641810 C31 Flavonoid AT4G01070.1 GT72B1,
UGT72B1
UDP-Glycosyltransferase superfamily protein
Potri.003G138400 Chr03 15650072 15653385 C31 Flavonoid AT5G42800.1 DFR, M318,
TT3 dihydroflavonol 4-reductase
Potri.003G139600 Chr03 15733245 15738267 C31 Flavonoid AT1G64390.1 AtGH9C2,
GH9C2 glycosyl hydrolase 9C2
Potri.003G140900 Chr03 15813955 15817854 C31 Flavonoid AT4G10960.1 UGE5
UDP-D-glucose/UDP-D-galactose 4-epimerase 5
Potri.006G190800 Chr06 20556974 20558623 C20 Flavonoid AT2G42250.1 CYP712A1
cytochrome P450, family 712, subfamily A,
polypeptide 1
Potri.006G191000 Chr06 20569291 20573186 C20 Flavonoid AT5G06800.1
myb-like HTH transcriptional regulator
family protein
Potri.011G060300 Chr11 5414925 5416493 C18, C23,
C19_binary Flavonoid AT5G54010.1
Flavonoid 3-O-glucosyltransferas
Potri.011G061000 Chr11 5451888 5453414 C18, C23,
C19_binary Flavonoid AT5G54010.1
Flavonoid 3-O-glucosyltransferas
Potri.011G079400 Chr11 7883530 7889818 C18, C21 Flavonoid AT2G34410.1 O-acetyltransferase family
protein
Potri.011G080000 Chr11 7934591 7935310 C18, C21 Flavonoid AT1G29950.1
basic helix-loop-helix (bHLH) DNA-binding superfamily protein
Potri.012G138800 Chr12 15331801 15333280 C12, C15 Salicinoid AT5G13930.1 ATCHS,
CHS, TT4
Chalcone and stilbene synthase family protein
Potri.012G034100 Chr12 3047772 3049697 C19, C24, C25, C29, C31, C29_binary, C32_binary
Flavonoid AT2G22590.1 UDP-Glycosyltransferase
superfamily protein Potri.012G035800 Chr12 3205152 3206537 C19, C24, C25, C29, C31, C29_binary, C32_binary
Flavonoid AT3G16520.3 UGT88A1 UDP-glucosyl transferase
88A1 Potri.012G036000 Chr12 3225625 3227245 C19, C24, C25, C29, C31, C29_binary, C32_binary Flavonoid AT4G01070.1 GT72B1, UGT72B1 UDP-Glycosyltransferase superfamily protein
Potri.012G139300 Chr12 15374256 15378451 C12, C15 Salicinoid AT4G00730.1 AHDP,
ANL2
Homeobox-leucine zipper family protein. Involved in
the accumulation of anthocyanin
Potri.012G140500 Chr12 15445809 15448186 C12, C15 Salicinoid AT5G52260.1 AtMYB19,
MYB19 myb domain protein 19
Potri.012G140700 Chr12 15454375 15457724 C12, C15 Salicinoid AT3G61250.1 AtMYB17,
MYB17 myb domain protein 17
Potri.013G146200 Chr13 15147780 15151940 C32 Flavonoid AT2G20810.1 GAUT10,
Potri.013G148600 Chr13 15294938 15296422 C32 Flavonoid AT4G21440.1
ATM4, ATMYB102,
MYB102
MYB-like 102
Potri.013G149100 Chr13 15342945 15344193 C32 Flavonoid AT3G23250.1
ATMYB15, ATY19, MYB15
myb domain protein 15
Potri.013G149200 Chr13 15353474 15356043 C32 Flavonoid AT2G31180.1
ATMYB14, MYB14, MYB14AT
myb domain protein 14
Potri.015G002600 Chr15 162021 163539 C22, C27 Flavonoid AT5G24520.1
ATTTG1, TTG, TTG1,
URM23
Transducin/WD40 repeat-like superfamily protein. Affects dihydroflavonol
4-reductase gene expression
Potri.015G003100 Chr15 236720 239777 C22, C27 Flavonoid AT5G54160.1 ATOMT1,
OMT1
flavonol O-methyltransferase 1
Potri.015G010100 Chr15 673277 675584 C23, C31 Flavonoid AT5G24318.1 O-Glycosyl hydrolases
family 17 protein
Potri.018G131600 Chr18 15289123 15290383 C6 CA AT2G41480.1 Peroxidase superfamily
Methods S1 RAD-seq data processing, reference-mapping and variant calling
We processed the reads from RAD-seq with several bioinformatic tools: first, we assigned them to each individual according to their unique barcode through the program fastq-multx (ea-utils; Aronesty, 2011), allowing one mismatch in the 15 bp including barcode and restriction site. FastQC 0.10.1 (Andrews, 2010) was used to check the quality of the data and low quality bases and reads were removed with condetri v.2.2 (Smeds & Künstner, 2011) using default parameters, except for the option -lfrac (maximum acceptable fraction of bases after quality trimming with quality scores lower than the threshold -lq), for which a value of 0.1 was chosen.
Good quality reads were aligned against the P. trichocarpa reference genome
(Ptrichocarpa_210_v3.0; Tuskan et al., 2006). For this purpose, we used Bowtie2 2.2.4 (Langmead & Salzberg, 2012) with “end-to-end” and “very sensitive” settings. Reads with mapping quality lower than 10 were discarded using samtools 1.2 (Li et al., 2009) and read group information was added with picard tools 1.130 (http://broadinstitute.github.io/picard). The files for each individual were run through several tools in GATK 3.4.46 (DePristo et al., 2011): TargetCreator and IndelRealigner to realign around indels, BaseRecalibrator to recalibrate base quality scores using the SNVs from Christe et al.(2016) as set of known SNVs, and
UnifiedGenotyper for variant and genotype calling. This last step was run on the full dataset to obtain the data used in entropy (Gompert et al., 2014), while for RASPberry it was limited to calling genotypes at SNVs from Christe et al.(2016) that were covered in all parental individuals, using the option EMIT_ALL_SITES.
Methods S2 Inference of local and genome-wide ancestry
We used the computer program RASPberry (Wegmann et al., 2011)to estimate local ancestry for our Genome-Wide Association Study (GWAS) mapping population, following the rationale and general principles outlined in our recent poplar hybrid zone study by Christe et al. (2016),
including improvements that were necessary primarily because of the lower sequencing coverage used here. Firstly, we incorporated genotyping error expected for RAD-seq in the RASPberry model by using an estimate of the per-allele error rate obtained with the software TIGER (Tools for Integrating Genotyping ERrors; https://bitbucket.org/wegmannlab/tiger) as input value for the
miscopying mutation parameter (0.0625). The complete procedure for estimating and correcting RAD-seq genotyping error is presented elsewhere (Bresadola et al., 2019), along with a detailed description of the TIGER software. For the species’ mutation rates we added this estimate to the previously available values, scaled by the size of the reference panel (0.00185 and 0.00349 for P.
alba and P. tremula, respectively) as recommended (Wegmann et al., 2011). To reflect
differences in admixed individuals and reference panels compared to Christe et al.(2016), we re-estimated the remaining admixture parameters, namely the time since admixture and the
ancestral recombination rates among the P. alba and P. tremula reference haplotypes. Towards this end, we maximized the likelihood across all individuals but arbitrarily limited to markers on chromosomes 7 and 11 to reduce computational burden. We thus optimized each parameter in turn using the following values: 100, 200, 300, 500, 750, 1000, 2000, 3500, 5000, 7000, 8500 and 10000 for the ancestral recombination rates; 2, 3, 5, 7, 10, 15, 20, 50, 75 and 100 for the number of generations since admixture; 0.01, 0.02, 0.03, 0.04, 0.05, 0.06, 0.07, 0.08, 0.09, 0.1, 0.12, 0.15, 0.17, 0.2, 0.22 and 0.25 for the miscopying rate.
Genome-wide ancestry (q) was used for several purposes in our study, e.g. to check the genomic composition of our admixture mapping GWAS panel (Fig. 1a), as prior information for
estimating local ancestry in RASPberry, and to regress out q during polygenic modeling of quantitative traits with GEMMA (Zhou et al., 2013; below, Methods S3). In general, we used q estimates from entropy (Gompert et al., 2014) in our study. To account for genotyping errors, we ran entropy directly on genotype likelihoods, which we adjusted mathematically to incorporate estimated RAD-seq genotyping error following the procedure implemented in TIGER and described in (Bresadola et al., 2019). Only when running RASPberry, we used an alternative approach, and estimated q with ADMIXTURE (Alexander et al., 2009) based on the SNVs used for local ancestry inference. However, the two estimates of q were highly correlated (Pearson’s r = 0.9897; p-value <2.2e-16).
Methods S3 Rationale for choice of plant traits measured in this study
In this study, we measured a range of traits that differ among the parental species and their hybrids. In particular, we focused on phytochemical traits (the abundances of phenylpropanoid secondary metabolites in leaves), leaf morphology and growth-related traits. This set of traits
was chosen because of its potential relationship with plant performance and fitness:
phenylpropanoid molecules are involved in numerous important processes in plants, including structural support (cell wall fortification and wood formation), disease resistance, UV protection, and plant-animal mutualism (Dixon et al., 2002; Chen et al., 2009; Vogt, 2010; Caseys et al., 2015). Moreover, the underlying genes and pathways are well known compared to most other traits in plants. Leaf area is associated with biomass gain in poplar (Rae et al., 2004) and greater leaf size likely correlates with higher competitive ability (Rae et al., 2006). Plant height is often used as an early fitness proxy in perennial plants (Younginger et al., 2017), and trade-offs between growth and defense are of major interest in plant biology (Züst & Agrawal, 2017). All traits studied here represent ecologically relevant phenotypic trait differences between P. alba and P. tremula, thus they may be involved in reproductive isolation between species.
Methods S4 Admixture mapping with GEMMA: model choice and validation
We used GEMMA 0.94.1 (Zhou et al., 2013) to scan the genome of admixed individuals for associations between ancestry segments and phenotypes (cf. admixture mapping). GEMMA offers the opportunity to choose between fitting a univariate linear mixed model (LMM), a multivariate linear mixed model (LMM) and a Bayesian sparse linear mixed model (BSLMM). We used BSLMM (option -bslmm 1) because it implements a polygenic approach, in which the effect of multiple loci on the phenotype is evaluated simultaneously, rather than a single locus at a time. Most of our modeling decisions and rationales are described in the main paper.
The kinship matrix calculated by GEMMA based on our input data accounted for the similarity at the level of genome-wide ancestry. Being a centered matrix, it showed the deviation of the genomic similarity between a pair of individuals from its mean value: P. tremula-like individuals deviated from this in a specific direction, while P. alba-like individuals deviated in the opposite direction (Fig. S2). In addition to genome-wide ancestry patterns, this matrix also captured genetic relationships within and among the open-pollinated families.
To evaluate the extent to which we came to similar conclusions about trait genetics with different models, we used multiple analysis options in GEMMA, including -notsnp. This option allowed us to directly use the phenotypic measurements (rather than residuals as described in the main paper) and to include the covariates in the file together with the input genotypic information (this
was possible because the -notsnp option disables the filter for minor allele frequency). We note that in -notsnp runs, the parameter estimates associated with genomic architecture (PVE, PGE and n_gamma) should be interpreted with caution, because they also include the effect of q, planting year and common garden location.
For each trait we performed 10 independent model runs, with 2 million burn-in steps and 10 million iterations. The burn-in steps were discarded and convergence was assessed visually by means of trace plots and comparing the consistency of the results across runs. To obtain the posterior distributions of the hyperparameters, we down-sampled the 10 chains, saving 1 value out of 10, and combined chains to obtain posterior distributions. Values of Posterior Inclusion Probability (PIP) per 0.5 Mb windows were calculated separately for the 10 runs and then averaged. Only for one trait (the flavonoid kaempferol-rutinoside-pentose - C21) a subset of the 10 chains suggested the presence of an alternative solution, providing different posterior
distributions for the hyperparameters and different PIPs values. We therefore ran a total of 100 chains, to be able to evaluate the validity of the second solution and to calculate a reliable average when combining all chains.
For 12 phytochemical compounds, trait values (molecular abundances of specific secondary metabolites) were equal to zero in more than 10% of the individuals. In these cases we also ran the trait in a binary version, replacing with 1 all the observations larger than 0. We then used a binomial logistic regression to obtain the residuals to be used as phenotypic information in GEMMA. These runs were not taken into account to examine the posterior distributions of the hyperparameters, but only when selecting interesting genomic regions for selected traits.
To further evaluate the consistency of our results when using different analysis options, we also ran the univariate linear mixed model (LMM) in GEMMA (option -lmm 2), which provides a p-value deriving from a likelihood ratio test for each site.
Notes S1 Genomic windows highlighted by alternative modeling approaches in GEMMA
BSLMMs using the “-notsnp” option:To evaluate the extent to which our results were consistent
among different analysis options in GEMMA, we ran the program also with the raw phenotypic data (not the residuals) and the -notsnp option. This resulted in highly congruent results. For traits C6, C10i, C12, C18, C19 (quantitative and binary) C20, C21, C27, C29 (quantitative and
binary), C31, C32 (quantitative) and C33, the windows exceeding the Posterior Inclusion Probability (PIP) threshold of 0.4 were exactly the same between GEMMA runs based on the residuals or directly on the measurements. For three traits (C15, C22 and C23), there was an additional window in the -notsnp run compared to the run on the residuals, while for C25 and C32 (binary) one window had PIP ≥0.4 in the run on the residuals, but none reached the
threshold in the -notsnp run. Only for one trait (C24), the windows with high PIP emerging from the run on the residuals and from the -notnsp run were different, although nearby on
chromosome 12 (window between 3 and 3.5 Mb and between 4 and 4.5 Mb in the run on the residuals and in the -notsnp run, respectively).
Linear Mixed Models (LMM):The single-SNV analysis (LMM), when compared to BSLMM,
highlighted a significant association only for one trait (C24) if using 5x10⁻⁸ as threshold for the significance of the p-value, a common practice in GWAS applications (Barsh et al., 2012). Out of the ten top-ranking sites for this trait, four are located in the window highlighted by BSLMM, while the remaining six are found in a flanking window downstream. Even considering a less stringent p-value of 10-7, we would have been able to identify associations only for three
additional traits: C12, C15 and C18. The ten sites with the lowest p-value for C12, C15 and C18 are located in the windows with PIP ≥0.4 we selected based on the BSLMM results. In general, LMM identified a much smaller number of significant associations since independently testing each site for association is less powerful than applying polygenic approaches.
Notes S2 Additional information on candidate genes
This admixture mapping study revealed several candidate gene-trait associations with potential relevance for functional plant biology and evolutionary genetics. The best candidate genes are described below while other candidate genes with potential relation to the traits are listed in Table S3.
The flavonoid isorhamnetin-glycuronide (C32) showed association with the first window on chromosome 1 (0.5 - 1.0 Mb), containing the gene Potri.001G005100, which encodes a MYB transcription factor (MYB5 in Arabidopsis thaliana). This compound was also associated with a window on chromosome 13 (15.0 - 15.5 Mb), which conspicuously contains two additional MYB genes (Potri.013G149100 - MYB14 in A. thaliana, and Potri.013G149200 - MYB15 in A.
thaliana), a finding discussed in more depth in the main paper. These windows also contain other
candidates, the gene Potri.001G007000 (chromosome 1) encodes a Kelch repeat F-box that regulates phenylpropanoid biosynthesis in A. thaliana (Zhang et al., 2013), while
Potri.013G146200 (chromosome 13) encodes a protein with a putative galacturonosyl transferase activity. In isorhamnetin-glycuronide, the sugar is either in glucuronide or galacturonide form making this gene a likely candidate.
The interval between 5 and 5.5 Mb on chromosome 11 was associated with three quercetins linked to glucose-based sugars (quercetin rutinoside-pentose C18; quercetin-3-O-rutinoside C23 and quercetin-glucuronide-pentose binary C19). This genomic region hosts two genes
(Potri.011G060300 and Potri.011G061000) whose orthologs in A. thaliana are known to encode flavonoid 3-O-glucosyl transferases acting as catalysts for the transfer of glycosyl groups, which represent important chemical modifications to flavonoid core molecules (Yonekura-Sakakibara & Saito, 2014). In the P. trichocarpagenome (annotation v3.0), these genes are annotated as Anthocyanidin 3-O-glucoside 2''-O-glucosyl transferases. This study suggests that their activity may extend to the flavonols in Populus.
Similarly, the window between 3 and 3.5 Mb on chromosome 12 was significantly associated with several traits, in particular the flavonoids quercetin-glucuronide-pentose (C19), quercetin-3-O-glucuronide (C24), quercetin-3-O-glucoside (C25), kaempferol-glycuronide (C29 and binary C29), isorhamnetin-glycoside (C31), isorhamnetin-glycuronide (binary C32). This region
contains three genes (Potri.012G034100, Potri.012G035800 and Potri.012G036000) annotated in
A. thaliana as UDP-glycosyl transferases. Potri.012G036000 has further been characterized as a
chalcone 4'-O-glucosyl transferase in P. trichocarpa and according to Phytozome
(https://phytozome.jgi.doe.gov) its expression profile shows a correlation coefficient of 0.953 with that of flavonol-synthase 1 (Potri.004G139700), a key enzyme of the flavonoid pathway. Among other noteworthy genetic associations, the window of interest on chromosome 15
(500001 bp to 1 Mb) exhibited association with the flavonols quercetin-3-O-rutinoside (C23) and isorhamnetin-glycoside (C31). In this window, the gene Potri.015G010100 was annotated as encoding a O-glycosyl hydrolase family 17 protein, that reduces the complexity of sugar moieties of phenylpropanoids. On the other hand, the first 0.5 Mb in chromosome 15 were associated with two isorhamnetins (the flavonoids isorhamnetin rutinoside-pentose (C22) and isorhamnetin-3-O-rutinoside C27): this window contains the gene Potri.015G003100, whose
ortholog in A. thaliana encodes a flavonol O-methyltransferase 1 that converts quercetins into isorhamnetins (potentially converts C18 to C22 and C23 to C27).
Isorhamnetin-glycoside (C31) showed significant association with the window located between 15.5 and 16 Mb on chromosome 3. This window hosts the gene Potri.003G138200, also
annotated as UDP-glycosyl transferase.
Finally, the window between 15 and 15.5 Mb on chromosome 12 exhibited a significant association with the salicinoids HCH-Salicortin (C12) and HCH-tremulacin (C15). One candidate gene of special interest in this region is Potri.012G138800, encoding a chalcone-synthase (CHS). From the viewpoint of functional plant biology, the chalcone-chalcone-synthase (CHS) (Potri.012G138800) is of particular interest. While this enzyme is essential to the flavonoid pathway due to its basal role, this gene would not normally be expected to be associated with salicinoid biosynthesis. The Populus genome contains at least six CHS genes (Tsai et al., 2006). The role of CHS in the flavonoid pathway is the conversion of coumaroyl-CoA and malonyl-CoA into chalcone. In the salicinoid pathway, the polyketide synthase activity of the enzyme may act directly on benzoyl-CoA, which has recently been put forward as a potential precursor of this group of compounds (Babst et al., 2010). The expression of this gene is correlated with that of many other genes (36 in total, according to Phytozome data) not involved in the
biosynthesis of flavonoids, suggesting that this gene is indeed part of a different metabolic network. Knowledge regarding the biosynthetic pathway of salicinoids remains very poor. Chedgy et al.(2015) reported the functional characterization of two genes encoding acyl transferases and predicted to produce the secondary metabolites putatively involved in the
benzenoid metabolism. Their findings are consistent with a potential role of these enzymes in the salicinoid pathway, but need to be confirmed by direct functional tests in vivo. To our
knowledge, the CHS gene we identified is the first potential candidate gene put forward for the biosynthesis of salicinoids through a GWAS.
We note that two of the candidate genes described in this study were recently identified as having undergone adaptive protein evolution in one or both of these two hybridizing species (Christe et al., 2017). Both genes were identified in genomic windows associated with
isorhamnetin-glycuronide (C32). The galacturonosyl transferase found on chromosome 13 was found to be under positive selection in both P. alba and P. tremula, while MYB5 (chromosome 1) was affected by positive selection in P. tremula only.
References
Alexander DH, Novembre J, Lange K. 2009. Fast model-based estimation of ancestry in
unrelated individuals. Genome Research 19: 1655–1664.
Andrews S. 2010. FastQC: a quality control tool for high throughput sequence data. Available
online at: http://www.bioinformatics.babraham.ac.uk/projects/fastqc.
Aronesty E. 2011. ea-utils: command-line tools for processing biological sequencing data. Durham, NC: Expression Analysis.
Babst BA, Harding SA, Tsai C-J. 2010. Biosynthesis of phenolic glycosides from
phenylpropanoid and benzenoid precursors in Populus. Journal of Chemical Ecology 36: 286– 297.
Barsh GS, Copenhaver GP, Gibson G, Williams SM. 2012. Guidelines for genome-wide
association studies. PLOS Genetics 8: e1002812.
Bresadola L, Link V, Buerkle CA, Lexer C, Wegmann D. 2019. Estimating and accounting
for genotyping errors in RAD-seq experiments. bioRxivhttp://dx.doi.org/10.1101/587428.
Caseys C, Stritt C, Glauser G, Blanchard T, Lexer C. 2015. Effects of hybridization and
evolutionary constraints on secondary metabolites: the genetic architecture of phenylpropanoids in European Populus species. PLOS ONE 10: 1–23.
Chedgy RJ, Köllner TG, Constabel CP. 2015. Functional characterization of two
acyltransferases from Populus trichocarpa capable of synthesizing benzyl benzoate and salicyl benzoate, potential intermediates in salicinoid phenolic glycoside biosynthesis. Phytochemistry
113: 149–159.
Chen F, Liu C-J, Tschaplinski TJ, Zhao N. 2009. Genomics of secondary metabolism in Populus: interactions with biotic and abiotic environments. Critical Reviews in Plant Sciences 28: 375–392.
Christe C, Stölting KN, Bresadola L, Fussi B, Heinze B, Wegmann D, Lexer C. 2016.
Selection against recombinant hybrids maintains reproductive isolation in hybridizing Populus species despite F1 fertility and recurrent gene flow. Molecular Ecology 25: 2482–2498.
Christe C, Stölting KN, Paris M, Fraїsse C, Bierne N, Lexer C. 2017. Adaptive evolution and
segregating load contribute to the genomic landscape of divergence in two tree species connected by episodic gene flow. Molecular Ecology 26: 59–76.
DePristo MA, Banks E, Poplin R, Garimella K V, Maguire JR, Hartl C, Philippakis AA, del Angel G, Rivas MA, Hanna M, et al. 2011. A framework for variation discovery and
genotyping using next-generation DNA sequencing data. Nature Genetics 43: 491-498.
Dixon RA, Achnine L, Kota P, Liu CJ, Reddy MSS, Wang L. 2002. The phenylpropanoid
pathway and plant defence - A genomics perspective. Molecular Plant Pathology 3: 371–390.
Gompert Z, Lucas LK, Buerkle CA, Forister ML, Fordyce JA, Nice CC. 2014. Admixture
and the organization of genetic diversity in a butterfly species complex revealed through common and rare genetic variants. Molecular Ecology 23: 4555–4573.
Langmead B, Salzberg SL. 2012. Fast gapped-read alignment with Bowtie 2. Nature Methods 9: 357-359.
Li H, Handsaker B, Wysoker A, Fennell T, Ruan J, Homer N, Marth G, Abecasis G, Durbin R, Subgroup 1000 Genome Project Data Processing. 2009. The Sequence
Alignment/Map format and SAMtools. Bioinformatics 25: 2078–2079.
Rae AM, Ferris R, Tallis MJ, Taylor G. 2006. Elucidating genomic regions determining
enhanced leaf growth and delayed senescence in elevated CO2. Plant, Cell and Environment 29: 1730–1741.
Rae AM, Robinson KM, Street NR, Taylor G. 2004. Morphological and physiological traits
influencing biomass productivity in short-rotation coppice poplar. Canadian Journal of Forest
Research 34: 1488–1498.
Smeds L, Künstner A. 2011. ConDeTri - A content dependent read trimmer for Illumina data. PLoS ONE 6: 1–6.
Tsai C-J, Harding SA, Tschaplinski TJ, Lindroth RL, Yuan Y. 2006. Genome-wide analysis
of the structural genes regulating defense phenylpropanoid metabolism in Populus. New
Phytologist 172: 47–62.
Tuskan GA, DiFazio S, Jansson S, Bohlmann J, Grigoriev I, Hellsten U, Putnam N, Ralph S, Rombauts S, Salamov A, et al.2006. The genome of black cottonwood, Populus trichocarpa
(Torr. & Gray). Science 313: 1596–1604.
Vogt T. 2010. Phenylpropanoid biosynthesis. Molecular Plant 3: 2–20.
Wegmann D, Kessner DE, Veeramah KR, Mathias RA, Nicolae DL, Yanek LR, Sun Y V, Torgerson DG, Rafaels N, Mosley T, et al. 2011. Recombination rates in admixed individuals
Yonekura-Sakakibara K, Saito K. 2014. Function, structure, and evolution of flavonoid
glycosyltransferases in plants. In: Romani A, Lattanzio V, Quideau S, eds. Recent advances in
polyphenol research. John Wiley & Sons, 4: 61–82.
Younginger BS, Sirová D, Cruzan MB, Ballhorn DJ. 2017. Is biomass a reliable estimate of
plant fitness? Applications in Plant Sciences 5: 1600094.
Zhang X, Gou M, Liu C-J. 2013. Arabidopsis Kelch repeat F-Box proteins regulate
phenylpropanoid biosynthesis via controlling the turnover of phenylalanine ammonia-lyase. The
Plant Cell 25: 4994–5010.
Zhou X, Carbonetto P, Stephens M. 2013. Polygenic modeling with Bayesian sparse linear
mixed models. PLOS Genetics 9: 1–14.
Züst T, Agrawal AA. 2017. Trade-offs between plant growth and defense against insect