Economic and Policy Implications of Urban Air Pollution
in the United States: 1970 to 2000
by
Trent Yang
M.S., Aeronautics and Astronautics Massachusetts Institute of Technology (2002)
B.S., Aerospace Engineering University of Colorado (2000)
Submitted to the Engineering Systems Division in Partial Fulfillment of the Requirements for the Degrees of
Master of Science in Technology and Policy
at the
Massachusetts Institute of Technology
February 2004
© 2004 Massachusetts Institute of Technology. All rights reserved.
Author ... ... .. ... r r ... ...E...
Technology and Policy Proam, Engitring Systems Division
(7 January 23, 2004
Certified by ... ...
John Reilly
Senior Research Scient, Laboratory For Energy and Environment, MIT
Thesis Supervisor
Accepted By ...
Dava Newman Professor f Aeronautics and Astronautics and Engineering Systems Director, Technology and Policy Program
[
_LIBRARIES
I
A-HIVES'
I
Economic and Policy Implications of Urban Air Pollution in the United States: 1970 to 2000
By
Trent Yang
Submitted to the Department of Engineering Systems on January 23, 2004 in Partial Fulfillment of the Requirements for the Degree of Master of Science in Technology and
Policy
Abstract
In the last 30 to 40 years, an increasing awareness of the link between urban air pollutant levels and negative health effects have led to numerous studies and policies that are targeted towards both understanding the linkage and mitigating its effects. In 1970, the Environmental Protection Agency (EPA) created the Clean Air Act directed at reducing harmful emissions that cause high pollution levels in urban areas. Ever since then, environmental economists and policy makers have attempted to better understand the economic impacts of these regulations through cost and benefit analysis.
Towards that end, we have developed a methodology for fully integrating the health effects from exposure to air pollution into a computable general equilibrium economic model. This model represents the first attempt at fully incorporating the economic valuation of air pollution in an integrated economic model that has endogenously built-in consumer demand and preference curves to accurately represent the demand for air pollution health. This framework provides a way to consistently value effects with commonly used approaches for valuing costs of mitigation and to explore uncertainties in these estimates. Furthermore, we also describe a new stock and flow model to track the extra mortalities from chronic exposure to particulate matters. Past frameworks have assumed an immediate relationship between pollution levels and mortality levels. While this is true for mortality due to acute exposure, changes in mortalities from chronic exposure due to a change in pollution levels are only gradually realized and so the full effects on the economy are observed for many years. This new framework allows the tracking of total pollution in-take and its effect on mortality levels over time as pollution levels change.
Using these new models, we valued the economic benefit of reduced air pollution due to the Clean Air Act regulations to be over $7 trillion from 1970 to 2000, or 2.1% of aggregate US economic welfare over the period. This does not include the benefits into the future (after 2000) from reduction in mortality due chronic exposure during these years. The economic benefit of those saved mortalities is another $7 trillion using a 3% discount rate. Another calculation is the remaining economic burden of unmitigated pollution levels (actual historical pollution). We estimate this to be approximately $9 trillion over the same period. The $9 trillion burden includes the early mortalities due to chronic exposure to PM before and during this period.
While these economic benefits of air pollution regulation are large ($7 trillion), they are considerably less than the $27.6 trillion estimated in EPAs own analysis of the
benefits of air pollution regulation. The main difference for our lower estimate is the stock-flow accounting of mortality due to chronic exposure. There are considerable
uncertainties in these estimates both because of uncertainties in the relationship between air pollution exposure and the health effects, and in the assumptions needed to value these effects.
Thesis Supervisor: John Reilly Title: Senior Research Scientist, MIT
Acknowledgement
I would like to thank MIT's Joint Program on the Science and Policy of Global Change in giving me the opportunity to work and learn from so many amazing professors, scientists and support staff. A special thanks goes to my thesis advisor, John Reilly, without whose genius none of this would have been possible. It has been truly a pleasure to work with someone who is not only extremely knowledgeable about the entire field of environmental economics both in its theory and practice but is willing to share the knowledge and take the time to explain everything clearly.
I would also like to thank Laura-Ann, Florence, Jim T, Jim M, Marcus, Paul and all the other students in the program who made this an enjoyable process. It is very nice to have such a close group of fun people to work with that I enjoy coming into work almost everyday.
Other people I would like to acknowledge that have made my time here enjoyable include all my roommates, Andy, John, Will and Mike for their support and all the fun times we have shared in the last three years. Kacey, who has been the most amazing person in supporting and loving me in the last three years - thank you from the bottom of my heart. And to all my other friends both at MIT and around Boston, it's been a great three years and I look forward to seeing much more of them now that this thesis is done!
Finally but not lastly, I would like to thank all my family (both my parents and my immediate family members) for their support and belief in my success.
Table of Contents
List of Figures
...
7
List of Tables
...
8...
Chapter 1 Introduction
...
9...
1.1 Climate Change, Air Pollution and Health ... 9
1.2 Research Contribution of Thesis ... 11
1.3 Simulation Result Overview ... 13
1.4 Thesis Organization ... 14
Chapter 2 Air Pollution and Health Studies ... 16
2.1 Introduction ... 16
2.2 Epidemiological Studies ... 17
2.2.1 Introduction and Types of Health Studies ... 17
2.2.2 Epidemiological Study Results ... 19
2.2.3 Past Valuation of Health Impacts ... 28
Chapter 3 Economic Framework and Integration into EPPA
...
31
3.1 Introduction ... 31
3.2 MIT Emissions Prediction and Policy Analysis (EPPA) ... 32
3.2.1 General Overview ... 32
3.3 Framework for Adding Pollution Effects Into Economic Model ...35
3.3.1 Expansion of CGE / SAM ... 36
3.3.2 Framework for Modeling Mortality in the CGE Model ... 39
3.4 Implementation into CGE model (EPPA) ... 44
3.4.1 New utility functions for the "household production of health" ... 44
3.4.2 Addition of leisure/non-work time ... 47
3.4.3 Dealing with extra mortalities ... 49
3.4.4 Calibration of the first year data ... 50
3.5 Value of life comparison - this model vs. past methods ...54
Chapter 4 Economic Valuation of Urban Air Pollution in U.S.
1970-2000 ... 58
4.1 Introduction ... ... ... 58
4.2 Simulation Assumptions, Data and Setup ... 59
4.3 Simulation Results and Policy Implications ... 62
4.3.1 "Control" Scenario ... 62
4.3.2 "No control" scenario ... . ... 64
4.3.2.1 Comparison to EPA cost benefit analysis ... 68
4.3.3 "Green" Scenario ... 71 4.3.4 Sensitivity Analysis ... 73 Chapter 5 Conclusions ... ... 76 APPENDIX A ... 80 APPENDIX B ... 81 APPENDIX C ... 82 References ... 83 6
List of Figures
Fig. 1 Example SAM table layout ... ... 34
Fig. 2 Sample consumption and production structure in EPPA ... 35
Fig. 3 The additional of Household Healthcare production sector ... 37
Fig. 4 Pollution level vs. mortality level due to chronic exposure to pollution - past methodologies ... 40
Fig. 5 Lung and Pulmonary Mortality distribution compared to nominal total mortality ... 41
Fig. 6 Percentage increase in mortality for each age group due to 10 tPg/m 3of PM exposure over their lifetime ... 42
Fig. 7 Stock-flow vs. nominal method of estimating changes in mortality from chronic exposure to PM due to changes in PM level ... 44
Fig. 8 New consumption functions for the implementation of household healthcare sector and non-work (leisure) time ... 45
Fig. 9 US wage distribution [ref 22] ... 48
Fig. 10 historical US GDP/welfare growth ... 54
Fig. 11 Age group population loss for the 1 million mortality from chronic exposure to Particulate Matter . ... 55
Fig. 12 labor + leisure loss for 1 million mortality in 1995 ... 56
Fig. 13 Urban pollutant concentration + urban population growth ... 63
Fig. 14 US GDP and real wage trend 1970-2000 ... 64
Fig. 15 EPA emission prediction for no-control scenario vs. historical records ... 65
Fig. 16 Economic growth for US for "no-control" scenario compared to "control" scenario ... 66
Fig. 17 Economic welfare loss for "no-control" scenario as compared to historical values ... 67
Fig. 18 Each pollutant contribution to welfare loss without air pollution control ... 68
Fig. 19 Mortality difference between "control" and "no-control" scenarios ... 69
Fig. 20 EPA and our model comparison for mortalities saved from reduced PMo1 levels due to Clean Air Act regulations ... ... 70
Fig. 21 Economic welfare loss due to historical pollutant levels 1975-2000 ... 72
List of Tables
Table 1 Extern-E compilation of health effects ... 23
Table 2 Extern-E compilation of uncertain health effects - sensitivity analysis ... 23
Table 3 Mortality RR levels from extended Pope's study [ref 2] ... 26
Table 4 Example of Linearity Assumption with Pope's Mortality Study ... 26
Table 5 Morbidity Valuation from Extern-E ... 30
Table 6 EPPA model's key dimensions ... 33
Table 7 table of breakdowns for each health endpoint ... 53
Table 8 Value of average mortality from chronic exposure to PM ($M) ... 57
Table 9 Natural ambient concentration levels of criteria pollutants (note: all values in PPB except for PM which is in pig/m3)... 61
Table 10 Economic value of extra mortality due to chronic exposure to PM10 before 2000 ... 70
Table 11 Total economic benefits from having Clean Air Act regulation vs. no-control ... 71
Table 12 Uncertain health effects of pollutants ... 74
Table 13. Sensitivity analysis for 1975 air pollution economic burden from uncertain relationships of health endpoint vs. increased pollutant concentration ... 75
8
Chapter 1
Introduction
1.1 Climate Change, Air Pollution and Health
While global climate change studies and policies have received much recent news coverage and attention (Kyoto), health effects from high emission levels of air pollutants are of much more concern to the local economies and welfare of the citizens in the immediate time frame. Furthermore, it has also come to the attention of scientists and policy makers that climate changing green house gases (GHGs) are also related to urban air pollutants through complicated atmospheric chemistry that may have counterintuitive results if these policies are considered separately. For example, if both the emissions of VOCs (volatile organic compounds) and NOx (these are usual precursors GHGs) are held at a low enough level, it could actually lead to the increase of Ozone (both an urban air pollutant and a GHG) levels in the atmosphere.
In the last 30 to 40 years, an increasing awareness of the link between urban air pollutant levels and negative health effects have led to numerous studies and policies that are targeted towards both understanding the linkage and mitigating its effects. In this thesis, I focus on studying air pollution health effects within and economic model that has been used to study climate change mitigation. It is a contribution to economic analysis of air pollution effects, and the first step toward an integration of these two important, and inter-related policy questions.
On the policy front, EPA in 1970 introduced the Clean Air Act Amendment in hopes of limiting the amount of air pollutants being released into the ambient air and to establish limits in "criteria pollutants" to protect public health, and welfare. The "criteria pollutants" include Ozone, Particulate Matter (PM), Carbon
Monoxide (CO), Nitrogen Dioxide (NO2), Sulfur Dioxide and Lead. At the same
time, EPA launched and sponsored multiple studies to better understand the direct and indirect links between air pollution and human health effects.
The range of health studies includes chamber, epidemiological cohort and population-level ecological studies. Chamber studies of air pollution involve exposing human subjects to various levels of air pollution in a carefully controlled
and monitored laboratory situation. Epidemiological studies take real-world
health and pollution data and assess the relationship between population-wide health information (such as daily mortality, hospital admissions, etc) and ambient
levels of air pollution using statistical methods. Cohort-based studies track
individuals over a certain period of time, with periodic evaluation of the individuals' exposure and health status.
After thirty years of regulations, there is natural tendency among policy analysts and economists to analyze the value of the policies through cost and benefit analyses. The task of quantifying the benefits of the Clean Air policies are difficult because the they do not fall on a particular person or a group of people but rather the entire population through decreased morbidity and mortality levels. Furthermore, different populations groups (such as kids vs. adults vs. elderly and those who have asthma) react differently to increased air pollution and will acquire different benefits at varying levels.
Several improvements have been made in the past decades to set a proper framework for assessing air pollution effects and costs. Hohmeyer (ref, 1988) was the first to use a top down approach, multiplying an inventory of
emissions by toxicity factors and then by costs of damages. However, the
toxicity factors used were derived from government regulations for maximum permissible concentrations at workplace instead of being absolute intrinsic toxicity factors. Additionally, the results were averaged to cost per kWh of electricity produced without considering the effect of population density on the number of people exposed to air pollution. In recent years, several investigators and agencies have taken this idea forward and made many meaningful contributions (ref 1, 5, 6, 9, 10, 15, 16, and 21). Most recently, Laurianne Curtil
of MIT's Global Climate Change Program (ref 21) utilized the ExternE (Externalities of Energy) compilation of air pollution and human health effects in a large-scale macroeconomics model for economic valuation of air pollution across multiple regions of the world and over a long (100 yr) time frame. Other similar studies include the ExternE's own economic valuation of air pollution, European Agency's study on traffic pollution and human health effects and valuation, EPA's cost and benefit analysis of the clean air act and Kerry Smith's recent studies on incorporating individual preferences in valuating the economic costs of air pollution (ref. 15 and 16)
1.2 Research Contribution of Thesis
While all of the above approaches have their own merits in valuing the economic consequences of air pollution, to this date no study has fully incorporated the economic valuation of air pollution in an integrated economic model that has endogenously built-in consumer demand and preference curves to accurately represent the demand for air pollution health. Dr. Kerry Smith was one of the first to suggest this approach to value air pollution costs (ref 15, 16) but this thesis represents the first time that this approach has been utilized within a full economic model. Benefits of such an approach are that the valuation of air pollution effects is directly calculated in welfare terms measured as equivalent variation, and the valuation that is consistent with wage, income, and other price differences as they vary across different regions of the world and over time.
Furthermore, the effects of air pollution, including sick days, bronchitis, and early mortality among others, redirect resources in the economy toward medical expenditures or result in lost labor or non-labor time with consequent effects on all other economic activities. All of these effects may in turn produce potential feedback on emissions levels. Study of these effects ultimately requires a fully coupled economic and pollution system model.
Towards that end, we have developed a methodology for fully integrating the effects of the air pollution into the Emissions Prediction and Policy Analysis
(EPPA) model. EPPA is a computable general equilibrium (CGE) model that represent the circular flow of goods and services in the economy. Not only does it endogenously model a full set of inter-industry transactions, consumer demand for goods and services but also savings as well as taxes to provide funds for investment and government purchases. Furthermore, EPPA is a component of the MIT Integrated Global Systems Model (IGSM) a coupled
economics-chemistry-atmosphere-ocean-terrestrial biosphere model of earth systems
including an air pollution model resolving the urban scale. IGSM is at the
forefront of modeling climate changes through the integration of economics, policy and atmospheric policy. We hope that by endogenizing the air pollution data and its consequent economic effects into this model, a fuller and more complete understanding of the economic and social costs of air pollution can be understood in the full context of global climate change.
The new model within EPPA integrates the epidemiological relationships on health damages within the overall CGE model and explicitly considers stock-flow aspects of the pollution, exposure, and health impact relationship. From this model, not only are we better able to describe the time profile over which the health benefits of a change in pollution would be realized but we are also then able to estimate, for example, the value of lost wages that are consistent with the wage rates in different regions of the world, and changing wages and productivity
of the labor force overtime.
This framework is then applied to the US for the period 1970 - 2000 for
two different analysis. The first study is a benefit analysis of the Environment Protection Agency's (EPA) Clean Air Act. We compare the economic growth with the Clean Air Act in place (i.e. historical US economic growth record from 1970-2000 - the "control" scenario) with the hypothetical case of "no-control" where urban air pollution is allowed to grow without the strict controls put in place by the
local, state and national governments. In the "no-control" case, we utilize EPA's
predictions on the growth of urban air pollution without control in the EPPA economic model to determine its economic state. The difference between the two scenarios is the economic benefit of having the Clean Air Act regulations.
This benefit value can then be compared to the actual costs of implementing the Clean Air Acts for a true cost-benefit analysis of the policies.
The second study analyzes the burden of historical urban air pollution on the US economy. The "control" scenario is used as a comparison, this time to the hypothetical "green" scenario that has urban air pollution at "natural" levels
observed in the non-polluted parts of the world such as the ocean. The
economic differences between the two scenarios are the cost of urban air pollution on the US economy even with all the policies of the last thirty years that are designed to curb these effects.
1.3 Simulation Result Overview
Simulation of the different scenarios reveals that the economic benefits of the Clean Air Act regulations far outweigh the costs of implementation. From 1970 to 2000, the total economic benefit in the United States from reduced urban air pollution levels had an economic benefit of over $7 trillion. Furthermore, due to the reduced particulate matter levels from that period, population mortality levels will also be lower even beyond year 2000. Chronic exposure to particulate matters has been shown to cause earlier mortality but these deaths only come about after prolonged exposure. With the clean air regulations, and the reduced particulate matter levels in urban areas, fewer people will develop the lung and cardiopulmonary diseases that are associated with chronic exposure to these pollutants. In all, over half a million more people in the next 60 years will live to their normal life expectancy because of the lowered air pollution levels from 1970-2000 than if pollution levels had not been controlled. Over the years, the reduced mortality levels also increase the overall economic welfare of the
country. If a 3% discount is used, the economic value of reduced mortalities is
approximately another $7 trillion in year 2000 value.
The second study on the economic burden of the unmitigated air pollution levels show that even with the tough Clean Air Act regulations, significant air pollution remain in our cities and it has a high economic impact on the society. In the same 1970-2000 period, unmitigated pollution levels created a $9 trillion burden on the society. On average, this translates to 3% of the annual total economic welfare of the United States including the non-market (leisure values) or 5.8% of the GDP.
1.4 Thesis Organization
There are three main sections in this thesis. The first section analyzes all the past health impact studies. We pay attention to the most controversial studies such as Pope's particulate matter study (ref 2 and 3), and understand the current expert consensus. As part of this discussion, we also describe how the results of these epidemiological studies can be used in a CGE economic valuation framework.
In the second section, we outline the basic framework for endogenizing the air pollution results into EPPA. Both the underlying economic theories and the practical modeling techniques will be discussed in detail. A key issue is the difference between chronic and acute exposures and the implications of these differences for the economic models. Recent epidemiological studies [ref 9 and 10] have suggested that mortality from chronic exposure to particulate matters account for over 75% of the economic costs of air pollution. Many past modeling methods have been particularly inadequate in dealing with these effects, failing to adequately differentiate between a one time illness that occurs from acute exposure and the long-term effect of exposure to pollution over many years. We introduce an explicit stock-flow accounting of both the exposure and the loss of life in the model.
Finally, the third major section contains the simulation results of the new model in the EPPA. We model the US economy from 1970 to 2000 under the
14
three different conditions - historical (control), no-control, and green - and
present two sets of estimates of the urban air pollution effects on the US economy. The first set uses EPA's own estimates of air quality conditions without the Clean Air Act regulations of the last 30 years (no-control scenario) and determines the benefits in monetary terms of having the improved air quality (no-control vs. control). This result can be compared to EPA's own estimate of the economic benefits derived from improved air qualities due to its regulations as part of its major cost-benefit analysis [ref 9, 10]. This is a typical benefit calculation - how much damage was avoided because of controls that kept
pollution below what they would have been without controls. Apart from
uncertainties in the epidemiological relationships (past studies) and economic valuation of these effects (this thesis), such calculations also depend upon the correct forward propagation of what pollution would have been without regulation. Those values are taken directly from EPA's own projections [ref 9, 10] and will not be repeated in this thesis.
The second model estimates the historical costs (economic burden) in the US from 1970 to 2000 that remain from incompletely controlled urban air
pollution even with all the regulations of the last thirty years. For these
calculations we use historical urban air pollution levels from 1970-2000 to estimate the cost to the society compared with the hypothetical case (green scenario) of urban air conditions equivalent to "natural" levels observed in the other parts of the world such as over the ocean or non-populated land.
Lastly, I draw conclusions and suggest what additional research and data would be needed to extend these estimates to other economies of the world.
Chapter 2
Air
Pollution and Health Studies
2.1 Introduction
Estimates of health costs due to air pollution are based upon known relationships between air pollution intakes and the associated mortality and morbidity. In the last 20-30 years, a large number of health studies have been used to establish the correlation between a particular air pollutant and the corresponding health effects. Past and recent epidemiological research has found consistent and coherent associations between air pollution and various outcomes (eg, respiratory symptoms, reduced lung function, chronic bronchitis and mortality). [ref - 5] While it would be most ideal to back these studies with actual understanding of the body chemistry interaction with these pollutants, we have neither the scientific means for a detailed chemistry and biological analysis nor the resources and human capital for long-term controlled chamber studies that are representative of the entire population. With this in mind, we have selected a set of epidemiological results that are widely accepted within the scientific and policy arena and show a consistent statistical relationship between its ambient air pollution level and the exposed population's health. In addition, we have also a smaller set of health relationships that are not as widely accepted but have strong epidemiological results that will serve as a sensitivity analysis to our studies. In a sense, the additional "uncertain" health effects will provide a ceiling as the maximum level of health and economic effects of urban air pollution.
In this chapter, a survey of the current health studies are presented along with the selection of results that will be used to calculate the economic effects of air pollution in a general equilibrium economic model - the Emissions Prediction and Policy Analysis (EPPA), developed at MIT. The air pollutants considered for
this study include particulate matters (PM0o), nitrogen dioxide (NO2), sulfur
dioxide (SO2), ozone (03), carbon monoxide (CO) and nitrates. These are, for
16
the most part, "criteria" air pollutants as identified by the EPA. Criteria air pollutants are designated by EPA as the most common air pollutants and its effects are of particular concern to the population and the environment at large. In addition, nitrate is also added for sensitivity analysis due to recent epidemiological studies [ref 1 and 5] that show strong linkage between it and several health effects. The only "criteria" pollutant not included is lead which has been virtually eliminated from the air since the late 1980s.
2.2 Epidemiological Studies
2.2.1 Introduction and Types of Health Studies
Health studies aimed at understanding the correlation between exposure to air pollutants and human health can be placed into two major categories:
chamber and epidemiolQgical studies. Chamber studies involve exposing
humans and laboratory animals to carefully controlled closed environments where exact dosages of air pollutants are known. Physiological conditions of human subjects including pulse rate, altered lung function, and coughing among others are carefully recorded along with the air pollutant levels. Animal studies allow for longer and larger dosages, and more invasive investigation of physiological effects. The obvious advantage of chamber studies is that the exact correlation between air pollution intake and physiological change can be correlated using rigorous laboratory and scientific analysis. But several factors preclude chamber studies from being the de-facto choice in understanding the relationship between human health and air pollution exposure. Due to the potential harmfulness of the study, it is extremely difficult (if not impossible) to get enough subjects to fully represent the entire population and expose them to an extended period that would simulate chronic exposure health conditions. Scaling from animal studies to human exposures also introduce uncertainties. These concerns limit the usefulness of these studies and in fact they are mostly used to verify specific physiological effects of pollution and for comparison purposes
against the second type of study - epidemiological analysis.
Epidemiological studies estimate a statistical relationship between health endpoints and pollution levels as measured across different populations or individuals. The health end-point data is usually gathered through hospital
records, health statistics and questionnaires to study participants. Among
epidemiological studies, there are two different types of analysis - cohort-based and population-level ecological studies.
The cohort study can follow a set of prospective cohorts and track their health and exposure to ambient air pollution forward in time or study a set of retrospective cohorts and gather historical data on health impacts and past air pollution levels. Studies can involve tracking multiple sets of population with each exposed to different levels of pollution. These studies can also use data from individuals, including health status (where available), individual exposure
(not usually available), and individual covariates or risk factors, observed over
time. Studying the statistical differences between the populations' health end-points and pollution level can give scientists a good estimate of the relationship between the two. This set of tests is most commonly used for detecting health effects from long-term or chronic exposures to ambient air pollution.
The second type of epidemiological study is a population-level ecological study. These studies follow the relationship between population-wide health statistics and ambient levels of air pollution. Most of these studies look at the daily variations in human health reports vs. any changes in ambient air pollution measurements. This the most common type of study relating one time health effects with acute exposure to local air pollution.
Chamber studies are valuable for establishing the specific mechanisms or physiological effects of the pollutants but it is very difficult to use these to estimate affects on pollution on a population. The rest of the thesis concentrates on the results of epidemiological studies.
2.2.2 Epidemiological Study Results
Ever since EPA's clean air act, a large number of studies have been done to try to quantify the relationship of various air pollutants to health effects. Many of these studies address a limited set of pollutants or examine limited local population (ref 21). Because this report aims at producing a comprehensive framework for studying air pollution valuation, a full set of compatible studies for
all the air pollutants and effects is needed.
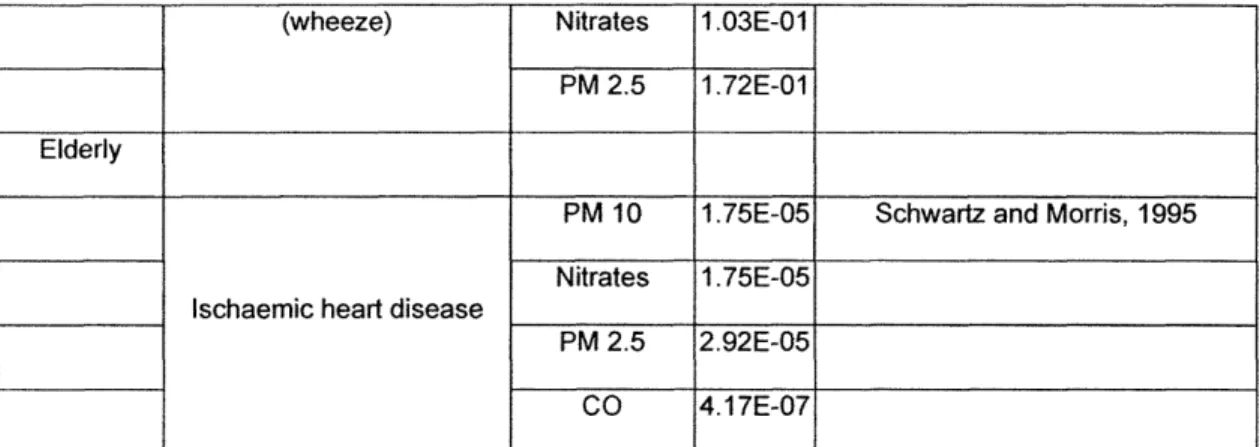
Fortunately, there have been several attempts to synthesize the disparate epidemiological study results. One of the most comprehensive studies of this kind is the European Externality of Energy (ExternE) assessment. At the time of its second release (1998), it had reviewed and synthesized all relevant health studies into one coherent set of air pollutants and end health effects that were statistically relevant. The following tables summarize the ExternE assessment. The first table lists the pollutants and the health effects that are most accepted by the scientific field, while the second table shows the more uncertain relationships which will be used in the sensitivity analysis.
19
Receptor Impact Category Pollutant E-R fct Reference
ntire Population
PM 10 2.07E-06
Nitrates 2.07E-06 Dab et al 1996
Respiratory hospital PM 2.5 3.46E-06 admissions SO2 2.04E-06 Ponce de Leon 1996 03 7.09E-06 PM 10 5.04E-06 Cerebrovascular hospital
Cerebrovascular hospital Nitrates 5.04E-06 Wordley et al 1997
admissions
PM 2.5 8.42E-06
Symptoms days 03 3.30E-02 Krupnick et al 1990
PM 10 0.040%
Spix and Wichmann 1996,
Nitrates 0.040% Verhoeff et al 1996 PM 2.5 0.068% Acute Mortality Anderson et al 1996, Touloumi SO2 0.072% et al 1996 03 0.059% Sunyer et al 1996 PM2.5 0.64%
Chronic Mortality Pope et all 2002
PM 10 0.40%
Receptor Impact Category Pollutant E-R fct Reference
Children
PM 10 1.61 E-03
Chronic Bronchitis Nitrates 1.61 E-03 Dockery et al 1989
PM 2.5 2.69E-03
PM 10 2.07E-03
Chronic Cough Nitrates 2.07E-03 Dockery et al 1989
PM 2.5 3.46E-03
Adults
PM 10 2.50E-02
Restricted activity day Nitrates 2.50E-02 Ostro, 1987
PM 2.5 4.20E-02
Minor restricted activity day 03 9.76E-03 Ostro and Rothschild, 1989
PM 10 4.90E-05
Chronic bronchitis Nitrates 4.90E-05 Abbey et al, 1995
PM 2.5 7.80E-05
Elderly 65+
PM 10 1.85E-05
Nitrates 1.85E-05
Congestive heart failure ___ __Scwartz and Morris 1995
PM 2.5 3.09E-05
CO 5.55E-07
Receptor Impact Category Pollutant E-R fct Reference
Asthmatics
All
Asthma attacks 03 4.29E-03 Whittemore and Korn 1980
Adults
PM 10 1.63E-01
Bronchodilator usage Nitrates 1.63E-01 Dusseldrop et al 1995
PM 2.5 2.72E-01
PM 10 1.68E-01
Cough Nitrates 1.68E-01 Dusseldrop et al
PM 2.5 2.80E-01
PM 10 6.10E-02
Lower respiratiry symptoms
Nitrates 6.10E-02 Dusseldrop et al
(wheeze)
PM 2.5 1.01 E-01
Children
PM 10 7.80E-02
Bronchodilator usage Nitrates 7.80E-02 Dusseldrop et al 1995
PM 2.5 1.29E-01
PM 10 1.33E-01
Cough Nitrates 1.33E-01 Dusseldrop et al 1995
PM 2.5 2.23E-01
Lower respiratiry symptoms PM 10 1.03E-01 Dusseldrop et al 1995
22
"-(wheeze) Nitrates 1.03E-01
PM 2.5 1.72E-01
Elderly
PM 10 1.75E-05 Schwartz and Morris, 1995
Nitrates 1.75E-05
Ischaemic heart disease
PM 2.5 2.92E-05
CO 4.17E-07
Table 1 Extern-E compilation of health effects
Receptor Impact Category Pollutant E-R fct Reference
Entire Population
Respiratory hospital
NO2 1.40E-06 Ponce de Leon, 1996
admissions
Emergency Room Visit for PM 10 7.20E-06
Chronic Obstructive Nitrates 7.20E-06 Sunyer et al, 1993
Pulmonary Disease PM 2.5 1.20E-05
PM 10 6.45E-06
Emergency Room Visit for Nitrates 6.45E-06 Schwartz, 1993 and Bates, 1990
asthma PM 2.5 1.08E-05
03 1.32E-05 Cody, 1992 and Bates, 1990
Acute Mortality CO 0.00% Touloumi et al, 1994
NO2 0.03% Sunyer et al, 1996, Anderson et al,
1996 Table 2 Extern-E compilation of uncertain health effects - sensitivity analysis
In general, the health effects are divided into two major categories: morbidity and mortality. For morbidity, the studies found that the air pollutants
were significantly linked to the following types of health impacts: hospital
admissions, emergency room visits, restricted activity days, and increased cases of bronchitis, wheezing, and coughing. Hospital admissions were largely due to air pollution's negative effect on lung, heart and brain functions which resulted in
respiratory, cardiovascular and cerebrovascular illnesses. Emergency room
visits were mainly from respiratory problems caused by sudden high exposures of PM and Ozone. Another health end point is a restricted activity day (RAD) is defined as a day when a study subject was forced to alter his or her normal activity. RADs include days off work for employed adults and days off school for children, whether or not the subjects were confined to bed on those days. A separate category of minor RAD was created to cover cases where there was no work or school loss but other limitations on the general livelihood of the person was noted. In general health studies have correlated levels of air pollution to levels of health effects through the exposure rate (ER) term. Exposure Rates (ER) values for morbidity are interpreted as following:
Morbidity: # of cases = ER * concentration level * population
where ER here has the units of cases / (person year ug/m3)
Mortality effects can be further broken down as those due to acute or chronic exposure to pollution. Acute exposure mortality effects refer to the cases of sudden death when exposed to higher pollution level. In general, these cases resulting from exposure to higher ambient urban levels of pollution are limited to
people who are near to their "expected" death age. In most literature, the lost
time estimated to be approximately 0.25 to 0.5 years. The second category of mortality effect includes cases resulting from chronic exposure of air pollution where a person's life is shortened gradually over its entire course due to a constant intake of these harmful pollutants. Examples are fatal heart or lung diseases that develop only after years of exposure and eventually cause an early
24
death. The relationship between mortalities and exposure to pollution levels are defined as:
Mortality: % increase / year = ER * concentration level
where ER here has the units of % change in annual mortality rate /I (ugm3).
While cases of mortality related to acute exposure to severe air pollution were well documented by the 1970s, it was not until the early nineties that epidemiological studies began to surface that suggested increased mortality levels even with low concentration levels of air pollution over a long period of
exposure[ref 2]. Several recent studies [ref 2,3,4], suggest that long-term
exposure of even low level air pollution is not only hazardous but may be of
larger consequence than short-term acute effects [ref 2]. Most long-term
mortality effects from air pollution are based upon cross-sectional studies or more recently, prospective cohort studies.
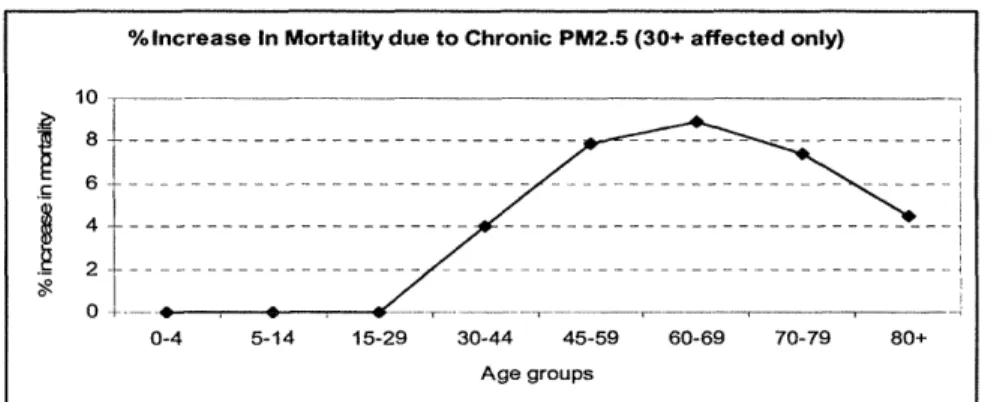
For example, the largest of these studies, the American Cancer Study by Pope [ref 2,3], had 1.2 million adult (>30 yrs of age) volunteer participants residing in all 50 states, District of Columbia and Puerto Rico. Vital statistics including age, sex, weight, height, smoking history, alcohol use, occupational exposures, diet, education, marital status and other characteristics were collected and used in future statistical analysis as either indicators or control variables [ref 2]. The 1.2 million volunteers were then restricted to those who lived within an urban area with available pollution data. Mean concentrations of air pollution for the metropolitan areas were compiled from various data sources [ref 2] and calculated for each metropolitan area during the 1 to 2 years prior to enrollment. In the 16 years of study, death certificates were gathered for 98% of the mortalities within the cohort. The baseline analysis of this study used these mortality levels in all the metropolitan cities with different ambient PM levels to estimate the adjusted relative risk (RR) ratios (similar to the exposure-rate value described above) for chronic exposure to PM. Any person(s) who moved or were still alive at the end of the study were not considered in the statistical analysis. The study found that mortality levels were positively correlated with different PM
25
levels even after controlling for cigarette smoking, BMI, diet, occupational exposure, other individual risk factors and any regional or other spatial differences.
Causes of Mortality Adjusted RR associated with a 10 ug/m3 difference in PM2.5 (95% Cl)
All-causes 1.04 (1.01-1.08)
Cardiopulmonary 1.06 (1.02-1.10)
Lung Cancer 1.08 (1.01-1.16)
All other causes 1.01 (0.97-1.05)
Table 3 Mortality RR levels from extended Pope's study [ref 2]
The RR levels shown in Table 3 are the increase in mortality for that
specific cause due to an increase in chronic exposure of PM2.5 of 10 ug/m3.
Using those RR values, the number of deaths at different pollution levels can be calculated. Table 4, shows the mortality effects in Boston at various pollution
levels using Pope's ACS study results. These results are based upon a
population of 1 million with an annual nominal mortality rate of 5% or 50,000 and a zero threshold assumption.
PM2.5 level Increase in mortality Total Extra Mortality from (pg/m3
) rate Mortality Exposure to PM
0 0 50,000 0
10 5%*4% = 0.2% 52,000 2,000
50 1% 60,000 10,000
100 2% 70,000 20,000
Table 4 Example of Linearity Assumption with Pope's Mortality Study
26
An important assumption present in the Pope et al's cohort study is that each participant has been exposed to the same relative pollution levels throughout their entire life and that the exposure is directly related to the measured ambient pollution levels in the urban area.
Studies on particulate matter (PM) health effects, in particular its effect on increased mortality, have come under heavy scrutiny due to both its relative high impact values and the underlying assumptions and statistical work involved. Several experts have argued that the association between fine particulate matters and increased mortality rates were due to inadequate control of
important individual risk factors. After extensive independent audit and
reanalysis of the original study [ref 2], Pope published a new set of results in
2002 [ref 3] that confirms earlier study results and contained more data and controlled for new factors such as smoking, education, marital status, BMI, alcohol consumption, occupational exposure, diet variables, other pollutant levels and regional and spatial differences. Although the new analysis confirms the previous study results, there still remain some controversies. Unlike a substance such as CO that is clearly toxic at high enough levels, particulate matter is a mix of substances, many inert, some toxic (heavy metal) and the exact mix varies across different regions. Thus, the underlying epidemiological analysis for the exact amount of effects remains hard to verify through other means such as chamber studies.
Other assumptions used in the rest of the study include linearity and no threshold for health effects from exposure to ambient air pollution.
The linearity assumption states that the total number of health impacts (regardless of the type) is linearly proportional to the level of pollution regardless of a baseline threshold for the pollution to affect a population. While different people respond differently to varying levels of pollution exposure, on the whole, most studies have not found strong evidence for a non-linear relationship between concentration level and health effects is an accurate representation. In
27
fact, the linearity assumption is used widely in almost all health cost studies these days [ref 5, 21].
One form of non-linear relationship that has been much debated is whether there is a threshold below which no damages occur, and then a positive relationship (possibly linear at higher levels). Realistically, most people these days do not become sick from normal exposure to the ambient background air pollution. However, there is no good evidence of a threshold at the population level (ref. 5). For large population groups, there may always be people who become adversely affected by even the smallest amount of air pollution exposure. In fact, as of last check, the World Health Organization (WHO) has also adopted a "no threshold" position for particulate matters and ozone.
Furthermore, even with the adoption of a threshold level, these are usually so low that they do not have a meaningful contribution to any cost and benefit studies involving air pollution control policy. I.e. the difference between policy and no policy usually does not ever involve levels as low as any reasonable threshold. However, the existence of a threshold would be important in our "green" scenario estimates.
2.2.3 Past Valuation of Health Impacts
In order to gain an aggregate understanding of the costs of the health impacts from urban air pollution and to compare different endpoints on a similar basis, environmental economists seek to monetize these health endpoints. Assigning a monetary value to each of the health impacts allows policy advisors to compare expected benefits of reducing pollution to the costs of doing so. While an important task, it generates additional controversies and uncertainties
[ref 9]. The costs of the health effects are complicated and involve both market valued goods (such as lost work time and increased purchase of medical services) and non-market goods (such as lost leisure time and the agony and suffering of the individual). Both the methodologies used in valuing these costs
28
and its application are among some of the more heated debates in environmental economics and policy [ref 9].
The two most commonly accepted valuation method for both morbidity and mortality are the contingent valuation method (CVM) and the cost of illness (COI). The total value of any illness is composed of: the value of the time lost because of the illness, the value of the lost utility because of the pain and suffering and the costs of any expenditure on averting and/or mitigating the effects of the illness [ref 5].
The costs of illness (COI) is the easiest to measure and are usually based on the actual expenditures associated with different illnesses or on the expected frequency of the use of different services for different illnesses. These values can normally be obtained through hospital and/or insurance records. Furthermore, if the illness involves some loss of performance at work either due to loss of ability or work time, COI would include those costs as well. The COI, in general, can be thought of as all the market values of any illness and would have a direct effect on the GDP of any country. The biggest drawback of this method is that it does not value non-market costs such as pain and suffering. For those valuations, the CVM is currently the only accepted methodology. Loss of leisure (non-work time) is often valued as part of a CVM study, but, in principle, the time lost can be estimated and then valued at a prevailing market wage.
Contingent valuation is mostly based upon questionnaires that are designed to tease out the values that individuals place upon these non-market values in the context of the illness through either willingness-to-pay (WTP) or
willingness-to-accept (VVWTA) values. As their names imply, WTP means the
amount of money a person is willing to pay to reduce their chance (risk) of getting an illness, and WTA is the amount of money it takes for a person to willingly
accept a risk increase in getting the illness. Because the WTA can be
unbounded, most CVMs are designed to find the WTP value. This exercise is
extremely difficult and usually results in very controversial solutions that span a wide range.
For this thesis, the costs for each of the illness (apart from mortality - see section 3.3.2) are taken directly from the ExternE study [ref 5]. The ExternE team utilized the extensive US literature on this subject to come up with a comprehensive and systematic set of values for each of its health endpoints:
Health impacts Costs in US dollars 2000
Restricted Activity Day $106
Respiratory Hospital Admissions $11,115
Cerebrovascular Hospital Admissions $11,115
Symptoms Days $11
Chronic Bronchitis Adults $148,296
Chronic Bronchitis Children $318
Chronic Cough for Children $318
Congestive Heart Failure $11,115
Asthma attacks $52
Cough $318
Lower Respiratory Symptoms (wheeze) $11
Ischaemic Heart Disease $11,115
Minor Restricted Activity Day $11
Emergency Room Visit $315
Acute Mortality $106
Table 5 Morbidity Valuation from Extern-E
The costs stated in Table 5 represents both the market and non-market costs of these illnesses. While this collection is the best point estimate of the health effects, in order to truly gain a sound economic valuation over time, these costs need to be folded into preference and utility functions of an economic
model. This is the topic of the next chapter.
30
Chapter 3
Economic Framework and Integration into EPPA
3.1 Introduction
Health impact valuations up to now have been limited to using a mixed set
of market and non-market valuation approaches. Mostly, analysts have relied
upon the use of point estimates (see Table 5) derived from gross
production/consumption loss or willingness to pay surveys. These
methodologies are based upon partial equilibrium concepts and while such estimates are sound under some circumstances, they do not take into consideration the potential economic response and interactions that may occur in the economy as represented in general equilibrium models. Further, the reason for valuing damages in the first place is for cost-benefit analysis, where the marginal value of avoided damage (i.e. the policy benefit) is compared with the marginal cost of the policy. But with marginal cost derived from one analysis exercise and benefit from another it is difficult to insure consistency in underlying
data on wage rates or other economic values that, if not treated explicitly in the analysis, are at least implicit in the answers of survey respondents.
In this section, we describe an approach for directly incorporating pollution health damages within a computable general equilibrium economic model
-MIT's emission projection and policy analysis (EPPA). Once the health impacts
are introduced in the model the valuation of policy benefits is endogenous, and reflects responses and interactions represented in the model. Moreover, EPPA was designed specifically to simulate pollution emissions that are commensurate with the overall economic growth in different parts of the world. This provides an
ideal solution to incorporate feedbacks on economic growth and its effects on emission. Other benefits of such an approach include valuations of air pollution effects that are directly calculated in welfare terms measured as equivalent
31
variation. The approach draws from and builds on efforts to include non-market environmental effects in national income and product accounts (NIPA) (ref 17) in that we begin by identifying where health effects lie in the underlying Social Accounting Matrix (SAM) for an economy, the underlying data for CGE modeling. The SAM is built directly from the NIPA accounts. A related approach is that of Kerry who incorporated pollution health damages in the utility or preference functions of consumers to capture these effects (ref 15, 16).
3.2 MIT Emissions Prediction and Policy Analysis (EPPA)
3.2.1 General Overview
The Emissions Prediction and Policy Analysis (EPPA) model is a component of an integrated framework of natural and social science models being developed by the MIT Joint Program on the Science and Policy of Global Change. It is a detailed, global, computable general equilibrium (CGE) model with a long time horizon and regional as well as sectoral detail (ref. 19).
The EPPA model is a multi-region, multi-sector, recursive-dynamic computable general equilibrium (CGE) model. The world is divided into the sixteen economic regions shown in Table 6, which are linked by international trade. The economic structure in each region consists of eleven production sectors and four consumption sectors, all shown in Table 6, plus one government and one investment sector.
32
Regions: Production Sectors:
USA United States AGRI Agriculture
CAN Canada COAL Coal
MEX Mexico OIL Crude Oil
JPN Japan ROIL Refined Oil
ANZ Australia - New Zealand GAS Gas
EUR Europe ELEC Electricity
EET Eastern Europe EINT Energy-intensive Industries
FSU Russia Plus OTHR Other Industries
ASI East Asia SERV Services
CHN China TRAN Transport
IND India CGD Savings Good
IDZ Indonesia
AFR Africa
MES Middle East
LAM Latin America
ROW Rest of the World
Primary Factors
Labor
Capital (by vintage)
Sector-specif fixed factors for each fuel Land in agricultural
Consumer Sectors:
All production sectors
+
PTRN personal transport
Table 6 EPPA model's key dimensions
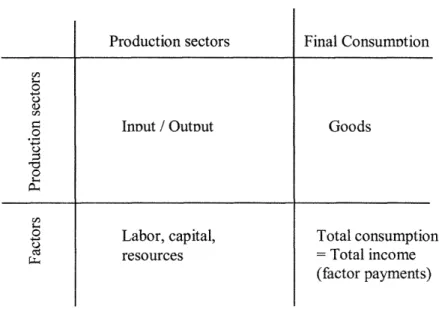
The EPPA model is calibrated with the 1997 base year data. The data set consists of Social Accounting Matrices for each of the 16 regions, and a international trade matrix. Figure 1 shows a simplified example of a SAM leaving out government, investment and trade. The elements of the SAM are the input-output relationships among production sectors, the factors (labor, capital, land, and energy resources) supplied by households and used by the production sectors, and the final consumption goods. In this simplified representation, final consumption must equal total income. In the fuller development of the SAM (as modeled in EPPA), government is treated as another end user and consumers have the option of investment as another final use of goods. The rest of the thesis will only refer to this simplified representation of the SAM table as all the variables that we need are shown here.
33
-
--Final ConsumPtion InDut / Outout Labor, capital, resources Goods Total consumption = Total income (factor payments)
Fig. 1 Example SAM table layout
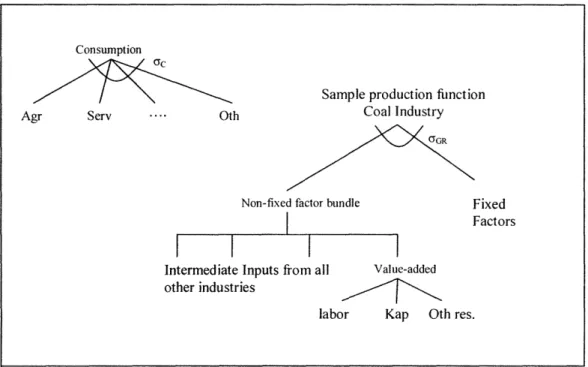
Each of the eleven production sectors are described by a nested constant elasticity of substitution (CES) production functions, see figure 2, that combines the output of other sectors as material or energy inputs, and uses labor and capital as primary factors. Various natural resources (such as oil, coal, gas, land) constitute an additional primary "fixed factors" input that enter releveant production sectors. The consumption equation is also described as a CES function. 34 0O c) 0 .. a o p o c) Cd -I---I---Production sectors
Consumption
Consumption
Agr Serv .... Oth
Sample production function Coal Industry
C"GR
Non-fixed factor bundle
I
I
I
Intermediate Inputs from other industries
all Value-added
labor Kap Oth res.
Fig. 2 Sample consumption and production structure in EPPA
The key parameters are the elasticity of substitution (shown as ac and cYGR
in the figure above). The consumption elasticity represents the willingness of
consumers to substitute their consumption of one good for another. In
production, the elasticity is the technical capability to substitute one input for another. In most cases, these elasticity values are ascertained from expert solicitations. More detailed discussion of the model along with the general equilibrium equations can be found in references 13 and 19.
3.3
Framework for Adding Pollution Effects Into Economic
Model
In this section, we discuss the basic underlying ideas and frameworks associated with adding the effects of urban air pollution into the CGE model. The two main areas of focus are: an expansion of the SAM table and the CGE model to include a household production of health to combat the effects of the urban air
35
Fixed Factors
pollution and the development of a new stock-and-flow model for dealing with mortality from chronic exposure to particulate matters.
3.3.1 Expansion of CGE / SAM
Health impacts from urban air pollution affect the economy, through lost labor, greater demand for health care, and lost leisure. From past health studies (detailed in Chapter 2), exposure to higher levels of air pollutants can cause responses ranging from increased coughing and asthma attacks to hospital visits for respiratory and cerebrovascular symptoms to even higher levels of mortality. All of these health impacts affect the economy differently. For mild symptoms such as coughing and asthma, the majority of lost value is on the suffering and
loss of leisure for the patients (non-market effect). These symptoms are
measured in number of occurrences and last for a short period of time (less than a day or two). For more serious health consequences such as chronic bronchitis, heart disease and hospital visits due to respiratory and cerebrovascular problems, the economic impacts may include lost leisure (non-market), lost labor (market) and an increase in hospital and medical services (market). To recover from these more serious health implications, individuals not only need to rest and give up both work and play but also pay for more and better medical care.
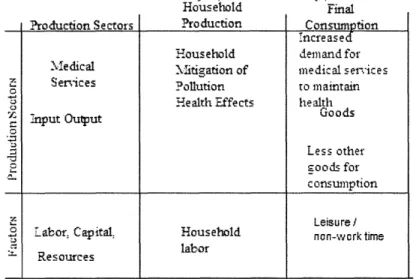
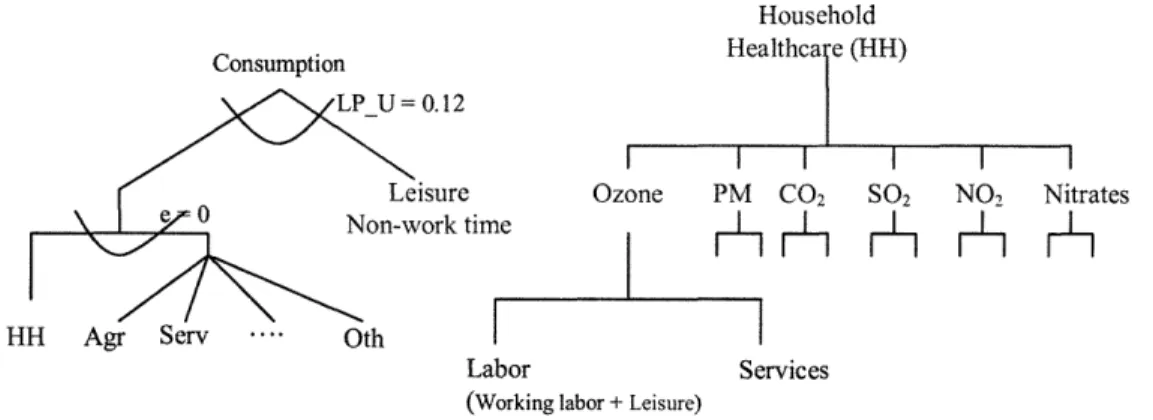
The basic SAM tables for economic analysis normally include only market related goods. As discussed above, health effects include not only these market related labor time but also a loss of non-work time enjoyment for working adults and children and elderly time as well. In order to capture all of these effects, the basic SAM table as shown in figure 1 is updated to include a production/consumption sector called "household production of health" (figure 3) and non-working time (i.e. leisure) into EPPA. Leisure is added into the EPPA economic model in an effort to capture the "non-market" effects of the health endpoints while "household" production sector is setup to capture all the necessary inputs for keeping the population healthy from exposure to urban air pollution. We refer to this household production sector as 'household production
of healthcare' but note that rather than breakout the entire household health production activity and medical services sector we focus just on demands associated with environmental health damages. These demands are then drawn from the aggregate 'Service (SERV)' sector in EPPA where the medical service
sector is included. The new household healthcare sector takes as input the
amount of lost labor (both leisure and work labor) and healthcare services that are required by the affected population to regain their health. Figure 3 illustrates this process through the expansion of SAM table to include both the "household production of health for air pollution" and the non-work time.
Household Final ?roduction Sectors Pro duction Consumption
increase Household demand for Medical litigation of medical services
oE Services Pollution to maintain
Health Effects health Goods - nput Out = Less other goods for consumption F= Leisure I
Labor Capital. Household non-work time esources labor
Resources
Fig. 3 The additional of Household Healthcare production sector
Within the SAM table, the new household health production sector takes as input both medical services from the original production sectors (for full list of production sectors in EPPA see Table 6) and both workforce labor and the new
leisure (non-work) labor. Different illnesses will have different inputs. For
example, the illness of restricted activity day (RAD) is significantly different than hospital visits for cerebrovascular disease. For RAD, in order to recover, the patient mostly stays home from work and as a further consequence of the illness, does not fully enjoy his/her non-work (leisure) time either. For the more serious
37
--cerebrovascular disease, not only are lost work and leisure time part of the equation, the recovery from such an illness would also require large medical expenditures as well. Furthermore, some of the health effects only affect a small subset of the population. For example, quite a few of the health effects only affect elderly folks which means besides medical services, only non-work time will be lost. For a complete listing of all the different health effects from exposure to urban air pollution and the inputs (lost work time, lost leisure time and/or medical services) that are necessary to make the patient feel better see Table 7 in the next section.
Overall, as total pollution increases (decreases) over time, the "household pollution effect mitigation" sector will require more (less) of the two inputs, medical service and labor. This will have a ripple effect on other goods and prices. As more medical service is needed, more of the factors of production (land, capital, natural resources) will be redirected towards that sector and away from other sectors. Thus if medical services is labor intensive then labor prices will go up relatively vs. capital and resources. Furthermore, labor will be diverted from producing other goods towards keeping the population at the same level of healthiness. In the end, the total welfare of the economy will be lower as the total amount of goods produced is decreased from both the loss of production factors (mainly labor) and redistribution of the remaining factors to produce more of the medical services that are needed to maintain health in the face of air pollution.
Several issues arise regarding the inclusion of non-work (leisure) time. Often when leisure is added to CGE models, the reason for doing so is to create a labor force response to the changing wage ratio [ref 23]. In those cases, a benchmark quantity of leisure might be chosen to reflect a maximum amount of additional labor that could ever be supplied. For example, Babiker, Metcalf and Reilly [ref 23] chose a quantity of 20% of the labor force. This amount can be viewed as the maximum extra labor that might be injected into the workforce depending upon the labor-leisure elasticity. However, our interest is not focused on leisure as a potential supply of labor to the economy but on its value to households as either leisure or as household labor. In this thesis, we follow the
38
economic theory that on the margin, people value their leisure time just as much as their working time (i.e. the value of an extra leisure minute is the same as how much they are being paid for work). This makes the leisure value of the working adults to be equal to its labor value and we can get an estimate of the children and elderly hours though the wage distribution of the US. For details of this value and actual implementation into the CGE EPPA model see section 3.4.
3.3.2 Framework for Modeling Mortality in the CGE Model
The economic effects of mortality cases persist in time. For example, the economic effect of someone who passes away at the age of 60 from air pollution exposure, who otherwise would have lived until 75, will persist over that remaining 15 years. This differs from effects such as RADs or hospitalizations that are events where the direct effect is seen only in the period in which the event occurs. The difference is one of stock and flows. Mortality is a change in the stock of available labor (and leisure) whereas a morbidity illness is an interruption in the flow of services. In the example above where the person passed away at age sixty instead of 75, he/she would have lost both work labor time from 60 to the normal retirement age of 65 and leisure (non-work) time from
60 until her normal death age of 75. It is necessary to keep track of this
prolonged economic effect to gain a complete understanding of the effects on the overall economy from mortality due to exposure to air pollution. The exact modeling techniques as they apply to this model will be detailed in the next section.
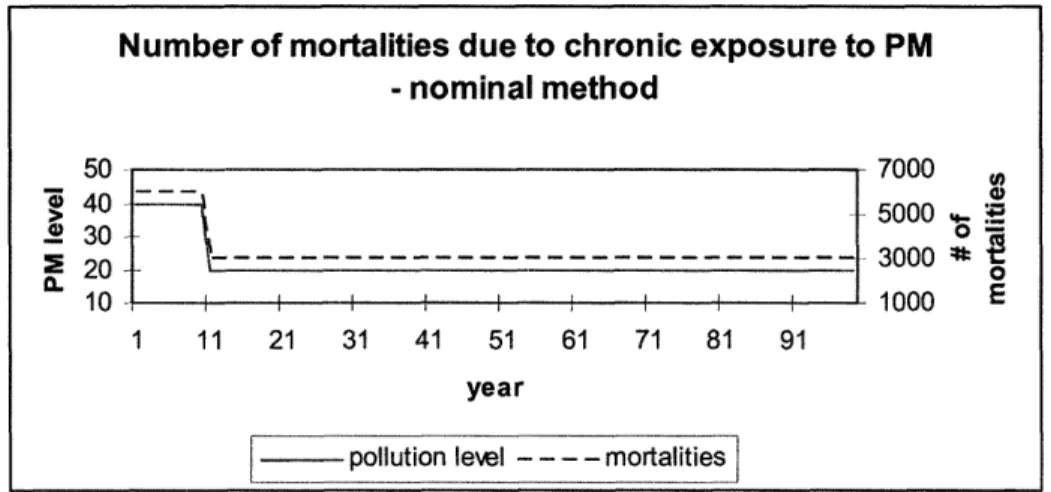
The second stock and flow problem is the mortality due to chronic exposure to pollution. The economic characterization of the mortalities from chronic exposure to air pollution has not been adequately modeled in past assessments of health and economic damages due to air pollution. Almost all of the economic analysis of the costs of air pollution has made the simplified assumption that as Particulate Matter increase (decrease), all of the changes in mortalities occur immediately (see figure 4). This assumption is not correct.
39