HAL Id: hal-00329282
https://hal.archives-ouvertes.fr/hal-00329282
Submitted on 1 Jan 2003
HAL is a multi-disciplinary open access
archive for the deposit and dissemination of
sci-entific research documents, whether they are
pub-lished or not. The documents may come from
teaching and research institutions in France or
abroad, or from public or private research centers.
L’archive ouverte pluridisciplinaire HAL, est
destinée au dépôt et à la diffusion de documents
scientifiques de niveau recherche, publiés ou non,
émanant des établissements d’enseignement et de
recherche français ou étrangers, des laboratoires
publics ou privés.
Distributed under a Creative Commons Attribution - NonCommercial| 4.0 International
License
Turbulence characteristics inside ionospheric small-scale
expanding structures observed with SuperDARN HF
radars
R. André, C. Hanuise, J.-P. Villain, V. Krasnoselskikh
To cite this version:
R. André, C. Hanuise, J.-P. Villain, V. Krasnoselskikh. Turbulence characteristics inside ionospheric
small-scale expanding structures observed with SuperDARN HF radars. Annales Geophysicae,
Euro-pean Geosciences Union, 2003, 21 (8), pp.1839-1845. �10.5194/angeo-21-1839-2003�. �hal-00329282�
Geophysicae
Turbulence characteristics inside ionospheric small-scale expanding
structures observed with SuperDARN HF radars
R. Andr´e1, C. Hanuise1, J.-P. Villain1, and V. Krasnoselskikh1
1LPCE/CNRS, 3A Av. de la Recherche Scientifique, 45071 Orl´eans Cedex, France
Received: 23 August 2002 – Revised: 20 December 2002 – Accepted: 17 February 2003
Abstract. Unusual structures characterized by a very
high-velocity divergence have been observed in the high-latitude F-region with SuperDARN radars (Andr´e et al., 2000). These structures have been interpreted as due to local demagnetiza-tion of the plasma in the ionospheric F-region, during very specific geophysical conditions. In this study, the collective wave scattering theory is used to characterize the decameter-scale turbulence (λ ≈ 15 m) inside the structures. The distri-bution function of the diffusion coefficient is modified when the structures are generated, suggesting that two regimes of turbulence coexist. A temporal analysis decorrelates the two regimes and gives access to the dynamics associated with the structures. It is shown that a high turbulent regime precedes the plasma demagnetization and should be related to an en-ergy deposition. Then a second regime appears when the plasma is demagnetized and disappears simultaneously with the structures. This study is the first application of the col-lective wave scattering theory to a specific geophysical event.
Key words. Ionosphere (auroral ionosphere; ionospheric
ir-regularities) – Space plasma physics (turbulence)
1 Introduction
Coherent HF radars use decameter-scale electron density ir-regularities as tracers of the plasma motion, deriving the av-erage line of sight velocity from a complex autocorrelation function (ACF) obtained by the transmission of a multipulse sequence (Greenwald et al., 1985). An appropriate analy-sis of the ACF also gives details on the turbulence proper-ties inside the illuminated area. Using the collective wave scattering theory, which is an approach well developed in the laboratory plasma sciences, Gr´esillon et al. (1992) and Hanuise et al. (1993) have demonstrated that it can also be applied to ionospheric HF coherent radar observations. In a fluctuating plasma, this theory considers that the
scat-Correspondence to: C. Hanuise ([email protected])
ter originates from macroscopic dielectric response function non-uniformities and that the scattered frequency spectrum is Doppler broadened by fluid motions. It is an alternate ap-proach to the usual method of considering that density fluctu-ations are due to waves in an unstable plasma and of looking for their dispersion equation. In a later work, Villain et al. (1996) have shown that the recorded ACF can be adjusted with a general analytical expression, from which the inte-gral correlation time and the turbulent diffusion coefficient can be extracted. Fitting the observed ACF with this analyt-ical expression, the authors evaluated these two parameters which describe the turbulence. Their distribution functions have been established for a large data set.
Recently, Andr´e (1997) and Andr´e et al. (2000) (to be referred to as Paper 1) have published observations of un-usual structures in the ionosphere observed by SuperDARN radars (Greenwald et al., 1995). They are characterized by an anomalously high velocity divergence in a plane perpendic-ular to the magnetic field. The purpose of the present paper is to make use of the characteristics of the micro-scale tur-bulence in order to describe the temporal evolution of the meso-scale structures. It is not aimed at explaining the phys-ical process involved in generating the very high plasma dif-fusion coefficient that is observed in the present study. This will be the subject of a future paper. To our knowledge, this paper is the first attempt to make use of the results of the collective wave scattering approach to improve our under-standing of meso-scale phenomena in the ionosphere.
The second part of this paper summarizes the radar ob-servations and briefly recall their interpretation. In Paper 1, it has been shown that the global ionospheric conditions are unchanged during the events and that the ionospheric ions become locally demagnetized. When this happens, the plasma should undergo a strong change in behaviour, and these changes could be identified through dramatic changes in the plasma turbulence characteristics.
The global evolution of the diffusion coefficient D is stud-ied in the third part, and some unusual behaviour associated with the inner part of the structures is shown. The fourth part
1840 R. Andr´e et al.: Turbulence in small-scale expanding structure
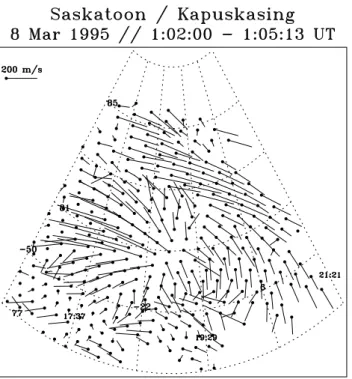
Fig. 1. Example of small-scale expanding structure seen by the Saskatoon/Kapuskasing pair of SuperDARN HF radars (from Andr´e, 1997).
describes the temporal variations of D. It provides us with a new picture of the structure evolution, corresponding to an energy deposition before the demagnetization, to the appear-ance of a specific turbulence regime limited to the structure region, and to the disappearance of this regime at the end of the event when the plasma motion recovers a classical be-haviour, indicating that the ions are again magnetized. Fi-nally, we conclude on this first geophysical application of the collective wave scattering approach and on its ability to describe the turbulence behaviour in specific events.
2 Observations and interpretation
The collective wave scattering approach is applied to unusual structures, previously dubbed “small-scale expanding struc-tures” (SSES) in Paper 1. In this paragraph we briefly recall the radar observations and their interpretation.
2.1 Observations
Figure 1 presents velocity vectors of plasma motion in a plane perpendicular to the magnetic field in a MLT-Invariant Latitude reference frame, as evidenced with the use of the high-spatial resolution merging technique (Andr´e et al., 1998). The amplitude and the direction of the flow are in-dicated by the amplitude and the orientation of the line, whereas the dots represent the location where the plasma ve-locity is computed. The map clearly shows the presence of a very high divergent flow surrounded by a large-scale vortex. A few minutes before this observation, the plasma motion
de-Fig. 2. Temporal window used for computing the distributions of
diffusion coefficient and correlation time. The time (here +5 min) is defined at the center of the window.
scribed only a vortex, indicating the presence of a divergent electric field in a magnetized plasma (E × B motion). This implies the closure of field-aligned currents in the E-region (Sofko et al., 1995). The same type of structure has been observed several times. Their typical spatial scale is of the order of 300 km and their lifetime varies from 5 to 10 min. The phenomenon is, therefore, sufficiently stable so that it is detected by the radars during at least two azimuthal scans of 2 min each.
The structures are observed during very specific geophysi-cal conditions, in particular a northward interplanetary mag-netic field (IMF). In such conditions, the magnetosphere is closed and the nightside convection pattern is highly irregu-lar (see, for example, Bythrow et al., 1985). As indicated by the very low values of the Kp index (1 to 1+), the planetary activity is very weak, without any global change in the mag-netospheric configuration. The vortices and divergent flows appear in a localized region at 75–80 degree of magnetic lat-itude in the evening sector (19–21 MLT), near the poleward boundary of the auroral oval, as defined by Feldstein and Starkov (1967).
The global radar data strongly suggest that the ionospheric conditions remain steady, and that the propagation path of the incident radar wave is unchanged in the course of the obser-vations. By using the location of echoes due to direct re-flections from the ground, the ionospheric density profile has been estimated in Paper 1, and it has been inferred that the structures should be located at the bottom of the F-region, at an altitude close to 200 km. At last, having examined care-fully the ACF analysis, the authors concluded that the struc-tures are not due to some experimental artifact but are truly related to the signatures of real geophysical events.
2.2 Interpretation
As a consequence of their magnetization in the F-region, the ion should follow a divergence-free motion in a plane per-pendicular to the magnetic field. During the SSES events, if the particles are moving in the E × B direction, such a veloc-ity divergence would imply a strong vorticveloc-ity in the electric field, and, consequently, a strong temporal variation of the magnetic field amplitude. The values computed in Paper 1 are unrealistic, as the Earth magnetic field would collapse in two minutes.
(a) (b) (c)
(d) (e)
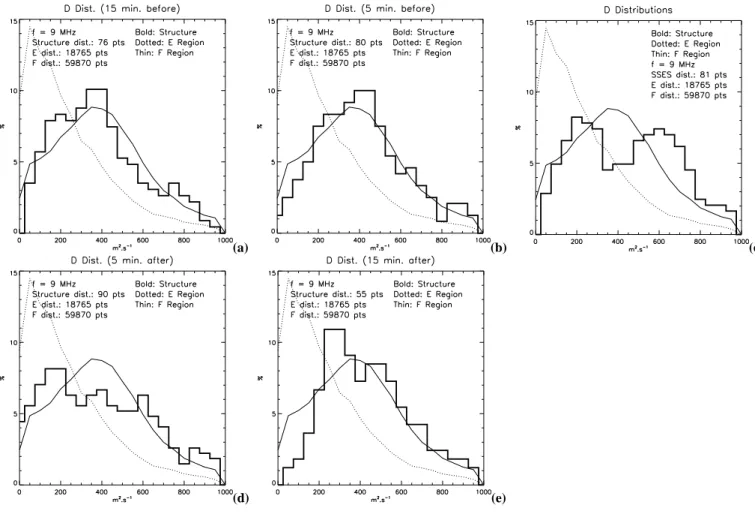
Fig. 3. Variation of the diffusion coefficient D at several times before (a, b), during (c) and after (d, e) the peak of the events.
order to interpret the observations is to consider that ions are no longer magnetized and that their motion is governed by collisions. It remains to explain the origin of the strong in-crease in the ion collision frequency at the bottom F-region. It has been proposed in Paper 1 that plasma turbulence gen-erated by strong wave-particle interaction can produce an effective collision frequency greater than the ion gyrofre-quency, and thus achieve the needed ion demagnetization. Another possibility is an increase in the neutral density asso-ciated with a strong heating of the thermosphere.
3 Characteristics of the turbulence within the struc-tures
In order to obtain a more detailed view of the characteristics of these structures, the collective scattering theory has been applied to the radar Doppler spectra, as one might expect that the parameters characterizing the plasma turbulence, namely the integral correlation length and the diffusion coefficient D, do undergo a noticeable change, simultaneous with the change in ion state from magnetized to unmagnetized. In or-der to check this hypothesis, we have compared the distribu-tion of D values inside the structures to the average F-region
distribution at the same radar frequency. This has been done in a statistical sense for all the events of Paper 1.
3.1 Diffusion coefficient distribution
In a first approach aimed at identifying the global character-istics of the turbulence before, during and after the structure, a sliding window of 10 min has been applied (Fig. 2), inde-pendent of the real duration of the particular events. Figure 3 shows, as a bold line, the distribution of the diffusion coeffi-cient D inside the structures for various delays: before, dur-ing and after the observation time. This figure is an histogram of D values for all range-beam cells of the radars which fall within any of the structures included in the data set. Suc-ceeding figures (4 and 6) are similar plots for more limited temporal or spatial portions of the events. The thin and dot-ted lines indicate average F-region and E-region distributions of this parameter at 9 Mhz, respectively (Villain et al., 1996; Andr´e, 1997).
The distributions computed 15 and 5 min before the events (Fig. 3a and b) are very similar to the average F-region dis-tribution. This confirms that the areas probed by the radar are located within the F-region where ions should be magne-tized. They also show that the number of points, if small, is
1842 R. Andr´e et al.: Turbulence in small-scale expanding structure
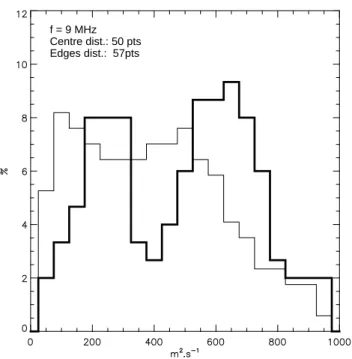
f = 9 MHz Centre dist.: 50 pts Edges dist.: 57pts
Fig. 4. Values of D measured in the center (bold line) and at the
edges of the structures (thin line).
still large enough for it to be statistically significant. One can notice some small changes from the −15 min to the −5 min distributions. For example, the occurrence of D val-ues lower than 150 m2/s decreases, while the number of D values greater than 600 m2/s increases.
During the lifetime of the structures, the distribution be-comes very different, with two well-marked maxima at 200 and 600 m2/s (Fig. 3c). The original 400 m2/s peak has com-pletely disappeared.
Five minutes after the events (Fig. 3d), the occurrence of diffusion coefficients close to 400 m2/s increases again, while the 600 m2/s peak starts to disappear. The compo-nent near 200 m2/s is still present, with a slight shift towards smaller values. For this window, there can be some over-lapping with the structure due to the different lengths of the various events. Finally, the distribution observed 15 min af-ter the event (Fig. 3e) is again close to the average F-region distribution, the 200 m2/s and 600 m2/s peaks having com-pletely disappeared. One can furthermore notice that small Dvalues are nearly absent in the histogram.
Summarizing all these observations, the most striking fea-ture is a very unusual distribution of the diffusion coefficient Dinside the structures. The presence of two maxima sug-gests the existence of two different turbulence regimes over-lapping in space and/or time.
3.2 Spatial variations
In Paper 1, it has been shown that the signal-to-noise ratio (SNR) is strongly enhanced on the structure edges. This characteristic has been used as a means of determining the structure scale size. The SNR ratio indicates an increase in
Fig. 5. Temporal window used to compute the distributions in the
normalized time scale.
the electron density fluctuation level or an increase in the number of irregularities present at the interface between the structure centers and the background ionosphere. One can expect that a specific turbulence regime will take place at this location and will lead to the development of one of the peaks in the D distribution.
In order to evaluate the influence of the structure bound-aries on the D distribution, we have separated the data orig-inating from this region from those located at the structure centers. Figure 4 shows the result with the distribution at the center as a bold line and the distribution on the edges as a thin line. The multi-peaked feature is greatly enhanced inside the structure centers but is barely visible on the bound-ary. However, on this boundary, the 400 m2/s peak, typical of the average F-region distribution, is present and the 600 m2/s peak is totaly absent. One can note that the 200 m2/s is also present in this region, at the same level as within the center.
Therefore, the comparison of the D distributions in two spatially distinct locations inside the structures allows us to conclude that the high values of D are preferentially located near the centers.
4 Structure dynamic
4.1 Identification of the turbulence regimes
In order to separate temporally the different regimes in the distribution of D, we first reduce the duration of the temporal window by a factor of 2, as shown in Fig. 5. Moreover, tak-ing into account that the events have different lifetimes, we also define a normalized time scale, in which the time is nor-malized over the structure’s lifetime. Therefore, the origin of the time scale (time 0) corresponds to the beginning of obser-vation for any structure, and its end (time 1) to the end of the observations, whatever the event duration. Using this defi-nition, Fig. 5 shows two time windows which correspond to times 0 and 0.75, respectively. The temporal evolution of the distributions is afterwards computed by shifting successively the time window by steps of 0.25.
4.1.1 Diffusion coefficient
With the previous definition, the first half of an event cor-responds to normalized time 0.25 (window from 0.0 to 0.5) and the second half to time 0.75 (window from 0.5 to 1.0). Figure 6 shows the D distribution for the two halves, the first one plotted as a bold line and the second one as a dashed line.
Fig. 6. D distributions in the first (bold line) and second (dashed
line) halves of the event.
The peak around 200 m2/s is present during the whole event. On the opposite side, it is clear that the high D distribution is present only at the beginning, its amplitude decreasing by a factor of 3 in the second half.
4.1.2 Integral correlation time
A similar analysis performed with the integral correlation time is shown in Fig. 7. In this case, the two distributions do not change significantly from one period to the other. The only noticeable difference concerns low correlation time val-ues, with an occurrence of more than 20% at time 0.25, fol-lowed by a decrease down to 10% at time 0.75. This suggests that the correlation time becomes very small, even shorter than the temporal resolution of the ACF, when the turbulence is dominated by a high diffusion regime.
At this step of the analysis, we have developed a scenario on how the turbulence characteristics evolve within the struc-tures. Three separate regimes can be distinguished. Before and after the structure observations, a first regime is present, associated to the usual F-region turbulence (D ≈ 400 m2/s). The other two regimes (D ≈ 200, 600 m2/s) are seen only during the structure’s lifetime, the 600 m2/s peak being seen only at the beginning of the event, and close to the center of the structure.
4.2 Turbulence dynamic
In order to detail further the turbulence dynamics as the structures evolve, we separate the D distribution into three intervals with a width of 200 m2/s, each of them centered
Fig. 7. Correlation time in the first (bold line) and second (dashed
line) halves of the event.
around the mean values indicated earlier, namely 200, 400 and 600 m2/s. For each interval we define a weight W
i as: Wi = i+100 X j =i−100 Fj(structure)− i+100 X j =i−100 Fj(F−region),
where F(structure) and F(F−region) are the distribution func-tions associated with the structures and with the average background F-region, respectively.
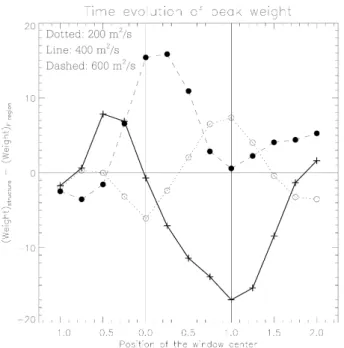
Figure 9 shows the temporal evolution of the weights be-tween normalized times −1.0 and +2.0. The weight asso-ciated with the classical average F-region diffusion regime (D ≈ 400 m2/s) is in a bold line, the low diffusion one (200 m2/s) is in a dotted line and the highest one (600 m2/s) in a dashed line. The vertical thin lines mark the beginning (t = 0) and the end (t = 1) of the structure observations.
For the three curves, the first points have values close to zero and thus show that only usual F-region turbulence is present (Fj(structure)=Fj(F−region)). Just before the start of the demagnetization process, the typical F-region component is enhanced (t = −0.5). The high diffusion regime also starts to appear at t = −0.25, rises rapidly and reaches its maxi-mum value when the structures are generated (at t = 0 and t =0.25). Also at t = −0.25, the classical F-region compo-nent starts to decrease sharply. It seems, therefore, that the process generating the high diffusion regime operates before the structures appear and triggers the plasma demagnetiza-tion.
The high diffusion regime relaxes quickly from t = 0.25. The weight of the average F-region distribution still de-creases and is balanced by an increase in the lower D
distri-1844 R. Andr´e et al.: Turbulence in small-scale expanding structure
Fig. 8. Variation of the three classes of D in the course of the event.
The high diffusive region (dashed line) appears before and seems to trigger the appearance of the structures. The F-region comes back to its average state (bold line) after the end of the event. During the event, it is characterized by a lower D value (dotted line).
bution. At the end of the event (t = 1.0), the high diffusion regime has completely disappeared, the low diffusion regime is at its peak value, while the average F-region diffusion regime is absent, being at its minimum value. After the end of the event, the average F-region weight increases rapidly and comes back to its normal value, indicating that the iono-spheric F-region plasma has returned to its original state. Si-multaneously, the low D regime disappears. The clear an-ticorrelation between the two weights during the structure’s lifetime indicates a close relationship between them. From the temporal variations, we can now propose a detailed sce-nario for the phenomenon. Before the event, the turbulence exhibits the average F-region characteristics, as expected. A few minutes before, the structures are seen by the radar, the high-diffusion regime appears and seems to be associated with a demagnetization process. Simultaneously with the de-crease in the high-diffusion regime, the background plasma evolves toward a low diffusion state which disappears when the plasma becomes magnetized again. The turbulence char-acteristics then come back to typical F-region charchar-acteristics. This scenario suggests that the high-diffusion regime and associated very-low correlation times are related to the en-ergy deposition, which itself generates the observed struc-tures. In Paper 1, the authors have proposed that the demag-netization process can be due to anomalous transport induced by turbulence. Such a mechanism is in complete agreement with the present observations of a high-diffusion regime and short correlation times. The two other D distributions repre-sent two different states of the background ionosphere, with
an usual F-region turbulence when the plasma is magnetized, and a low-diffusion regime when it is collisional. It can be noticed that the value of 200 m2/s found for this regime is similar to the usual D value in the E-region where the plasma is also collisional (Andr´e, 1997).
5 Discussion and conclusion
In this paper, we have applied the collective wave scattering theory (Gr´esillon et al., 1992; Hanuise et al., 1993; Villain et al., 1996) to the small-scale expanding structures presented by Andr´e et al. (2000). The ionospheric turbulence inside the structures has been characterized statistically from the dis-tribution functions of two parameters, namely the turbulent diffusion coefficient and the integral correlation time of the electron density irregularities.
The most important observation is the appearance of a re-gion of very high diffusion coefficient 600 m2/s at the begin-ning of the events. It can be interpreted as the signature of some energy deposition triggering the plasma demagnetiza-tion already presented by Andr´e et al. (2000). Spatially, this region is exclusively co-located with the center of the small-scale expanding structures observed by the radars.
The important phenomenon is the relative variations of the diffusion coefficient, and not their absolute value. As a mat-ter of fact, it appears that D values mentioned in the paper are two orders of magnitude larger than the ambipolar diffusion coefficient, and are of the order of the Bohm diffusion coef-ficient. For a turbulent plasma in the F-region (where colli-sions do not dominate the ions or electrons motion), this co-efficient is estimated to be of the order of 125 m2/s (Gr´esillon et al., 1998). The shape of the ACF power is used to derive the plasma turbulent parameters, and particularly the turbu-lent diffusion coefficient D, as described by Gr´esillon et al. (1992), Hanuise et al. (1993) and Villain et al. (1996). Nev-ertheless, Andr´e et al. (1997) have shown that the values de-pend upon the ratio of the radar frequency to the ionospheric plasma frequency and of the range between the radar and the probed area. This is due to the interactions between the radar wave front and density structures along the propagation path (Valli`eres et al., 2002). This effect becomes important when the radar frequency becomes close to the ionospheric plasma frequency, as was the case (the radar frequency was 9 MHz). Under such conditions, the radar wave decorre-lates more rapidly and the spectral width is enhanced, lead-ing to an artificial increase in D. The magnitude of this bias depends on the propagation path length and on the density structures encountered along it.
For the specific cases studied in this paper, the radar data suggest that the ionosphere did not change on a global scale during the observations. It is thus safe to consider that the propagation path did not vary with time and that the bias due to the propagation was constant during each event. Range values between 1500 and 2400 km were observed for the six events listed in Table 1 of Paper 1, with a mean value around 2000 km. According to Gr´esillon et al. (1998) and
Valli`eres et al. (2002), the variation in D due to propagation effects is of the order of ±50 m2/s around its mean value. It will be taken as the average error induced by the ionospheric propagation on the diffusion coefficient. This means that, in-side the structures, any variation of D much greater than this threshold of ±50 m2/s will be related to modifications in tur-bulence characteristics. Moreover, the increase in diffusion coefficient values is limited to the structure, and observations performed at farther ranges do not exhibit any increase in D. This corroborates the fact that the observed variations are lo-cal and not due to propagation effects (see Paper 1 for de-tails).
In agreement with observations, a possible scenario of the time evolution has been developed as follows. The back-ground plasma exhibits its usual characteristics, both before and after the event, when F-region ions are magnetized. The appearance of a high D value distribution precedes the ap-pearance of the structures and the plasma demagnetization by a few minutes. The distribution relaxes quickly and the as-sociated energy dissipation leads, by heating, to a collisional plasma state. The value of D is of the order of 200 m2/s, which is of the same order of magnitude as the usual E-region (collisional plasma) D values. Finally, the plasma relaxes further toward the average F-region state. The high diffusion regime is certainly related to the anomalous diffusion pro-cess proposed by Andr´e et al. (2000) to explain the plasma demagnetization.
In this paper, we have presented the first application of the collective wave scattering approach to a geophysical phe-nomenon. It demonstrates that the microscale characteristics can bring new insight to the understanding of the global pro-cesses involved.
Acknowledgements. The Stokkseyri and Goose Bay radars are
sup-ported by INSU and NSF Grant ATM 9502993, respectively. The Kapuskasing and Saskatoon radars are funded by NASA 5-1099 and NSERC Canada CSP grant 119615, respectively.
Topical Editor M. Lester thanks W. Bristow and another referee for their help in evaluating this paper.
References
Andr´e, R.: Etude des structures fines de la convection ionosph´erique observ´ees par SuperDARN: Structures `a forte divergence de vitesse, Ph.D. thesis, Univ. d’Orl´eans, Orl´eans, France, 1997. Andr´e, R., Hanuise, C., Villain, J.-P., and Cerisier, J.-C.: HF radars:
Multi-frequency study of refraction effects and localization of
scattering, Radio Sci., 32, 153–168, 1997.
Andr´e, R., Gr´esillon, D., Hanuise, C., and Villain, J.-P.: Auroral ionosphere plasma turbulence transport coefficient: Direct ob-servations from radar coherent backscattering, in: 1998 Inter-national Congress on Plasma Physics, (Ed) Pavlo, P., 22C, pp. 1126–1129, ECA, European Physical Society, 1998.
Andr´e, R., Villain, J.-P., Krassnosel’kikh, V., and Hanuise, C.: Su-perDARN observations of velocity-divergent structures in the F-region ionosphere, J. Geophys. Res., 105, 20 869–20 884, 2000. Bythrow, P., Burke, W., Potemra, T., Zanetti, L., and Lui, A.:
Iono-spheric evidence for irregular reconnection and turbulent plasma flows in the magnetotail during periods of northward interplane-tary magnetic field, J. Geophys. Res., 90, 5319–5325, 1985. Feldstein, Y. I. and Starkov, G. V.: Dynamics of auroral belt and
polar geomagnetic disturbances, Planet. Space Sci., 15, 209–229, 1967.
Greenwald, R., Baker, K., Hutchins, R., and Hanuise, C.: An HF phased array radar for studying small-scale structure in the high-latitude ionosphere, Radio Sci., 20, 63–79, 1985.
Greenwald, R. A., Baker, K. B., Dudeney, J. R., Pinnock, M., Jones, T. B., Thomas, E. C., Villain, J.-P., Cerisier, J.-C., Senior, C., Hanuise, C., Hunsucker, R. D., Sofko, G. J., Koehler, J., Nielsen, E., Pellinen, R., Walker, A. D. M., Sato, N., and Yamagashi, H.: DARN/SuperDARN: A global view of the dynamics of high latitude convection, Space Sci. Rev., 71, 761–796, 1995. Gr´esillon, D., Cabrit, B., Villain, J.-P., Hanuise, C., truc, A.,
Lavi-ron, C., Hennequin, P., Gervais, F., Quemeneur, A., Garbet, X., Payan, J., and Devynck, P.: Collective scattering of electromag-netic waves and cross-B plasma diffusion, Plasm. Phys. Contr. Fus., 34, 1985–1991, 1992.
Gr´esillon, D., Andr´e, R., Bonnet, J., Cabrit, B., Hanuise, C., Hen-nequin, P., Honor´e, C., Laviron, C., Truc, A., Villain, J., and Zou, X.: Combined scattering as a diagnostic of turbulent dynamics in gas flow, auroral plasmas and tokamak plasmas, in: International Conference Physics at the turn of the 21st century, 1998. Hanuise, C., Villain, J.-P., Gr´esillon, D., Cabrit, B., Greenwald,
R. A., and Baker, K. B.: Interpretation of HF radar doppler spec-tra by collective wave scattering theory, Ann. Geophysicae, 11, 29–39, 1993.
Sofko, G., Greenwald, R., and Bristow, W.: Direct determination of large-scale magnetospheric field-aligned currents with Super-DARN, Geophys. Res. Lett., 22, 2041–2044, 1995.
Valli`eres, X., Villain, J.-P., and Andr´e, R.: Characterization of fre-quency effect in superdarn spectral width distributions, Radio Sci., 38, 1003–1019, 2003.
Villain, J.-P., Andr´e, R., Hanuise, C., and Gr´esillon, D.: Observa-tion of the high latitude ionosphere by HF radars: InterpretaObserva-tion in terms of collective wave scattering and characterization of tur-bulence, J. Atmos. Terr. Phys., 58, 943–958, 1996.