HAL Id: hal-00317187
https://hal.archives-ouvertes.fr/hal-00317187
Submitted on 1 Jan 2002
HAL is a multi-disciplinary open access
archive for the deposit and dissemination of
sci-entific research documents, whether they are
pub-lished or not. The documents may come from
teaching and research institutions in France or
abroad, or from public or private research centers.
L’archive ouverte pluridisciplinaire HAL, est
destinée au dépôt et à la diffusion de documents
scientifiques de niveau recherche, publiés ou non,
émanant des établissements d’enseignement et de
recherche français ou étrangers, des laboratoires
publics ou privés.
Solar Cycle variations of ?oF2 from IGY to 1990
N. K. Sethi, M. K. Goel, K. K. Mahajan
To cite this version:
N. K. Sethi, M. K. Goel, K. K. Mahajan. Solar Cycle variations of ?oF2 from IGY to 1990. Annales
Geophysicae, European Geosciences Union, 2002, 20 (10), pp.1677-1685. �hal-00317187�
Annales
Geophysicae
Solar Cycle variations of foF2 from IGY to 1990
N. K. Sethi, M. K. Goel, and K. K. MahajanRadio and Atmospheric Sciences Division, National Physical
Received: 19 November 2001 – Revised: 27 March 2002 – Accepted: 24 April 2002
Abstract. Noontime monthly median values of F2-layer
critical frequency foF2 (m) for some ionospheric stations representing low- and mid-latitudes are examined for their dependence on solar activity for the years 1957 (IGY) to 1990. This is the period for which ionospheric data in digital form is available in two CD-ROMs at the World Data Cen-ter, Boulder. It is observed that at mid-latitudes, foF2 (m) shows nearly a linear relationship with R12 (the 12-month running average of the Zurich sunspot number), though this relation is nonlinear for low-latitudes. These results indicate some departures from the existing information often used in theoretical and applied areas of space research.
Key words. Ionosphere (equatorial ionosphere; mid-latitude ionosphere; modelling and forecasting)
1 Introduction
Electron concentration in the F2-region of the ionosphere is primarily due to ionization of the neutral atmosphere by the solar UV radiations. These radiations are now known to show very definitive solar cycle variations. Consequently, electron concentrations and thus, the critical frequency of the F2-region (foF2) is also expected to reflect these variations. Although there were no solar UV measurements during the early years of ionospheric research, sunspots data for sev-eral decades were available and solar cycle changes in foF2 were detected in the very beginning of ionospheric research (see Mitra, 1952 for early works). In fact, excellent corre-lations between the sunspot number and the monthly mean
foF2 were reported and a detailed analysis of ionosonde data
for several stations by Jones and Gallet (1962, 1965) and later by Rush et al. (1983, 1984) helped in generating global maps of foF2 as a function of sunspot number and other geophysi-cal parameters. These maps have since been used by interna-tional organizations like CCIR and URSI as predictive tools for HF propagation. An important feature of these predictive
Correspondence to: N. K. Sethi (mksethi@csnpl.ren.nic.in)
models is that foF2 saturates or increases very slowly at all stations for R12 (12-month running average of sunspot num-ber) more than 150 units. This saturation, however, is not ex-pected from theory, since there is no evidence that solar UV flux saturates at high solar activity. On the other hand, Huang (1960) in a detailed analysis of foF2 data for the period 1954 to 1958 from stations in the eastern sector concluded that
foF2 saturation is subject to diurnal and geophysical
varia-tions. The foF2-R12 plots published by him show that foF2 does not always saturate at all stations for R12=150. Noon-time foF2-R12 plots for several stations, with geomagnetic latitudes varying from 48◦S to 83◦N for the period 1954– 1964 published by Rao and Rao (1969) do not show much evidence of foF2 saturation for R12 above 150 units for all the stations.
However, all the above studies were based on a lim-ited data set, involving either one solar cycle or a part of it. Ionospheric data from several stations are now avail-able in two CD-ROMs, covering the period from 1957, the International Geophysical Year (IGY), to 1990. In the present paper, we have studied the foF2 (m) data ob-tained from these CD-ROMs for a few stations, covering low- to mid-latitudes, namely Maui (20.8◦N, 203.5◦E),
Chungli (24.9◦N, 121.2◦E), Poitiers (46.6◦N, 0.3◦E),
Slough (51.5◦N, 359.4◦E) and Moscow (55.5◦N, 37.3◦E). We have also used the data for the Indian station Kodaikanal (10.2◦N, 77.5◦E). Results of our analysis of 30 years of ionospheric data for the above mentioned stations indicate some departures from the existing information on the noon-time R12-foF2 relationship, often used in theoretical and ap-plied areas of space research. This paper presents an im-provement on the existing information.
2 Database
We have used the Ionospheric database available on the two CD-ROMS obtained from the World Data Center, Boulder and the Ionosperic data bulletins published by the National
1678 N. K. Sethi et al.: Solar Cycle variations of foF2 from IGY to 1990
0
50
100
150
200
R125
10
15
fo F2 / M H z Obs. Kodaikanal, (10.2 N), 1957-90, Summer Fit0
50
100
150
200
R124
5
6
7
8
9
10
fo F2 / M H z Obs. Poitiers, (46.6 N), 1957-90, Summer Fit0
50
100
150
200
R125
10
15
fo F2 / M H z Maui , (20.8 N), 1957-90, Summer Obs. Fit0
50
100
150
200
R124
5
6
7
8
9
10
fo F2 / M H z Slough, (51.5 N), 1957-90, Summer Obs. Fit0
50
100
150
200
R125
10
15
fo F2 / M H z Chungli , (24.9 N), 1957-90, Summer Obs. Fit0
50
100
150
200
R124
5
6
7
8
9
10
fo F2 / M H z Moscow, (55.5 N), 1957-90, Summer Obs. FitFig. 1. Shows the plots of observed monthly median noon foF2 values against R12 during summer. The regression fits are shown as solid
0
50
100
150
200
R125
10
15
20
fo F2 / M H z Obs. Kodaikanal, (10.2 N), 1957-90, Winter Fit0
50
100
150
200
R125
10
15
20
fo F2 / M H z Obs. Poitiers, (46.6 N), 1957-90, Winter Fit0
50
100
150
200
R125
10
15
20
fo F2 / M H z Maui, (20.8 N), 1957-90, Winter Obs. Fit0
50
100
150
200
R125
10
15
20
fo F2 / M H z Slough, (51.5 N), 1957-90, Winter Obs. Fit0
50
100
150
200
R125
10
15
20
fo F2 / M H z Chungli, (24.9 N), 1957-90, Winter Obs. Fit0
50
100
150
200
R125
10
15
20
fo F2 / M H z Moscow, (55.5 N), 1957-90, Winter Obs. Fit1680 N. K. Sethi et al.: Solar Cycle variations of foF2 from IGY to 1990
0
50
100
150
200
R125
10
15
20
fo F2 / M H z Obs. Kodaikanal, (10.2 N), 1957-90, Equinox Fit0
50
100
150
200
R124
8
12
16
fo F2 / M H z Obs. Poitiers, (46.6 N), 1957-90, Equinox Fit0
50
100
150
200
R125
10
15
20
fo F2 / M H z Maui, (20.8 N), 1957-90, Equinox Obs. Fit0
50
100
150
200
R124
8
12
16
fo F2 / M H z Slough, (51.5 N), 1957-90, Equinox Obs. Fit0
50
100
150
200
R125
10
15
20
fo F2 / M H z Chungli, (24.9 N), 1957-90, Equinox Obs. Fit0
50
100
150
200
R124
8
12
16
fo F2 / M H z Moscow, (55.5 N), 1957-90, Equinox Obs. Fit0
50
100 150 200 250
R125
10
15
fo F2 / M H z Kodaikanal, (10.2 N), 1957-90, Summer Fit CCIR IRI0
50
100 150 200 250
R124
5
6
7
8
9
10
fo F2 / M H z Poitiers, (46.6 N),1957-90, Summer Fit CCIR IRI0
50
100 150 200 250
R125
10
15
fo F2 / M H z Maui, (20.8 N), 1957-90, Summer Fit CCIR IRI0
50
100 150 200 250
R124
5
6
7
8
9
10
fo F2 / M H z Slough, (51.5 N), 1957-90, Summer Fit CCIR IRI0
50
100 150 200 250
R125
10
15
fo F2 / M H z Chungli, (24.9 N), 1957-90, Summer Fit CCIR IRI0
50
100 150 200 250
R124
5
6
7
8
9
10
fo F2 / M H z Moscow, (55.5 N), 1957-90, Summer Fit CCIR IRIFig. 4. Shows the variation of regressions fits with R12 along with the CCIR and IRI models for summer. Low- and mid-latitude stations are
1682 N. K. Sethi et al.: Solar Cycle variations of foF2 from IGY to 1990
0
50
100 150 200 250
R125
10
15
20
fo F2 / M H z Kodaikanal, (10.2 N), 1957-90, Winter Fit CCIR IRI0
50
100 150 200 250
R125
10
15
20
fo F2 / M H z Poitiers, (46.6 N), 1957-90, Winter Fit CCIR IRI0
50
100 150 200 250
R125
10
15
20
fo F2 / M H z Maui, (20.8 N), 1957-90, Winter Fit CCIR IRI0
50
100 150 200 250
R125
10
15
20
fo F2 / M H z Slough, (51.5 N), 1957-90, Winter Fit CCIR IRI0
50
100 150 200 250
R125
10
15
20
fo F2 / M H z Chungli, (24.9 N), 1957-90, Winter Fit CCIR IRI0
50
100 150 200 250
R125
10
15
20
fo F2 / M H z Moscow, (55.5 N), 1957-90, Winter Fit CCIR IRI0
50
100 150 200 250
R125
10
15
20
fo F2 / M H z Kodaikanal, (10.2 N), 1957-90, Equinox Fit CCIR IRI0
50
100 150 200 250
R124
8
12
16
fo F2 / M H z Poitiers, (46.6 N), 1957-90, Equinox Fit CCIR IRI0
50
100 150 200 250
R125
10
15
20
fo F2 / M H z Maui, (20.8 N), 1957-90, Equinox Fit CCIR IRI0
50
100 150 200 250
R124
8
12
16
fo F2 / M H z Slough, (51.5 N), 1957-90, Equinox Fit CCIR IRI0
50
100 150 200 250
R125
10
15
20
fo F2 / M H z Chungli, (24.9 N), 1957-90, Equinox Fit CCIR IRI0
50
100 150 200 250
R124
8
12
16
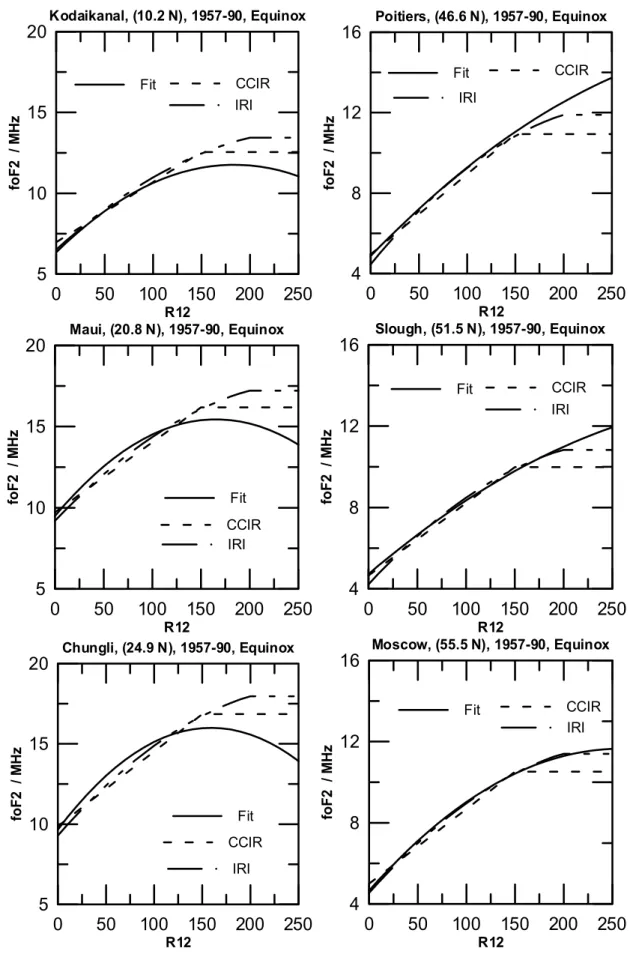
fo F2 / M H z Moscow, (55.5 N), 1957-90, Equinox Fit CCIR IRI1684 N. K. Sethi et al.: Solar Cycle variations of foF2 from IGY to 1990 Physical Laboratory (NPL), New Delhi, India. These
bul-letins contain ionospheric data for Indian stations. In the present paper, we have selected six stations covering loca-tions from low- to mid-latitudes for the period 1957–1990. The quality of data for these locations is known to be ex-cellent, since these data have undergone some stringent tests to bring these to a “highest possible level of correctness be-fore being archived and made available to users” (NGDC, 1994), and the data for most of the stations exist on a con-tinuous basis for more than 30 years. The noontime monthly median foF2 (m) values have been examined with respect to their dependence on conventional solar index R12 (12-month running average of sunspot number). We have selected the months of June, April and January as representatives of sum-mer, equinox and winter seasons respectively.
3 Analysis and results
In order to determine the relationships between the foF2 (m) and R12, a regression analysis was carried out for each sta-tion, and it was observed that the relationship is nearly lin-ear at mid-latitudes. For low-latitudes, a second degree fit gives a better correlation. This is demonstrated in Fig. 1 to 3, where the variation of foF2 (m) with R12 is shown for sum-mer, winter and equinox respectively. These figures contain both the observed data and regression fits. It can be observed from Fig. 1–3 (right panels) that at mid-latitudes, foF2 (m) varies more or less linearly with R12, right up to the high-est level of solar activity recorded so far. However, during summer, the variation of foF2 (m) with R12 is nonlinear. At low-latitudes (left panels), however, foF2 (m) shows more or less a quadratic variations with R12 up to around 150 during all the seasons. After R12 of 150 it is observed that during winter and equinox, foF2 (m) either shows saturation or a de-crease. However, in summer, the increase of foF2 (m) with R12 is faster at lower levels of solar activity and very slow at higher levels.
Since the linear relationship seen by us between foF2 (m) and R12 was observed only at mid-latitudes, we examined
foF2 (m) data for a few more mid-latitude stations
(Washing-ton (38.7◦N, 252.1◦E), Boulder (40.0◦N, 254.7◦E), Ros-tov (47.2◦N, 39.7◦E)). Here too similar behaviour was ob-served.
4 Comparison with empirical models
International Reference Ionosphere (IRI) is the most widely used empirical model for upper atmospheric studies and is being updated and improved off and on following the annual IRI Workshops. This model used the CCIR coefficients up to its 1990 version (Bilitza, 1990). This version, as expected, shows foF2 (m) saturation for R12 above 150 units. In the 1995 version, the solar index R12 was replaced by the iono-spheric index IG12 (Bilitza, 1997) and it shows foF2 (m) saturation for R12 above 200. The latest IRI model (Bil-itza, 2001) again uses the ionospheric index IG12 in place
of solar index R12. Figures 4–6 show the comparisons of regression curves with the CCIR and IRI models at all the six stations for summer, winter and equinox respectively. It can be observed from these figures that during all the sea-sons, for low-latitudes (left panels), the agreement between the observed fit and the models is fairly good at low solar ac-tivity, with somewhat lower values for models. During high solar activity, it can be noticed that in the observed fit, there is a tendency of either saturation or fall in foF2 (m) after R12 of 150, in agreement with CCIR, whereas IRI shows satura-tion beyond R12 of 200. Further, it can be seen that during equinox, the observed fit shows lower values of foF2 (m) at high solar activity as compared to model values. For mid-latitudes, as seen in Figs. 4–6 (right panels), the agreement between the IRI and the observed fit is found to be fairly good for summer and winter months, during the low solar activity periods. This agreement becomes excellent during equinox, right up to R12 of 200. However, CCIR shows saturation for R12 above 150 units. During high solar activity, as shown in the right panels of Figs. 4–6, foF2 (m) values of the fit are higher than those obtained from the IRI, especially during winter and summer months. It is to be noted that both the CCIR and IRI show the saturation effect in foF2 (CCIR be-yond R12 of 150 and IRI bebe-yond R12 of 200). It seem to us that the saturation effect may not occur at all at mid-latitudes, even beyond R12 > 200. This can be inferred from the fig-ures if the observed values are extrapolated for R12 beyond 200. However, some stations like Slough and Moscow might be the exceptions during summer.
5 Conclusion
Detailed analyses of a long series of solar and ionospheric observations indicate that foF2 (m) at mid-latitudes increases linearly with R12 right up to the highest level of solar activ-ity so far. However, at low-latitudes, the observed foF2 (m) values show a tendency to saturate, and in some cases even fall beyond a certain level of solar activity during all the sea-sons. Comparative studies with the CCIR and IRI show, in general, a fairy good agreement with the observed foF2 dur-ing low solar activity period. However, major discrepancies exist during high solar activity period, at both the low- and mid-latitudes, especially for equinox and winter months re-spectively. The observations do not provide much evidence of foF2 saturation at mid-latitudes.
Acknowledgements. We are thankful to World Data Center for
sup-plying us with two CD-ROMs containing ionospheric data. K. K. Mahajan is thankful to the Council of Scientific and Industrial Re-search (CSIR) for the award of Emeritus Scientist position during the progress of this work.
Topical Editor M. Lester thanks two referees for their help in evaluating this paper.
References
Bilitza, D.: (Ed) NSSDC 90–22, World Data Center A, Rockets and Satellites Greenbelt, Md, USA, November, 1990.
Bilitza, D.: International Reference Ionosphere – Status 1995/96, Adv. Space Res., 20, 9, 1751–1754, 1997.
Bilitza, D.: International Reference Ionosphere 2000, Radio Sci-ence, 36, 2, 261–275, 2001.
Huang, C.-M.: Some abnormalities in the variations of F2-layer critical frequency during the period of high solar activity of solar cycle 8–19, J. Geophys. Res., 65, 897–906, 1960.
Jones, W. B. and Gallet, R. M.: The representation of diurnal and geographic variations of ionospheric data by numerical methods, Telecomm. J., 29, 129–147, 1962.
Jones, W. B. and Gallet, R. M.: The representation of diurnal and
geographic variations of ionospheric data by numerical methods, Telecomm. J., 32, 18–28, 1965.
Mitra, S. K.: The Upper Atmosphere, 2nd edition, The Asiatic So-ciety, Calcutta, 1952.
NGDC: National Geophysical Data Center, NOAA, Mail Code E / GC2, 325 Broadway, Boulder, Colorado, 80303 USA., 1994. Rao, M. S. V. G. and Rao, R. S.: The hysteresis variation in F2-layer
parameters, J. Atmos. Terr. Phys., 31, 1119–1125, 1969. Rush, C. M., PoKempner, M., Anderson, D. N., Stewart, F. G.,
and Perry, J.: Improving ionospheric maps using theoretically derived values of foF2, Radio Science, 18, 95–107, 1983. Rush, C. M., PoKempner, M., Anderson, D. N., Perry, J.,
Stew-art, F. G., and Reasoner, R.: Maps of foF2 derived from observa-tions and theoretical data., Radio Science, 19, 1083–1097, 1984.