HAL Id: hal-00328257
https://hal.archives-ouvertes.fr/hal-00328257
Submitted on 10 Oct 2008HAL is a multi-disciplinary open access
archive for the deposit and dissemination of sci-entific research documents, whether they are pub-lished or not. The documents may come from teaching and research institutions in France or abroad, or from public or private research centers.
L’archive ouverte pluridisciplinaire HAL, est destinée au dépôt et à la diffusion de documents scientifiques de niveau recherche, publiés ou non, émanant des établissements d’enseignement et de recherche français ou étrangers, des laboratoires publics ou privés.
Halogenated organic species over the tropical rainforest
S. Gebhardt, Aurélie Colomb, R. Hofmann, J. Williams, J. Lelieveld
To cite this version:
S. Gebhardt, Aurélie Colomb, R. Hofmann, J. Williams, J. Lelieveld. Halogenated organic species over the tropical rainforest. Atmospheric Chemistry and Physics Discussions, European Geosciences Union, 2008, 8 (1), pp.1159-1190. �hal-00328257�
ACPD
8, 1159–1190, 2008
Halocarbons over the rainforest S. Gebhardt et al. Title Page Abstract Introduction Conclusions References Tables Figures ◭ ◮ ◭ ◮ Back Close
Full Screen / Esc
Printer-friendly Version Interactive Discussion
EGU Atmos. Chem. Phys. Discuss., 8, 1159–1190, 2008
www.atmos-chem-phys-discuss.net/8/1159/2008/ © Author(s) 2008. This work is licensed
under a Creative Commons License.
Atmospheric Chemistry and Physics Discussions
Halogenated organic species over the
tropical rainforest
S. Gebhardt1, A. Colomb2, R. Hofmann1, J. Williams1, and J. Lelieveld1
1
Max Planck Institute for Chemistry, Mainz, Germany
2
Laboratoire Interuniversitaire des Syst `emes Atmosph ´eriques (LISA), Paris, France
Received: 13 November 2007 – Accepted: 7 December 2007 – Published: 23 January 2008 Correspondence to: J. Williams ([email protected])
ACPD
8, 1159–1190, 2008
Halocarbons over the rainforest S. Gebhardt et al. Title Page Abstract Introduction Conclusions References Tables Figures ◭ ◮ ◭ ◮ Back Close
Full Screen / Esc
Printer-friendly Version Interactive Discussion
EGU
Abstract
Airborne measurements of the halogenated trace gases methyl chloride, methyl bro-mide and chloroform were conducted over the Atlantic Ocean and 1000 km of pris-tine tropical rainforest in Suriname and French Guyana (3–6◦N, 51–59◦W) in October 2005. In the boundary layer (0–1.4 km), maritime air masses initially low in forest hy-5
drocarbons, advected over the forest by southeasterly trade winds, were measured at various distances from the coast. Since the organohalogens presented here have rel-atively long atmospheric lifetimes (0.4–1.0 years) in comparison to the transport times (1–2 days), emissions will accumulate in air traversing the rainforest. The distribu-tions of methyl chloride, methyl bromide and chloroform were analyzed as a function 10
of forest contact time and the respective relationship used to determine fluxes from the rainforest during the long dry season.
Emission fluxes have been calculated for methyl chloride and chloroform as 9.4 (±4.0 2σ) and 0.34 (±0.14 2σ) µg m−2h−1, respectively. No significant flux from
the rainforest was observed for methyl bromide within the limits of these measure-15
ments. The flux of methyl chloride was in general agreement with the flux measured over the same region in March 1998 during the LBA Claire project using a different an-alytical system. This confirms that the rainforest is a strong source for methyl chloride and suggests that this emission is relatively uniform throughout the year. In contrast the chloroform flux derived here is a factor of three less than previous measurements 20
made in March 1998 suggesting a pronounced ecosystem variation. The differences in chloroform fluxes could not be attributed to either temperature or rainfall changes. The global extrapolation of the derived fluxes led to 1.5 (±0.6 2σ) Tg yr−1 for methyl
chlo-ride, which is in the range of the missing source postulated by previous model studies and 55 (±22 2σ) Gg yr−1 for chloroform.
ACPD
8, 1159–1190, 2008
Halocarbons over the rainforest S. Gebhardt et al. Title Page Abstract Introduction Conclusions References Tables Figures ◭ ◮ ◭ ◮ Back Close
Full Screen / Esc
Printer-friendly Version Interactive Discussion
EGU
1 Introduction
Halogenated organic compounds have been shown to be important to the chemistry of both the troposphere and the stratosphere (WMO, 2007a). Since these compounds have relatively long atmospheric lifetimes they can effectively transport halogen atoms from surface sources to the stratosphere, and thereby significantly contribute to strato-5
spheric ozone loss (WMO, 2003; Levine et al., 2007). Because the anthropogenic contribution to the organohalogen budget is now restricted by the Montreal Protocol, the ambient concentrations of many such halogenated compounds are stabilizing or declining (WMO, 2003). Therefore the relative influence of naturally produced halo-carbons is becoming more important for the budget of ozone depleting substances. 10
Methyl chloride (CH3Cl) and methyl bromide (CH3Br) are both in part naturally emitted
and the most abundant chlorine and bromine containing gases in the troposphere re-spectively. Currently CH3Cl contributes up to 16% to the tropospheric organic chlorine and CH3Br up to about 50% to the organic bromine (WMO, 2003). It is estimated that
the contribution of natural CH3Cl and CH3Br to the equivalent effective stratospheric
15
chlorine will rise to more than 50% (currently 23%) until 2050 (WMO, 2007a). Despite its small total contribution to the stratospheric ozone loss chloroform (CHCl3) is an
im-portant natural source of tropospheric chlorine. Therefore it is imim-portant to determine the global budgets of these compounds.
The global average concentration of CH3Cl is approximately 550±30 pmol mol−1with
20
higher mixing ratios observed at low latitudes (Thompson et al., 2004). Small down-ward trends have been reported recently from the AGAGE measuring sites (Simmonds et al., 2004). According to the emission data provided by WMO (2007b) and references therein, the sources and sinks of CH3Cl are as shown in Table 1. Earlier global budget
estimates indicated that biomass burning was the main source (WMO, 1999), however, 25
after Keene et al. (1999) and Butler (2000) highlighted an imbalance in the budget of this species, a new dominant source of methyl chloride from tropical vegetation was discovered by Yokouchi et al. (2002) and subsequently verified by airborne field
mea-ACPD
8, 1159–1190, 2008
Halocarbons over the rainforest S. Gebhardt et al. Title Page Abstract Introduction Conclusions References Tables Figures ◭ ◮ ◭ ◮ Back Close
Full Screen / Esc
Printer-friendly Version Interactive Discussion
EGU surements of Scheeren et al. (2003). Although the sources of methyl chloride appear to
balance the sinks large uncertainties remain regarding the nature of the tropical source since few measurements are available from this region.
Although much less abundant than the chloride, methyl bromide concentrations are of great interest, because it has a 25 times higher ozone depletion potential than methyl 5
chloride (WMO, 2007a). Due to emission restrictions related to the Montreal Protocol the global average concentration is decreasing from peak values of 9.2 pmol mol−1 in 1999 to currently about 7.9 pmol mol−1 (WMO, 2007b). A summary of the present un-derstanding of sources and sinks of methyl bromide is given in Table 1. A discrepancy of 45 Gg yr−1remains as a “missing source” which may be located in the thus far poorly 10
characterized tropical regions. Conversely, it is also conceivable that the atmospheric lifetime of methyl bromide has been underestimated, which would help to explain the imbalance between sources and sinks (Reeves, 2003).
The budget of CHCl3 is reasonably balanced within the uncertainties and was re-cently summarized by McCulloch (2003) (see Table 1 for summary). The global dis-15
tribution of CHCl3 is strongly biased between the two hemispheres with 1.7 times
higher mixing ratios found in the Northern Hemisphere (Khalil and Rasmussen, 1999a). Antarctic firn air measurements (Trudinger et al., 2004) show a steady increase from 4 pmol mol−1 around 1940 to peak values of 6.5 pmol mol−1 in 1990. After the use of CHCl3 in pulp and paper production was reduced, global observations show a 20
downward trend. Global average mixing ratios of 18.5 pmol mol−1 between 1985 and 1995 (Khalil and Rasmussen, 1999a) decreased to average background levels of 8.9 (±0.1) pmol mol−1 in the years 1994–1998 (O’Doherty et al., 2001). However, a
recent model study suggests that a higher anthropogenic contribution (41–50% of the global sources) before 1990, and 25–29% in 2001 would explain the global observa-25
tions better (Worton et al., 2006).
To gain a better understanding of the global distribution of the missing sources of CH3Cl and CH3Br several model studies have been conducted. Lee-Taylor et al. (2001)
ACPD
8, 1159–1190, 2008
Halocarbons over the rainforest S. Gebhardt et al. Title Page Abstract Introduction Conclusions References Tables Figures ◭ ◮ ◭ ◮ Back Close
Full Screen / Esc
Printer-friendly Version Interactive Discussion
EGU tropical terrestrial source of 2330–2430 Gg yr−1and reduced Southeast Asian biomass
burning emissions. The inverse model study of Yoshida et al. (2006) suggests an seasonally invariant missing source of 2900 Gg yr−1located in the tropics (30◦N–30◦S)
to explain the observed distribution.
Furthermore Lee-Taylor et al. (1998) find that the annual observations of CH3Br
5
are best represented if a terrestrial source of 89–104 Gg yr−1 is assumed located 50 to 71% in the Southern Hemisphere. A later 3-D global chemical transport model run performed by Warwick et al. (2006) used increased biomass burning emissions (+20 Gg yr−1) and an additional tropical (40◦N–40◦S) vegetation source of 45.6 Gg yr−1
CH3Br to reproduce the annual observations.
10
Tropical rainforest regions are important to investigate for organohalogens, not only because few measurements have been made so far but also their proximity to the ITCZ (Inter Tropical Convergence Zone) means that any emission there will have a strong chance of being transported into the stratosphere by the regionally prevalent deep con-vection. We present large-scale airborne measurements of the organohalogen species 15
methyl chloride, methyl bromide and chloroform over the rainforest of Suriname and French Guyana during the dry season (October) 2005. The vertical and horizontal dis-tributions of these species are analyzed and fluxes from the rainforest are determined. The influence of biomass burning and entrained air on the derived fluxes is discussed and an extrapolation to the global scale made based on the new data.
20
2 Sampling and analysis
2.1 Sample collection
In total 99 pressurised air samples were collected during 10 flights between 0–11 km over the tropical rainforest (see Fig. 1) using an automated air sampling system devel-oped and built at the Max Planck Institute for Chemistry, Mainz. The system consisted 25
in-ACPD
8, 1159–1190, 2008
Halocarbons over the rainforest S. Gebhardt et al. Title Page Abstract Introduction Conclusions References Tables Figures ◭ ◮ ◭ ◮ Back Close
Full Screen / Esc
Printer-friendly Version Interactive Discussion
EGU stalled within an adapted wingpod on a Lear jet aircraft (Learjet 35A D-CGFD
oper-ated by GFD, Hohn, Germany and Enviscope GmbH, Frankfurt, Germany). The entire sampling system was constructed from1/4” (=0.635 cm) o.d. stainless steel tubing and
connectors (Swagelok, Solon OH, USA). The in– and outlet valves of the canisters were actuated by electric valves (Clippard–24V, Fluitronics, D ¨usseldorf, Germany). An 5
aircraft metal bellows pump (Senior Aerospace, Herfordshire, UK) was used to draw ambient air through the inlet, flush all tubing throughout the flight and, when the fill valve was activated, to pressurise the canister to at least 3 bar (3000 hPa). Canisters were filled sequentially at 10-min intervals, and depending on the ambient atmospheric pres-sure, filling took from less than 25 s at 500 m to around 60 s at 8.5 km. Prior to flight, the 10
canister module was evacuated to 10−4hPa and directly after landing the filled
mod-ule was transferred to the laboratory for immediate (<48 h) analysis by GC-MS. Three
identical modules were built, allowing flights to be performed in quick succession. Pres-sure, temperature and valve status were controlled and logged by a computer within the wingpod.
15
2.2 Instrumental set up
The instrumentation used for the canister analysis consisted of a gas chromatograph – mass spectrometer system (GC/MS 6890/5973, Agilent Technologies, Palo Alto CA, USA), modified from the commercial version for analysis of low-level ambient air sam-ples (Gros et al., 2003). The sample was introduced into the sampling inlet, dried by 20
flushing through a magnesium perchlorate filled tube heated to 100◦C, prefocussed by
a cryo-concentrator unit (1/16” ss line filled with glass beads, cooled to −70◦C) and af-terwards flushed into the GC. The separating column was a 60 m∗0.248 mm∗1 µm DB-5 capillary column (J&W Scientific, Agilent Technologies, Palo Alto CA, USA). The chro-matography parameters were optimised to enable good separation of circa 35 identified 25
compounds; a complete run took about 20 min. The mass spectrometer was operated in Single Ion Mode (SIM) to achieve maximum sensitivity. Post flight, the filled canister module was attached to the GC-MS system and the analysis proceeded semi
auto-ACPD
8, 1159–1190, 2008
Halocarbons over the rainforest S. Gebhardt et al. Title Page Abstract Introduction Conclusions References Tables Figures ◭ ◮ ◭ ◮ Back Close
Full Screen / Esc
Printer-friendly Version Interactive Discussion
EGU matically within 48 h. The detection limit was defined as three times the standard
devi-ation of the noise (for the specific ion at its specific retention time). It was found to be 0.14 pmol mol−1for chloroform, 0.51 pmol mol−1for methyl bromide and 1.9 pmol mol−1 for methyl chloride. The overall uncertainty was calculated based on the peak integra-tion accuracy, the accuracy of the calibraintegra-tion standard (5%) and its precision (1–5%) 5
and resulted in 7% for CH3Cl, 8% for CHCl3and 11% for CH3Br.
2.3 Calibration
Calibrations were performed against a whole air working standard, prepared by filling an aluminium cylinder with ambient suburban air using a three-stage oil-free piston compressor (RIX industries, Benicia CA, USA) modified after Mak and Brenninkmei-10
jer (1994). This cylinder was calibrated relative to a NIST primary standard at the National Centre for Atmospheric Research (NCAR, Boulder CO, USA). The working standard was analysed every five measurements. The average response factor of these analyses was used to calibrate the samples measured in between. At least one blank (using the same analytical procedure but without collecting an air sample) was 15
performed at the start of each measurement sequence, and showed a generally clean baseline. Linearity of the system was confirmed in the range of measured concentra-tions.
3 Results and discussion
3.1 Meteorological conditions in Suriname 20
The northeast coast of South America is an excellent location to study the effects of the tropical rainforest on atmospheric trace gas composition. Meteorological conditions in this region are controlled by the very steady trade winds and the annual migration of the Inter-Tropical Convergence Zone (ITCZ). The data presented here were collected
ACPD
8, 1159–1190, 2008
Halocarbons over the rainforest S. Gebhardt et al. Title Page Abstract Introduction Conclusions References Tables Figures ◭ ◮ ◭ ◮ Back Close
Full Screen / Esc
Printer-friendly Version Interactive Discussion
EGU from the 6th to the 13th of October 2005 within the Guyanas Atmosphere-Biosphere
ex-change and Radicals Intensive Experiment with the Learjet (GABRIEL) project. During this time of the year – the long dry season – the ITCZ was located a few degrees north of the Guyanas at approximately 10–15◦N (see Fig. 1). Thus, although geographically in the Northern Hemisphere, Suriname (3–6◦N, 51–59◦W) was atmospherically speak-5
ing located in the Southern Hemisphere. The location and height of all measurements is shown in Fig. 1.
The boundary layer height during the day, which is important in calculating the emis-sion flux, was determined using fluctuations in the static air temperature (correspond-ing to the temperature inversions) measured from the aircraft when ascend(correspond-ing. The 10
temperature was recorded by the Enviscope analogue data acquisition system. The derived boundary layer grew from around 600 m around 09:30 local time (UTC-3 h) to 1200 m at 12:30 stabilizing around 1400 m in the afternoon (G. Eerdekens, personal communication). Because most of our measurements took place during midday or early afternoon, we considered an average boundary layer height of 1400±100 m. 15
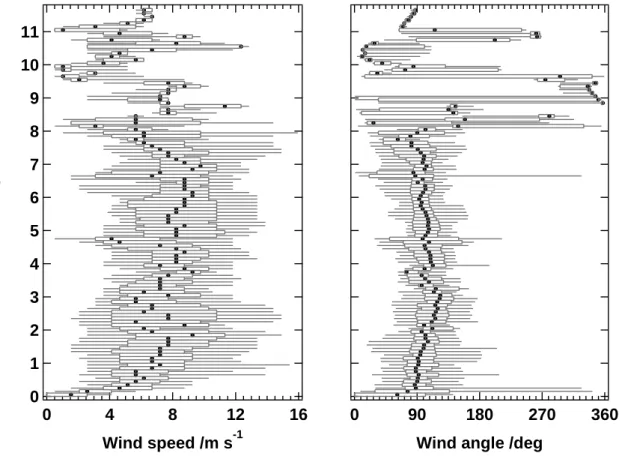
During the campaign the meteorological conditions were generally stable with only occasional short thunderstorms. The prevailing wind direction in the boundary layer was easterly (95◦), with average wind speeds of 5.8 m s−1, which is typical of the trade winds. Closer to the surface the wind weakened and veered to a more northeasterly direction, probably as a result of the increased friction within the boundary layer. Wind 20
speed and direction as a function of altitude are shown in Fig. 2. The data are 100 m binned average values of the 1 Hz data obtained by the aircraft flight management system via ARINC429. From Fig. 3 it can be seen that during the campaign maritime air masses, initially low in forest hydrocarbons, were advected from the Atlantic Ocean and then over approximately 1000 km of pristine rainforest. The 10-day back trajectories of 25
the boundary layer samples are shown in Fig. 3. These indicate that air arriving at the coast of French Guyana and Suriname was transported for the most part within the Southern Hemisphere.
ACPD
8, 1159–1190, 2008
Halocarbons over the rainforest S. Gebhardt et al. Title Page Abstract Introduction Conclusions References Tables Figures ◭ ◮ ◭ ◮ Back Close
Full Screen / Esc
Printer-friendly Version Interactive Discussion
EGU 3.2 Vertical distribution
The vertical profiles of CH3Cl, CH3Br and CHCl3 are presented in this section. The
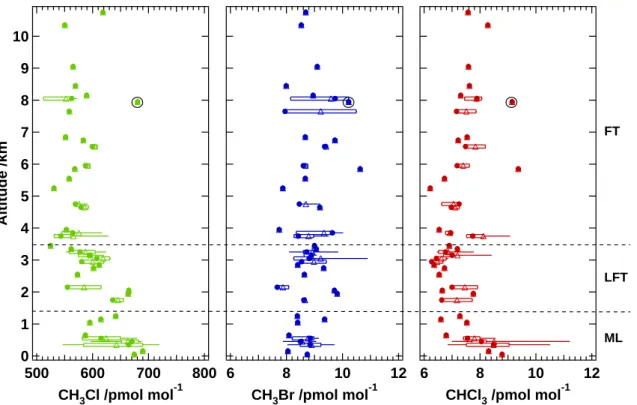
measurements span a range from the surface up to 11 km height although measure-ments were predominately made in the boundary layer. Figure 4 presents the 100 m binned profiles. Generally the profiles can be divided into three different parts: The 5
mixed boundary layer (ML) up to 1400 m, the lower free troposphere below the trade wind inversion (LFT) from 1400 to 3500 m and the free troposphere (FT) above 3500 m. The CH3Cl profile shows several distinct features. Clearly the mixing ratios below
3.5 km were higher than those above. In the FT the 100 m average values ranged from 531 to 619 pmol mol−1; the one outlier (marked with a circle in Fig. 4) is
dis-10
cussed further below. Within the LFT the mixing ratios seemed to increase approach-ing the ground to maximum values of 665 pmol mol−1 at 2 km. The ML appears to show pronounced gradients with height; mixing ratios around 641 pmol mol−1at 1.2 km
decreased to around 587 pmol mol−1 at 600 m and increased again to 676 pmol mol−1 near the surface.
15
The vertical distribution of CH3Br was quite scattered, the mixing ratios varied be-tween 7.7 and 10.9 pmol mol−1 showing no significant trend with height. In the case of CHCl3, average mixing ratios of 8.8 pmol mol−1 at the surface steadily decreased to
values around 7.3 pmol mol−1at the top of the ML. In the LFT they varied between 6.3
and 7.8 pmol mol−1. Above 3500 m mixing ratios were slightly higher and more variable 20
than below.
The vertical profiles give a strong indication where the sources of the various com-pounds are located. The CHCl3 profile shows a clear decrease in mixing ratio with
increasing height, which suggests the presence of a ground based source. The CH3Cl
vertical profile was more complex, showing two sections with elevated mixing ratios. 25
In this case two different sources can be considered. Firstly, a ground based source similar to chloroform, and secondly a further influence between 2 and 3 km height pre-sumably associated with advection from another source region. The CH3Br profile was
ACPD
8, 1159–1190, 2008
Halocarbons over the rainforest S. Gebhardt et al. Title Page Abstract Introduction Conclusions References Tables Figures ◭ ◮ ◭ ◮ Back Close
Full Screen / Esc
Printer-friendly Version Interactive Discussion
EGU too scattered to give relevant information on the height distribution of the sources.
The elevated value at 7.9 km visible in all three components corresponds to a sample taken within air strongly influenced by biomass burning. It coincides with elevated values in the biomass burning tracers carbon monoxide (CO) and acetonitrile (CH3CN)
(H. Bozem, personal communication). 5
3.3 Influence of biomass burning
As can be seen from the example above the possible influence of biomass burning has to be considered when interpreting the mixing ratios of the investigated compounds. When considering natural fluxes, care must be taken to exclude burning effects from calculated gradients. Burning is known to be a strong source of CH3Cl and also a
10
source of CH3Br and CHCl3 (Andreae and Merlet, 2001; Lobert et al., 1999). Since
during the period September to November there is widespread burning in the Southern Hemisphere it would not be surprising if some influence of this was detected during this campaign, particularly in CO, CH3CN and CH3Cl. However, fire maps prepared from
GOES-12 satellite images (http://cimss.ssec.wisc.edu/goes/burn/wfabba.html) showed 15
no significant burning activity directly in the area where the measurements took place. Furthermore, back trajectories from the measurement locations showed, that the fires occurring south or west of the Guyanas had no impact on the investigated air masses in the boundary layer (see Fig. 3). Generally low levels of CO and acetonitrile in the boundary layer (Stickler et al., 2007; G. Eerdekens, personal communication) also 20
supported the view that the measurements were not significantly influenced by local burning sources.
The ratio ∆CH3Cl/∆CO can give information on the sources of both gases, where ∆
indicates the difference of each mixing ratio from the ambient background. The back-ground mixing ratio was determined as the intercept of a linear fit of the mixing ratio 25
versus time over land (TOL) plot, namely 585 pmol mol−1 for CH3Cl, 95.3 nmol mol−1
ACPD
8, 1159–1190, 2008
Halocarbons over the rainforest S. Gebhardt et al. Title Page Abstract Introduction Conclusions References Tables Figures ◭ ◮ ◭ ◮ Back Close
Full Screen / Esc
Printer-friendly Version Interactive Discussion
EGU burning influenced air previous studies have reported ratios of 0.95 (±0.01)×10−3 and
0.496 (±0.035)×10−3 for African fires (Andreae et al., 1996; Rudolph et al., 1995). Other studies have reported CH3Cl/CO ratios of 0.85 (±0.06)×10−3 for South
Amer-ican smouldering fires and, 0.57 (±0.03)×10−3 for African flaming fires (Blake et al., 1996). Comparing CH3Cl and CO during this study a ratio of 2.77 (±0.64 2σ)×10−3 5
was obtained. The ratios measured here lie clearly outside the reported range for biomass burning. Therefore we conclude that the predominant source of the observed CH3Cl is most likely not biomass burning.
Although no “fresh” burning influenced air was detected, the ML appears to have been influenced by entrainment of such air lying directly above it, advected from a 10
distant burning region. Stickler et al. (2007) examined this possibility, reporting entrain-ment rates based on CO and formaldehyde data between 0.01 and 0.15 h−1, where
entrainment was defined as fraction of the ML air exchanged with the LFT air per unit time. Scheeren et al. (2003) reported an estimated loss of up to 25% of the surface emissions through entrainment at the top of the mixing layer, depending on the strength 15
of the convective mixing. While large uncertainties remain in the quantification of the entrainment, its presence provides a plausible explanation for the increasing CH3Cl
values between 1000 and 2000 m in this study.
In this case the methyl chloride concentration at 2–3 km was higher than at the top of the boundary layer, and therefore the entrainment will act to increase the perceived 20
mixing ratio versus TOL gradient and consequently the calculated flux. Thus the flux calculated in the following chapter should be seen as an upper limit. Because of its high variability, however, entrainment is not incorporated in the further calculations. 3.4 Emission fluxes
As clean marine boundary layer air was advected westwards over the pristine tropical 25
rainforest of French Guyana and Suriname during GABRIEL, mixing occurred between the marine boundary layer air and the forest emissions. Long-lived trace gases emitted
ACPD
8, 1159–1190, 2008
Halocarbons over the rainforest S. Gebhardt et al. Title Page Abstract Introduction Conclusions References Tables Figures ◭ ◮ ◭ ◮ Back Close
Full Screen / Esc
Printer-friendly Version Interactive Discussion
EGU by the forest can accumulate in the mixed boundary layer air so that mixing ratios of
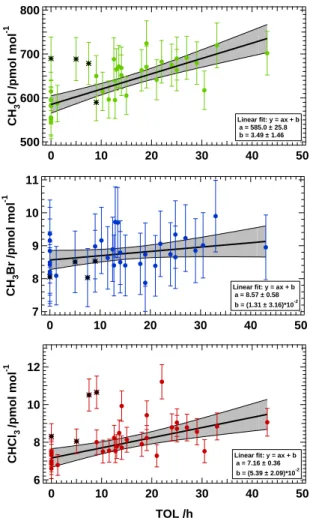
such species will increase westwards and hence be positively correlated with the time the air spent over land. Conversely uptake of gases by the forest will result in a negative correlation. The volume mixing ratios of CH3Cl, CH3Br and CHCl3samples in the ML
(<1400 m) (n=35) are shown as a function of time over land (TOL) in Fig. 5. 5
The mixing ratios in the boundary layer ranged from 546 to 724 (avg 643) pmol mol−1 for CH3Cl, 6.6 to 11.2 (avg 8.2) pmol mol−1 for CHCl3 and
7.9 to 9.9 (avg 8.8) pmol mol−1 for CH3Br, respectively. These are somewhat higher
than the global mean values of 550±30 pmol mol−1for CH3Cl, although in good general
agreement with reported higher concentrations at lower latitudes (WMO, 2007b). For 10
CHCl3, the values reported here are lower than the global average 18.5 pmol mol−1,
due to higher emissions in the Northern Hemisphere mid-latitudes, however, they agree very well with the average mixing ratio for the SH tropics, 9.7 pmol mol−1 (Khalil and Rasmussen, 1999b). For CH3Br the measured range fits the global
av-erage 7.9 pmol mol−1(Simmonds et al., 2004). The error bars shown in Fig. 5 indicate 15
the total uncertainty of the data points (±7% for CH3Cl, ±11% for CH3Br and ±8% for
CHCl3).
For CH3Cl and CHCl3 four data points at low TOL appear as outliers to the fit
(marked with a black asterisk in Figs. 1 and 5). Interestingly, these samples were taken in somewhat different geographical circumstances than the rest of the dataset. 20
The sample taken at 0 h TOL was deliberately collected at low altitude (200 m a.s.l.) directly above coastal salt marshes as such regions have been suggested to emit CH3Cl (Rhew et al., 2000) although this view was recently questioned (Wang et al.,
2006). The three samples at 5, 7.5 and 9 h TOL were taken in the vicinity of the cap-ital of French Guyana Cayenne directly downwind of Rochambeau airport and there-25
fore probably influenced by anthropogenic emissions. For the aforementioned reasons these points are not included in the flux calculations given below.
To calculate the time the air parcel spent over land we used the following approach. Starting at the sampling position we followed the path of the air parcel along the back
ACPD
8, 1159–1190, 2008
Halocarbons over the rainforest S. Gebhardt et al. Title Page Abstract Introduction Conclusions References Tables Figures ◭ ◮ ◭ ◮ Back Close
Full Screen / Esc
Printer-friendly Version Interactive Discussion
EGU trajectory in distinct time steps until it reached the coastline. For this procedure we used
the trajectories provided by the KNMI (Koninklijk Nederlands Meteorologisch Instituut), which are based on ECMWF meteorological data. We consider that this method will be better than simply extrapolating the instantaneous wind direction and speed.
A linear fit of the mixing ratio versus TOL plot was then used to calculate emis-5
sion fluxes from the rainforest ecosystem. The slope of the fit gives the increase of the mixing ratio per hour the air mass spent over the jungle. The black line in Fig. 5 indicates the linear regression curve, while the grey shaded area gives the 95% confi-dence interval of the fit coefficients (equivalent to 2σ). To calculate the fit coefficients and their confidence parameters the total uncertainty of each individual compound 10
was used as weighting parameter. In this case the flux was statistically significant if the given deviation was not bigger than the value of the parameter itself. Two com-pounds showed a significant correlation with TOL−∆CH3Cl/∆TOL=3.5±1.5 (2σ) and
∆CHCl3/∆TOL=(5.4±2.1)∗10−2 (2σ) – and thus appear to be emitted from the forest.
For methyl bromide the slope is not significant (∆CH3Br/∆TOL=(1.3±3.2)∗10−2 (2σ))
15
and therefore no emission could be determined within our detection limit.
Using the slope derived from Fig. 5 the flux F was calculated by following formula: F = (∆MR/∆TOL) × HML× (p × M/(R × T))
Where F is the flux (g m−2h−1), ∆MR/∆TOL the linear regression slope (mol mol−1h−1), HML the mean mixing layer height (1400±100 m), p the mean air pres-20
sure (946.31±56.89 hPa (2σ)), M the molar weight (g), R the gas constant (0.08314 hPa m3K−1) and T the mean air temperature (298.56±4.97 K (2σ)).
The result is a flux of 9.4 (±4.0 2σ) µg CH3Cl m−2h−1 and 0.34 (±0.14
2σ) µg CHCl3m−2h−1, respectively.
Using the slope uncertainty of ∆CH3Br/∆TOL we determine the lowest detectable
25
methyl bromide flux as 0.16 (2σ) µg CH3Br m−2h−1.
Despite their large size and potential importance to atmospheric chemistry, the Earth’s tropical forests are surprisingly poorly characterized for organohalogen species.
ACPD
8, 1159–1190, 2008
Halocarbons over the rainforest S. Gebhardt et al. Title Page Abstract Introduction Conclusions References Tables Figures ◭ ◮ ◭ ◮ Back Close
Full Screen / Esc
Printer-friendly Version Interactive Discussion
EGU There are only few measurement studies available for comparison and these were
mainly performed in Asia (Li et al., 1999; Yokouchi et al., 2002; Yokouchi et al., 2000; Saito and Yokouchi, 2006; Yokouchi et al., 2007), who measured in a tropical glasshouse and on forested islands. Scheeren et al. (2003) measured the two chlori-nated compounds in Suriname in March 1998 and Moore et al. (2005) analyzed tropical 5
fungi and soils in Brazil.
Li et al. (1999) observed a very high flux of 41 to 64µg CH3Cl m−2h−1from a coastal
area at Okinawa Island, Japan. Yokouchi et al. (2002) reported an emission flux of 5.4 (3.8–8)µg CH3Cl m−2h−1 from a greenhouse containing vegetation typical of the
lowland tropical forest of Southeast Asia and smaller though not quantified fluxes of 10
CH3Br and CH3I. Recently they reported an emission rate of 12–33µg CH3Cl m−2h−1
measured on one of the subtropical Okinawa islands (Yokouchi et al., 2007). The study performed by Scheeren et al. (2003) over Suriname in March 1998 reported fluxes of 7.6±1.8 µg CH3Cl m−2h−1 and 1.1±0.08 µg CHCl3m−2h−1. Moore et al. (2005)
re-ported wood rotting fungi to be a CH3Cl source and confirmed the soil as a sink, in
15
agreement with previous measurements (Watling and Harper, 1998; Khalil and Ras-mussen, 2000). Elevated mixing ratios above the canopy led them to the assumption that there have to be further strong sources in the rainforest beside the fungi.
Comparing the two studies, which took place in Suriname, one in March 1998 and this one in October 2005, it should be noted that they used different analytical tech-20
niques. The technique used by Scheeren et al. (2003) (GC-ECD) is less compound specific than the GC-MS system employed here, and in the former campaign longer canister storage times (several months) incurred prior to measurement while in this study the canisters were measured immediately after flight (within 48 h). However, since storage tests on similar canisters (Colomb et al., 2006) have indicated that the 25
investigated halocarbons are stable over 60 days we will assume hereafter that the obtained mixing ratios and fluxes are comparable to our data.
The CH3Cl fluxes of Scheeren et al. (2003) agree very well with the 9.4 (±4.0
ACPD
8, 1159–1190, 2008
Halocarbons over the rainforest S. Gebhardt et al. Title Page Abstract Introduction Conclusions References Tables Figures ◭ ◮ ◭ ◮ Back Close
Full Screen / Esc
Printer-friendly Version Interactive Discussion
EGU variation in the CH3Cl flux between March and October. The fluxes derived by
Yok-ouchi et al. (2002) and YokYok-ouchi et al. (2007) are in the same range, although they were obtained surveying a different kind of tropical species in Southeast Asia, whereas the study of Li et al. (1999) is reporting much higher fluxes than all other studies. Ex-cluding that one, the results presented here are in good agreement with model studies 5
(Lee-Taylor et al., 2001; Yoshida et al., 2004 and Yoshida et al., 2006), which have postulated a large land based, constant source of CH3Cl all over the tropics.
In the case of CHCl3, the fluxes reported by Scheeren et al. (2003) are approximately
three times higher than those measured here. The measurements of Scheeren et al. (2003) were conducted in the short dry season in March and those reported here in 10
the long dry season in October.
Since both studies took place in “dry” seasons there were only small differences in the climatologic parameters. The precipitation and therefore presumably soil moisture were very similar (70.3 mm during March 1998, 65.6 mm in October 2005), whereas the maximum temperature was on average higher by 1.6◦C in October 2005 (33.4◦C), 15
while the minimum temperature was similar (23.6◦C March 1998, 23.8◦C October 2005) (C. Becker, Meteorological Service Suriname, personal communication). Since there are no CHCl3 measurements available during the wet season, we are not able to
de-duce a seasonal emission pattern. However, the results presented here show a strong variation in the CHCl3 flux but no or very little change in the CH3Cl emissions. This 20
leads to the assumption that these compounds are emitted via different formation path-ways.
In addition to the anthropogenic, oceanic and biomass burning sources of CH3Cl and CHCl3 several further possible formation pathways have been reported. Isidorov
et al. (1985) and Isidorov and Jdanova (2002) showed that CH3Cl as well as CHCl3
25
is emitted by living leaves and leaf litter of some tree species (e.g. pencil cedar, ev-ergreen cypress northern white cedar, aspen and willow). Other higher plants such as tropical ferns, halophytes and potato tubers show significant emissions of CH3Cl
ACPD
8, 1159–1190, 2008
Halocarbons over the rainforest S. Gebhardt et al. Title Page Abstract Introduction Conclusions References Tables Figures ◭ ◮ ◭ ◮ Back Close
Full Screen / Esc
Printer-friendly Version Interactive Discussion
EGU as well as fungi (Watling and Harper, 1998). The metabolic origin of CH3Cl has been
identified as an enzyme catalysed halide methylation reaction, which uses either S-adenosylmethionine (SAM) or methionine as a methyl donor (Harper, 2000; Harper et al., 1999). Hamilton et al. (2003) showed that abiotic chloride methylation by plant pectin was an efficient, environmentally significant process producing methyl chloride. 5
Chloride ions, which are plentiful in the leaf, react with pectin during leaf senescence and an abiotic substitution reaction yields CH3Cl. This mechanism could account for the methyl chloride release from leaf litter and during biomass burning. Recent re-sults from isotopic studies of CH3Cl (Keppler et al., 2005) support this abiotic
mech-anism. Another abiotic process forming monohalogenated alkanes was identified by 10
Keppler et al. (2000). During the oxidation of organic matter by an electron acceptor like Fe (III) in soil, sediments or organic rich waters halide ions are methylated or even build ethyl or propyl halides.
While the aforementioned substitution mechanisms can efficiently produce mono-halogenated compounds there are not likely to be the source of the CHCl3, which
15
would require multiple substitution.
Although there is some evidence that chloroform is emitted directly by plants (Isidorov et al., 1985), soil processes are assumed to be the major source in the tropi-cal ecosystem (Laturnus et al., 2002; McCulloch, 2003, see Table 1). Several pathways are reported in the literature: Basidiomycetous fungi are able to synthesize CHCl3de 20
novo (Hoekstra et al., 1998a). It can also be formed by chlorination of organic mat-ter catalyzed by extracellular peroxidase-like enzymes (chloroperoxydase CPO) most probably deriving from fungi (Hoekstra et al., 1998b). Another plausible mechanism is the decarboxylation of trichloroacetic acid (Frank et al., 1989; Haselmann et al., 2000a).
25
Measurements of soils in temperate forest indicate CHCl3 emission up to 340 ng m−2h−1from soils covered with woodchips (Hoekstra et al., 2001). Haselmann et al. (2000b) reports local emissions in a Danish forest from 2.6 to 160 ng m−2h−1. These rates correspond very well with the flux of 340 (±140 2σ) ng m−2h−1CHCl
de-ACPD
8, 1159–1190, 2008
Halocarbons over the rainforest S. Gebhardt et al. Title Page Abstract Introduction Conclusions References Tables Figures ◭ ◮ ◭ ◮ Back Close
Full Screen / Esc
Printer-friendly Version Interactive Discussion
EGU rived in this study and strengthens the argument that the main fraction of CHCl3in the
tropical ecosystem is produced by soil processes. This would support the assumption of Laturnus et al. (2002), who speculated on a similar or even larger input from tropical forest areas as reported from northern temperate forests.
The average CH3Br mixing ratios reported here are slightly elevated compared to
5
global background values (WMO, 2007b), but no significant net emission from the rain-forest of CH3Br could be determined. This is in contrast to greenhouse and small scale experiments (Gan et al., 1998; Yokouchi et al., 2002; Saito and Yokouchi, 2006), which report CH3Br emission from plants from the brassicaceae family, Asian
low-land forest and tropical ferns. A vegetation source providing additional 45.6 Gg yr−1
10
in the tropics as postulated by Warwick et al. (2006) would correspond to a local flux of 0.287µg CH3Br m−2h−1. An emission of this order of magnitude would have been
detected by this study (detection limit for CH3Br: 0.160µg m−2h−1). Since soils are
known to uptake CH3Br, one may speculate that the possible release from tropical
veg-etation is just outweighed by a local soil sink and therefore not visible in a large scale 15
experiment like this one. On the other hand, a recent modelling study in our institute suggests that the atmospheric lifetime of CH3Br has been underestimated (A.
Kerk-weg, personal communication), which also closes the imbalance between sources and sinks without the presumed vegetation source.
3.5 Global emissions 20
Before extrapolating the observed emission fluxes from the South American rainforest to the global scale several aspects must be noted.
Firstly, the fluxes measured here were the net effect of the “rainforest ecosystem” at one time of year. As mentioned previously there are likely several competing sources and sinks (plants, bacteria, fungi, senescencing leaves etc.) within the ecosystem each 25
of which may vary independently in the course of a year.
ACPD
8, 1159–1190, 2008
Halocarbons over the rainforest S. Gebhardt et al. Title Page Abstract Introduction Conclusions References Tables Figures ◭ ◮ ◭ ◮ Back Close
Full Screen / Esc
Printer-friendly Version Interactive Discussion
EGU nearly half of the total global forest. The largest areas are found in the Amazon Basin
(South America) and the Congo Basin (Africa), as well as large parts of Southeast Asia and Oceania are covered by tropical forest. For these extrapolations, the rainforest from these diverse regions is considered homogenous. This is obviously a simplification and therefore the derived fluxes should be regarded as a rough estimate.
5
Thirdly, the definition of the forest area is an important issue. Using the widely distributed number of 18.2 million km2 of tropical forest (FAO, 2001), which refers to all kinds of forest located in the tropics, we obtained fluxes of 1.5 (±0.6 2σ) Tg CH3Cl yr−1 and 55 (±22 2σ) Gg CHCl3yr−1 for methyl chloride and chloroform,
respectively. A more conservative estimate using only the area of tropical rainfor-10
est (10.8 million km2) (FAO, 2001), results in fluxes of 0.9 (±0.4 2σ) Tg CH3Cl yr−1 and
33 (±13 2σ) Gg CHCl3yr−1.
These numbers are obtained using the flux derived by this study all over the year. Bearing in mind that chloroform emissions seem to be varying and other studies re-ported higher flux rates, one should regard these flux estimations as lower limit. Taking 15
into account the measurements of Scheeren et al. (2003), which were carried out in the same region by using the average flux of both studies the annual emission of CHCl3 would be more than doubled. It should be noted that this estimate is particularly uncer-tain since no measurements have yet been made in the wet season.
Although these extrapolations are inherently uncertain due to the aforementioned 20
assumptions in the calculation (entrainment, seasonal changes in flux), they do rep-resent our current best estimate of the rainforest contribution to the global budgets of these compounds and appear to be quite reasonable. The calculated flux of 1.5 (±0.6 2σ) Tg CH3Cl yr−1 from the tropical forest would account for half the missing source
postulated by the models (Lee-Taylor et al., 2001; Yoshida et al., 2006). 25
To better understand the budgets of these compounds it will be necessary to exam-ine seasonal variations of the various sources and sinks within the rainforest ecosys-tem. In particular, the driving parameters of the sources and sinks need to be bet-ter characbet-terized, e.g. their dependence on ambient temperature and/or soil moisture
ACPD
8, 1159–1190, 2008
Halocarbons over the rainforest S. Gebhardt et al. Title Page Abstract Introduction Conclusions References Tables Figures ◭ ◮ ◭ ◮ Back Close
Full Screen / Esc
Printer-friendly Version Interactive Discussion
EGU changes. These variations will be particularly important for predicting future changes
in the natural halocarbon emissions fluxes, which will become more important as the anthropogenic contribution recedes.
4 Summary and conclusions
This study presents airborne flux measurements of CH3Cl, CHCl3und CH3Br over the
5
tropical rainforest of Suriname. Aircraft measurements of the kind reported here in-herently consider the rainforest ecosystem as a whole, and are ideally suited to gauge the net effect over large areas. The fluxes are possibly the result of separate strong sinks and strong sources within the ecosystem, and represent the net flux from the rainforest to the atmosphere in October 2005. For both CH3Cl and CHCl3 a
signifi-10
cant correlation between concentration and time the air mass spent over the rainforest was found. The rainforest ecosystem produced 9.4 (±4.0 2σ) µg m−2h−1 CH3Cl and
0.34 (±0.14 2σ) µg m−2h−1 CHCl3.
No significant trend for CH3Br could be determined from these measurements in
disagreement with previous inverse model prediction (Warwick et al., 2006). Our mea-15
surements over the Amazon rainforest agree with global observations and vertical gra-dients between the boundary layer and free troposphere appear to be small or absent. This supports the conclusion that tropical forest does not contribute significantly to the global CH3Br source.
The CH3Cl flux is in good agreement with previously measured fluxes by Yokouchi et 20
al. (2002) and Yokouchi et al. (2007), who reported 5.4 (3.8–8)µg CH3Cl m−2h−1 and
12–33µg CH3Cl m−2h−1 for Asian lowland tropical forest, and Scheeren et al. (2003),
who derived 7.6 (±1.8) µg CH3Cl m−2h−1 over Suriname. This suggests that the
rainforest ecosystem is indeed the continuous source of methyl chloride postulated in model studies. Extrapolating the flux to the global scale resulted in 1.5 (±0.6 25
ACPD
8, 1159–1190, 2008
Halocarbons over the rainforest S. Gebhardt et al. Title Page Abstract Introduction Conclusions References Tables Figures ◭ ◮ ◭ ◮ Back Close
Full Screen / Esc
Printer-friendly Version Interactive Discussion
EGU Since the soil is known to be a sink for methyl chloride the observed total flux in this
study should be considered as lower limit of the possible direct production by plants or plant decay.
Regarding the CHCl3 emission we observed a three times weaker flux than that derived by Scheeren et al., 2003. Our lower limit of the global extrapolated flux from 5
the tropical forests is 55 (±22 2σ) Gg CHCl3yr−1.
From the different emission patterns we conclude that these two compounds are probably produced via different mechanisms. According to the literature CHCl3is most
probably formed by microbial processes in the soil depending on temperature and soil moisture, however, there are no clear meteorological differences between March 1998 10
and October 2005 to explain the flux differences observed. To obtain a better under-standing of the role of the rainforest ecosystem as a possible sink or source of halo-genated organic species more studies on the different tropical biomes are necessary. Performing a similar study during the wet season would provide additional information on the humidity dependence of the formation pathways and the seasonal variation of 15
the emissions, which could be incorporated in global models.
Furthermore, a more detailed survey of the possible contributors (plants, soil, leaf litter, fungi etc.) would top of the knowledge about the separate sources and sinks within the tropical rainforest ecosystem.
Acknowledgements. The authors like to thank the GABRIEL Team including the pilots and the
20
Enviscope engineers. We appreciate the help of the Meteorological Service Suriname and the KNMI (Koninklijk Nederlands Meteorologisch Instituut) providing climatological data, weather forecasts and air mass trajectories as well as the permission of C. Gurk and H. Fischer to make use of their CO and TOL data set. Special thanks to B. Scheeren and C. Becker for interesting and fruitful discussions. We are grateful to E. Atlas, University Miami for assistance with the 25
calibration. Not least we like to thank S. Wong-Zehnpfennig, G. Eerdekens and H. Bozem for their help.
ACPD
8, 1159–1190, 2008
Halocarbons over the rainforest S. Gebhardt et al. Title Page Abstract Introduction Conclusions References Tables Figures ◭ ◮ ◭ ◮ Back Close
Full Screen / Esc
Printer-friendly Version Interactive Discussion
EGU
References
Andreae, M. O., Atlas, E., Harris, G. W., Helas, G., deKock, A., Koppmann, R., Maenhaut, W., Mano, S., Pollock, W. H., Rudolph, J., Scharffe, D., Schebeske, G., and Welling, M.: Methyl halide emissions from savanna fires in southern Africa, J. Geophys. Res.-Atmos., 101, 23 603–23 613, 1996.
5
Andreae, M. O. and Merlet, P.: Emission of trace gases and aerosols from biomass burning, Global Biogeochem. Cy., 15, 955–966, 2001.
Blake, N. J., Blake, D. R., Sive, B. C., Chen, T. Y., Rowland, F. S., Collins, J. E., Sachse, G. W., and Anderson, B. E.: Biomass burning emissions and vertical distribution of atmospheric methyl halides and other reduced carbon gases in the South Atlantic region, J. Geophys. 10
Res.-Atmos., 101, 24 151–24 164, 1996.
Butler, J. H.: Atmospheric chemistry – Better budgets for methyl halides?, Nature, 403, 260– 261, 2000.
Colomb, A., Williams, J., Crowley, J., Gros, V., Hofmann, R., Salisbury, G., Klupfel, T., Kor-mann, R., Stickler, A., Forster, C., and Lelieveld, J.: Airborne measurements of trace organic 15
species in the upper troposphere over Europe: the impact of deep convection, Environ. Chem., 3, 244–259, 2006.
FAO: Forestry Paper 140: Global Forest Resources Assessment 2000 (FRA 2000), Food and Agricultural Organization of the United Nations, 1–149, Rome, Italy, 2001.
Frank, H., Frank, W., and Thiel, D.: C1- and C2-Halocarbons in soil-air of forests, Atmos. Envi-20
ron., 23, 1333–1335, 1989.
Gan, J., Yates, S. R., Ohr, H. D., and Sims, J. J.: Production of methyl bromide by terrestrial higher plants, Geophys. Res. Lett., 25, 3595–3598, 1998.
Gros, V., Williams, J., van Aardenne, J. A., Salisbury, G., Hofmann, R., Lawrence, M. G., von Kuhlmann, R., Lelieveld, J., Krol, M., Berresheim, H., Lobert, J. M., and Atlas, E.: Origin 25
of anthropogenic hydrocarbons and halocarbons measured in the summertime european outflow (on Crete in 2001), Atmos. Chem. Phys., 3, 1223–1235, 2003,
http://www.atmos-chem-phys.net/3/1223/2003/.
Hamilton, J. T. G., McRoberts, W. C., Keppler, F., Kalin, R. M., and Harper, D. B.: Chloride methylation by plant pectin: An efficient environmentally significant process, Science, 301, 30
206–209, 2003.
ACPD
8, 1159–1190, 2008
Halocarbons over the rainforest S. Gebhardt et al. Title Page Abstract Introduction Conclusions References Tables Figures ◭ ◮ ◭ ◮ Back Close
Full Screen / Esc
Printer-friendly Version Interactive Discussion
EGU metabolic utilization of chloromethane by tubers of the potato (Solanum tuberosum), New
Phytol., 142, 5–17, 1999.
Harper, D. B.: The global chloromethane cycle: biosynthesis, biodegradation and metabolic role, Nat. Prod. Rep., 17, 337–348, 2000.
Harper, D. B., Hamilton, J. T. G., Ducrocq, V., Kennedy, J. T., Downey, A., and Kalin, R. M.: 5
The distinctive isotopic signature of plant-derived chloromethane: possible application in constraining the atmospheric chloromethane budget, Chemosphere, 52, 433–436, 2003. Haselmann, K. F., Laturnus, F., Svensmark, B., and Gron, C.: Formation of chloroform in
spruce forest soil – results from laboratory incubation studies, Chemosphere, 41, 1769– 1774, 2000a.
10
Haselmann, K. F., Ketola, R. A., Laturnus, F., Lauritsen, F. R., and Gron, C.: Occurrence and formation of chloroform at Danish forest sites, Atmos. Environ., 34, 187–193, 2000b. Hoekstra, E. J., Verhagen, F. J. M., Field, J. A., De Leer, E. W. B., and Brinkman, U. A. T.:
Natural production of chloroform by fungi, Phytochemistry, 49, 91–97, 1998a.
Hoekstra, E. J., De Leer, E. W. B., and Brinkman, U. A. T.: Natural formation of chloroform and 15
brominated trihalomethanes in soil, Environ. Sci. Technol., 32, 3724–3729, 1998b.
Hoekstra, E. J., Duyzer, J. H., de Leer, E. W. B., and Brinkman, U. A. T.: Chloroform – con-centration gradients in soil air and atmospheric air, and emission fluxes from soil, Atmos. Environ., 35, 61–70, 2001.
Isidorov, V. A., Zenkevich, I. G., and Ioffe, B. V.: Volatile Organic Compounds in the Atmosphere 20
of Forests, Atmos. Environ., 19, 1–8, 1985.
Isidorov, V. A., and Jdanova, M.: Volatile organic compounds from leaves litter, Chemosphere, 48, 975–979, 2002.
Keene, W. C., Khalil, M. A. K., Erickson, D. J., McCulloch, A., Graedel, T. E., Lobert, J. M., Aucott, M. L., Gong, S. L., Harper, D. B., Kleiman, G., Midgley, P., Moore, R. M., Seuzaret, C., 25
Sturges, W. T., Benkovitz, C. M., Koropalov, V., Barrie, L. A., and Li, Y. F.: Composite global emissions of reactive chlorine from anthropogenic and natural sources: Reactive Chlorine Emissions Inventory, J. Geophys. Res.-Atmos., 104, 8429–8440, 1999.
Keppler, F., Eiden, R., Niedan, V., Pracht, J., and Scholer, H. F.: Halocarbons produced by natural oxidation processes during degradation of organic matter, Nature, 403, 298–301, 30
2000.
Keppler, F., Harper, D. B., Rockmann, T., Moore, R. M., and Hamilton, J. T. G.: New insight into the atmospheric chloromethane budget gained using stable carbon isotope ratios, Atmos.
ACPD
8, 1159–1190, 2008
Halocarbons over the rainforest S. Gebhardt et al. Title Page Abstract Introduction Conclusions References Tables Figures ◭ ◮ ◭ ◮ Back Close
Full Screen / Esc
Printer-friendly Version Interactive Discussion
EGU Chem. Phys., 5, 2403–2411, 2005,http://www.atmos-chem-phys.net/5/2403/2005/.
Khalil, M. A. K. and Rasmussen, R. A.: Atmospheric methyl chloride, Atmos. Environ., 33, 1305–1321, 1999a.
Khalil, M. A. K. and Rasmussen, R. A.: Atmospheric chloroform, Atmos. Environ., 33, 1151– 1158, 1999b.
5
Khalil, M. A. K. and Rasmussen, R. A.: Soil-atmosphere exchange of radiatively and chemically active gases, Environ. Sci. Pollut. R., 7, 79–82, 2000.
Laturnus, F., Haselmann, K. F., Borch, T., and Gron, C.: Terrestrial natural sources of trichloromethane (chloroform, CHCl3) – An overview, Biogeochemistry, 60, 121–139, 2002. Lee-Taylor, J. M., Doney, S. C., Brasseur, G. P., and M ¨uller, J. F.: A global three-dimensional 10
atmosphere-ocean model of methyl bromide distributions, J. Geophys. Res.-Atmos., 103, 16 039–16 057, 1998.
Lee-Taylor, J. M., Brasseur, G. P., and Yokouchi, Y.: A preliminary three-dimensional global model study of atmospheric methyl chloride distributions, Geophys. Res.-Atmos., 106, 34 221–34 233, 2001.
15
Levine, J. G., Braesicke, P., Harris, N. R. P., Savage, N. H., and Pyle, J. A.: Pathways and timescales for troposphere-to-stratosphere transport via the tropical tropopause layer and their relevance for very short lived substances, Geophys. Res.-Atmos., 112, D04308, doi:10.1029/2005JD006940, 2007.
Li, H. J., Yokouchi, Y., and Akimoto, H.: Measurement of methyl halides in the marine atmo-20
sphere, Atmos. Environ., 33, 1881–1887, 1999.
Lobert, J. M., Keene, W. C., Logan, J. A., and Yevich, R.: Global chlorine emissions from biomass burning: Reactive Chlorine Emissions Inventory, J. Geophys. Res.-Atmos., 104, 8373–8389, 1999.
Mak, J. E. and Brenninkmeijer, C. A. M.: Compressed-Air Sample Technology for Isotopic 25
Analysis of Atmospheric Carbon-Monoxide, J. Atmos. Ocean. Tech., 11, 425–431, 1994. McCulloch, A.: Chloroform in the environment: occurrence, sources, sinks and effects,
Chemo-sphere, 50, 1291–1308, 2003.
Moore, R. M., Gut, A., and Andreae, M. O.: A pilot study of methyl chloride emissions from tropical woodrot fungi, Chemosphere, 58, 221–225, 2005.
30
O’Doherty, S., Simmonds, P. G., Cunnold, D. M., Wang, H. J., Sturrock, G. A., Fraser, P. J., Ryall, D., Derwent, R. G., Weiss, R. F., Salameh, P., Miller, B. R., and Prinn, R. G.: In situ chloroform measurements at Advanced Global Atmospheric Gases Experiment atmospheric
ACPD
8, 1159–1190, 2008
Halocarbons over the rainforest S. Gebhardt et al. Title Page Abstract Introduction Conclusions References Tables Figures ◭ ◮ ◭ ◮ Back Close
Full Screen / Esc
Printer-friendly Version Interactive Discussion
EGU research stations from 1994 to 1998, J. Geophys. Res.-Atmos., 106, 20 429–20 444, 2001.
Reeves, C. E.: Atmospheric budget implications of the temporal and spatial trends in methyl bromide concentration, J. Geophys. Res.-Atmos., 108, 4343, doi:10.1029/2002JD002943, 2003.
Rhew, R. C., Miller, B. R., and Weiss, R. F.: Natural methyl bromide and methyl chloride emis-5
sions from coastal salt marshes, Nature, 403, 292–295, 2000.
Rudolph, J., Khedim, A., Koppmann, R., and Bonsang, B.: Field-Study of the Emissions of Methyl-Chloride and Other Halocarbons from Biomass Burning in Western Africa, J. Atmos. Chem., 22, 67–80, 1995.
Saito, T. and Yokouchi, Y.: Diurnal variation in methyl halide emission rates from tropical ferns, 10
Atmos. Environ., 40, 2806–2811, 2006.
Scheeren, H. A., Lelieveld, J., Williams, J., Fischer, H., and Warneke, C.: Measurement of reactive chlorocarbons over the Surinam tropical rain forest: indications for strong biogenic emissions, Atmos. Chem. Phys. Discuss., 3, 5469–5512, 2003,
http://www.atmos-chem-phys-discuss.net/3/5469/2003/. 15
Simmonds, P. G., Derwent, R. G., Manning, A. J., Fraser, P. J., Krummel, P. B., O’Doherty, S., Prinn, R. G., Cunnold, D. M., Miller, B. R., Wang, H. J., Ryall, D. B., Porter, L. W., Weiss, R. F., and Salameh, P. K.: AGAGE observations of methyl bromide and methyl chloride at Mace Head, Ireland, and Cape Grim, Tasmania, 1998–2001, J. Atmos. Chem., 47, 243–269, 2004.
20
Stickler, A., Fischer, H., Bozem, H., Gurk, C., Schiller, C., Martinez-Harder, M., Kubistin, D., Harder, H., Williams, J., Eerdekens, G., Yassaa, Y., Ganzeveld, L., Sander, R., and Lelieveld, J.: Chemistry, transport and dry deposition of trace gases in the boundary layer over the tropical Atlantic Ocean and the Guyanas during the GABRIEL field campaign, Atmos. Chemi. Phys., 7, 3933–3956, 2007.
25
Thompson, T. M., Butler, J. H., Daube, B. C., Dutton, G. S., Elkins, J. W., Hall, B. D., Hurst, D. F., King, D. B., Kline, E. S., LaFleur, B. G., Lind, J., Lovitz, S., Mondeel, D. J., Montzka, S. A., Moore, F. L., Nance, J. D., Neu, J. L., Romashkin, P. A., Scheffer, A., and Snible, W. J.: Halocarbons and other atmospheric trace species, in: Climate Monitoring and Diagnostics Laboratory: Summary Report 27 2002-2003, edited by: Schnell, R. C., Buggle, A.-M., and 30
Rosson, R. M., 115–135, NOAA/Climate Monitoring and Diagnostics Laboratory, Boulder, Colo. Available:http://www.esrl.noaa.gov/gmd/publications/annrpt27/hats5.pdf, 2004. Trudinger, C. M., Etheridge, D. M., Sturrock, G. A., Fraser, P. J., Krummel, P. B., and McCulloch,
ACPD
8, 1159–1190, 2008
Halocarbons over the rainforest S. Gebhardt et al. Title Page Abstract Introduction Conclusions References Tables Figures ◭ ◮ ◭ ◮ Back Close
Full Screen / Esc
Printer-friendly Version Interactive Discussion
EGU A.: Atmospheric histories of halocarbons from analysis of Antarctic firn air: Methyl bromide,
methyl chloride, chloroform, and dichloromethane, J. Geophys. Res.-Atmos., 109, D22310, doi:10.1029/2004JD0049322004.
Wang, J. X., Li, R. J., Guo, Y. Y., Qin, P., and Sun, S. C.: The flux of methyl chloride along an elevational gradient of a coastal salt marsh, Eastern China, Atmos. Environ., 40, 6592–6605, 5
2006.
Warwick, N. J., Pyle, J. A., and Shallcross, D. E.: Global modelling of the atmospheric methyl bromide budget, J. Atmos. Chem., 54, 133–159, 2006.
Watling, R. and Harper, D. B.: Chloromethane production by wood-rotting fungi and an estimate of the global flux to the atmosphere, Mycol. Res., 102, 769–787, 1998.
10
WMO: Scientific Assessment of Ozone Depletion: 1998, Chapter 2: Short-Lived Ozone-Related Compounds, Global Ozone Research and Monitoring Project – Report No. 44, World Meteorological Organization, 2.1–2.56, Geneva, Switzerland, 1999.
WMO: Scientific Assessment of Ozone Depletion: 2002, Chapter 1: Controlled Substances and Other Source Gases, Global Ozone Research and Monitoring Project – Report No. 47, 15
World Meterological Organization, 1.1–1.83, Geneva, Switzerland, 2003.
WMO: Scientific Assessment of Ozone Depletion: 2006, Chapter 8: Halocarbon Scenarios, ODPs ans GWPs, Global Ozone Research and Monitoring Project – Report No. 50, World Meteorological Organization, 8.1–8.39, Geneva, Switzerland, 2007a.
WMO: Scientific Assessment of Ozone Depletion: 2006, Chapter 1: Long-Lived Compounds, 20
Global Ozone Research and Monitoring Project – Report No. 50, World Meteorological Or-ganization, 1.1–1.63, Geneva, Switzerland, 2007b.
Worton, D. R., Sturges, W. T., Schwander, J., Mulvaney, R., Barnola, J. M., and Chappel-laz, J.: 20th century trends and budget implications of chloroform and related tri-and di-halomethanes inferred from firn air, Atmos. Chem. Phys., 6, 2847—2863, 2006,
25
http://www.atmos-chem-phys.net/6/2847/2006/.
Yokouchi, Y., Noijiri, Y., Barrie, L. A., Toom-Sauntry, D., Machida, T., Inuzuka, Y., Akimoto, H., Li, H. J., Fujinuma, Y., and Aoki, S.: A strong source of methyl chloride to the atmosphere from tropical coastal land, Nature, 403, 295–298, 2000.
Yokouchi, Y., Ikeda, M., Inuzuka, Y., and Yukawa, T.: Strong emission of methyl chloride from 30
tropical plants, Nature, 416, 163–165, 2002.
Yokouchi, Y., Saito, T., Ishigaki, C., and Aramoto, M.: Identification of methyl chloride-emitting plants and atmospheric measurements on a subtropical island, Chemosphere, 69, 549–553,
ACPD
8, 1159–1190, 2008
Halocarbons over the rainforest S. Gebhardt et al. Title Page Abstract Introduction Conclusions References Tables Figures ◭ ◮ ◭ ◮ Back Close
Full Screen / Esc
Printer-friendly Version Interactive Discussion
EGU 2007.
Yoshida, Y., Wang, Y. H., Zeng, T., and Yantosca, R.: A three-dimensional global model study of atmospheric methyl chloride budget and distributions, J. Geophys. Res.-Atmos., 109, D24309, doi:10.1029/2004JD004951, 2004.
Yoshida, Y., Wang, Y., Shim, C., Cunnold, D., Blake, D. R., and Dutton, G. S.: In-5
verse modeling of the global methyl chloride sources, J. Geophys. Res., 111, D16307, doi:10.1029/2005JD006696, 2006.
ACPD
8, 1159–1190, 2008
Halocarbons over the rainforest S. Gebhardt et al. Title Page Abstract Introduction Conclusions References Tables Figures ◭ ◮ ◭ ◮ Back Close
Full Screen / Esc
Printer-friendly Version Interactive Discussion
EGU
Table 1. Sources and sinks.
Source type Source range Sink type Sink range
/Gg yr-1 /Gg yr-1
min max min max
CH3Cl
a Tropical and subtropical plants 820 8200 OH−reaction 3800 4100
Tropical senescent or dead leaves 30 2500 Loss to stratosphere 100 300 Biomass burning 325 1125 Cl reaction 180 550
Oceans 380 500 Soils 100 1600
Salt marshes 65 440 Loss to polar oceans 93 145
Fungi 43 470
Wetlands 48 48 Rice Paddies 2.4 4.9 Fossil fuel burning 5 205 Waste incineration 15 75 Industrial processes 10 10
Subtotal 1743 13578 Subtotal 4273 6695 CH3Br
b
Oceans 23 119 OH−reaction and photolysis 60 100
Fumigation 28.2 64.4 Oceans 37 133 Gasoline 0 10 Soils 32 154 Biomass burning 10 40 Wetlands 2.3 9.2 Salt marshes 7 29 Shrublands 0.5 2 Rapeseed 4.8 8.4 Rice paddies 0.5 2.5 Fungi 0.5 5.2 Peatlands 0.1 3.3 Subtotal 77 293 Subtotal 129 387 CHCl3 c
Open Oceans 270 450 OH−reaction 370 830
Soil processes 120 320 Soils not quantified Volcanic and geological sources 9 15
Anaerobic fermentation 2 4 Pulp and paper manufacture 26 42 Water treatment 8 34 Other industrial sources 9 13 Biomass burningd 2 2
Subtotal 446 880 Subtotal 370 830
a
after WMO (2007b) and references therein
b
after WMO (2003) and references therein
c
after McCulloch (2003)
ACPD
8, 1159–1190, 2008
Halocarbons over the rainforest S. Gebhardt et al. Title Page Abstract Introduction Conclusions References Tables Figures ◭ ◮ ◭ ◮ Back Close
Full Screen / Esc
Printer-friendly Version Interactive Discussion
EGU
Fig. 1. Sampling area and flight tracks: ITCZ and prevailing wind direction (arrow) are shown
on the left. On the right side dots mark the position of the samples, while the color-coding gives the height information, black asterisks mark samples excluded from the calculation (source of satellite picture: Jacques Descloitres, MODIS Rapid Response Team, NASA/GSFC; down-loaded September 2007 from:http://visibleearth.nasa.gov/).
ACPD
8, 1159–1190, 2008
Halocarbons over the rainforest S. Gebhardt et al. Title Page Abstract Introduction Conclusions References Tables Figures ◭ ◮ ◭ ◮ Back Close
Full Screen / Esc
Printer-friendly Version Interactive Discussion EGU 16 12 8 4 0 Wind speed /m s-1 11 10 9 8 7 6 5 4 3 2 1 0 Altitude /km 360 270 180 90 0
Wind angle /deg
Fig. 2. Altitude distribution of wind speed and direction (angle) binned in 100 m intervals (dots:
median, boxes: 25/75 percentile, whiskers: 5/95 percentile). A wind angle of 0◦is equivalent to
ACPD
8, 1159–1190, 2008
Halocarbons over the rainforest S. Gebhardt et al. Title Page Abstract Introduction Conclusions References Tables Figures ◭ ◮ ◭ ◮ Back Close
Full Screen / Esc
Printer-friendly Version Interactive Discussion
EGU
Fig. 3. 10-days back trajectories (provided by KNMI) of the canister samples taken within
the boundary layer (<1400 m) overlaying a MODIS fire map showing all fires detected in the
period from 8 October 2005–18 October 2005 (Source: Fire maps created by Jacques De-scloitres, MODIS Rapid Response System at NASA/GSFC; downloaded September 2007 from http://rapidfire.sci.gsfc.nasa.gov/firemaps/).
ACPD
8, 1159–1190, 2008
Halocarbons over the rainforest S. Gebhardt et al. Title Page Abstract Introduction Conclusions References Tables Figures ◭ ◮ ◭ ◮ Back Close
Full Screen / Esc
Printer-friendly Version Interactive Discussion EGU 800 700 600 500 CH3Cl /pmol mol-1 10 9 8 7 6 5 4 3 2 1 0 Altitude /km 12 10 8 6 CH3Br /pmol mol-1 12 10 8 6 CHCl3 /pmol mol-1 LFT FT ML
Fig. 4. Vertical distribution of CH3Cl, CH3Br and CHCl3(dots: median, triangles: mean, boxes: 25/75 percentile, whiskers: 5/95 percentile, circles mark a biomass burning event). The hor-izontal dashed lines mark the divisions referred to in the text as mixed layer (ML), lower free troposphere (LFT) and free troposphere (FT).
ACPD
8, 1159–1190, 2008
Halocarbons over the rainforest S. Gebhardt et al. Title Page Abstract Introduction Conclusions References Tables Figures ◭ ◮ ◭ ◮ Back Close
Full Screen / Esc
Printer-friendly Version Interactive Discussion EGU 800 700 600 500 CH 3 Cl /pmol mol -1 50 40 30 20 10 0 TOL /h Linear fit: y = ax + b a = 585.0 ± 25.8 b = 3.49 ± 1.46 11 10 9 8 7 CH 3 Br /pmol mol -1 50 40 30 20 10 0 TOL /h Linear fit: y = ax + b a = 8.57 ± 0.58 b = (1.31 ± 3.16)*10-2 12 10 8 6 CHCl 3 /pmol mol -1 50 40 30 20 10 0 TOL /h Linear fit: y = ax + b a = 7.16 ± 0.36 b = (5.39 ± 2.09)*10-2
Fig. 5. Mixing ratios of CH3Cl, CH3Br and CHCl3vs. TOL. Fit coefficients and 95% confidence intervals are displayed in the box and visualized by the grey shaded area; black asterisks mark samples excluded from the calculation.