HAL Id: hal-01652683
https://hal.archives-ouvertes.fr/hal-01652683
Submitted on 22 Jan 2021
HAL is a multi-disciplinary open access
archive for the deposit and dissemination of sci-entific research documents, whether they are pub-lished or not. The documents may come from teaching and research institutions in France or abroad, or from public or private research centers.
L’archive ouverte pluridisciplinaire HAL, est destinée au dépôt et à la diffusion de documents scientifiques de niveau recherche, publiés ou non, émanant des établissements d’enseignement et de recherche français ou étrangers, des laboratoires publics ou privés.
Remarkable enhancement of the selective catalytic
reduction of NO at low temperature by collaborative
effect of ethanol and NH 3 over silver supported catalyst
M. Barreau, M.-L. Tarot, D. Duprez, X. Courtois, F. Can
To cite this version:
M. Barreau, M.-L. Tarot, D. Duprez, X. Courtois, F. Can. Remarkable enhancement of the se-lective catalytic reduction of NO at low temperature by collaborative effect of ethanol and NH 3 over silver supported catalyst. Applied Catalysis B: Environmental, Elsevier, 2018, 220, pp.19 - 30. �10.1016/j.apcatb.2017.08.015�. �hal-01652683�
1
Applied Catalysis B: Environmental 220 (2018) 19-30. DOI: 10.1016/j.apcatb.2017.08.015
Remarkable enhancement of the Selective Catalytic
Reduction of NO at low temperature by collaborative effect
of ethanol and NH
3over Silver supported catalyst.
M. Barreau, M-L. Tarot, D. Duprez, X. Courtois*, F. Can* University of Poitiers, CNRS, UMR 7285
Institut de Chimie des Milieux et Matériaux de Poitiers (IC2MP) 4 rue Michel Brunet – TSA 51106 – 86073 Cedex 9, France Fax: (+) +33 5 49 45 37 41
E-mail: xavier.courtois@univ-poitiers.fr; fabien.can@univ-poitiers.fr
Abstract: The NOx selective catalytic reduction (SCR) is extensively studied as an effective process for
air pollutants abatement from lean burn and Diesel vehicles. In the implemented Urea-SCR technology, the NO2/NOx ratio is a key parameter that limits the deNOx efficiency at low temperature (175-250°C).
We demonstrate that co-feeding of ammonia and ethanol on a Ag/Al2O3 catalyst enables a drastic
enhancement of the NOx conversion at temperatures below 200°C using only NO as NOx (standard SCR
condition). Even if NO2 is provided at low temperature by the NO oxidation over Ag/Al2O3 in presence
of EtOH, the NOx conversion improvement is not only due to a direct reaction between NH3 and NOx,
but mainly attributed to the availability of hydrogen H* species resulting from EtOH oxidation (similar to a H2 assisted NH3-SCR process). Due to the presence of remaining NH3 and NO2 (formed over
Ag/Al2O3 catalyst), further deNOx efficiency improvement was obtained at low temperature by addition
of a NH3-SCR catalyst (WO3/Ce-Zr). The critical dependence of the SCR process on the Diesel Oxidation
2
1. Introduction
Air pollution is responsible of direct harmful effects on human health with hundred thousand deaths per year throughout the world [1]. Consequently, stringent standards regulate pollutants emissions such as for nitrogen monoxide (NO) and nitrogen dioxide (NO2) from stationary and mobile sources.
Worldwide, the introduction of three way catalyst (TWC) converters for gasoline spark ignition engines noticeably contributed to increasing the air quality [2-4]. However, for internal combustion engines operated in excess of air, such as Diesel engines, TWC converter is unable to efficiently reduce NOx into
N2 and the implementation of selective catalytic reduction (SCR) technology, with a large choice of
reductants, is described as one of the most promising way to control NOx emissions in lean media.
Among the various possible reductants, ammonia (or urea used as NH3 provider), hydrocarbons
(propene, propane, decane…), ethanol (EtOH) were widely studied. Interestingly, whatever the considered reductant, the mechanistic studies generally suggest that N2 is obtained via the formation
of species like –CN and –NCO, which are known to be involved in ammonia formation. Indeed, such species were identified during the lean NOx reduction by propene over LaFe1−x(Cu, Pd)xO3−δ perovskites
[5], supported transition metals like Cu/Ti0.7Zr0.3O2 [6], or supported noble metals like Rh/TiO2 [7]. NH3
intermediate species was also clearly identified over Cu-ZSM-5 exchanged zeolite when propane [8] or decane [9] are used, as well as during the NOx reduction process by ethanol over Ag/Al2O3 catalyst [10].
These examples point out the key role of the ammonia-like intermediate species in the deNOx pathway,
whatever the considered reductant and the type of catalyst (noble metal, oxide, zeolite…).
To meet the current environmental standards limiting the NOx emission from Diesel vehicles, the
automotive industry has commonly adopted the Urea-SCR technology. The use of an aqueous urea solution as ammonia precursor is a safe and operational adaptation of the NH3-SCR technology initially
developed for stationary sources. Urea (NH2-CO-NH2) is theoretically decomposed in ammonia via two
consecutives reactions: urea thermal decomposition and HNCO hydrolysis reactions. Thereafter, NOx
reduction is assumed to be correlated with NH3 yield and supposed to follow similar pathways than
those demonstrated with ammonia reductant:
NO + NO2 + 2NH3 2N2 + 3H2O (1)
More precisely, the fast-SCR reaction (Eq. 1) results from sequences involving ammonium nitrate or related surface species as intermediates (Eq. 2, Eq. 3):
2NO2 + 2NH3 N2 + NH4NO3 + H2O (2)
3
Firstly, ammonium nitrate formation (Eq. 2) involves NO2 reactivity by dimerization (Eq. 4),
disproportionation (Eq. 5), and successive reaction to form N2 (Eq. 6) and ammonium nitrate (Eq. 7).
The second step of the fast-SCR chemistry (Eq. 3) implies the NO reactivity with ammonium nitrate which proceeds via the NO oxidation by nitric acid (Eq. 8) followed by reaction of NH3 with nitrous acid
to form N2 (Eq. 6). As a result, conversion of nitrogen oxides is optimized when NO, NO2 and NH3
respect a 1:1:2 ratio, enabling the stoichiometric reaction of fast SCR and is intimately related to HONO/HNO3 reactional pathway [11-15]. Finally, N2 is obtained by decomposition of ammonium nitrite
(Eq. 6). With many practical catalysts and regardless the used reductant, this reaction is commonly suggested to be the final step of deNOx chemistry [16-19].
2 NO2 ⇄ N2O4 (4)
N2O4 + H2O ⇄ HONO + HNO3 (5)
NH3 + HONO ⇄ NH4+ + NO2– ⇄ NH4NO2 N2 + 2H2O (6)
NH3 + HNO3 ⇄ NH4+ + NO3– ⇄ NH4NO3 (7)
NO + HNO3 ⇄ NO2 + HONO (8)
Unfortunately, the on-board Urea-SCR technology suffers from a poor activity at low temperatures (200°C) due to an insufficient NO2/NOx ratio to promote the fast SCR stoichiometry (Eq. 1) [20]. NO2
yield can be adjusted by the Diesel oxidation catalyst (DOC) upstream of the SCR converters, but the oxidation activity is also strongly dependent on both temperature and operating conditions. Recently an over-injection of aqueous solution of ammonium nitrate (Eq. 9) was reported to enhance the deNOx
efficiency while avoiding NO pre-oxidation [11].
2NO + 2NH3 + NH4NO3 3N2 + 5H2O (9)
EtOH-SCR process was also described as an attractive way to reduce NOx, especially due to the
practicality/availability of ethanol and its relative safety. Silver-based materials were found to be the most active and selective for the NOx reduction by oxygenates reductant compounds [19,21]. With
ethanol as reductant, the NO conversion is assumed to be strongly dependant of the nitromethane route, based on the ethanol oxidation to acetaldehyde via a variety of intermediates which are subsequently adsorbed, such as surface acetate and ethoxide ions leading to the global reaction (Eq. 10):
4
N-containing compounds as HNCO and ammonia are also eventually produced [10,22-26] as surface organic intermediate. A detailed surface mechanism for the SCR of NOx with ethanol on silver alumina
catalyst was proposed by Tham et al. [24]. In summary, the first step of the reaction framework results in C2H5OH dissociative adsorption into surface ethoxide C2H5O* and surface hydrogen H* ad-species
(Eq. 11) [26]. Thereafter, ethoxide can be consumed either by the oxidation pathway to yield acetaldehyde (Eq. 12) or by the NOx reduction pathway via nitromethane route (Eq. 13-16).
C2H5OH C2H5O*(ad) + H*(ad) (11)
C2H5O*(ad) CH3CHO*(ad) + H*(ad) CH3CHO (12)
CH3CHO*(ad) + O*(ad) CH3COO*(ad) + H*(ad) CH3COOH (13)
CH3COO*(ad) + NO2 CH3NO2 + CO2 (14)
CH3NO2 HNCO + H2O (15)
HNCO + H2O NH3 + CO2 (16)
Interestingly, the formation of ammonia via the isocyanate hydrolysis route (Eq. 9) takes place in this reaction pathway. It is assumed that the reaction pathway then follows very similar routes to those reported for the NH3-SCR reaction, with N2 formation from ammonium nitrite decomposition (Eq. 6).
Unfortunately, the deNOx activity of the EtOH-SCR technology at low temperatures appears not
sufficient for a practical application to the next generation of the energy-efficient Diesel vehicles, especially due to the rate limiting step of CH3NO2 formation at T<250-300°C. However, some studies
reported that an improvement of NOx reduction efficiency of EtOH-SCR technology at low temperature
is possible. For instance, addition of hydrogen into the reaction mixture allows an enhancement of the deNOx efficiency. It was advanced that H2 addition promotes the partial oxidation of C2H5OH to form
enolic species which mainly contribute to accelerate NOx reduction [27-29]. Note that Ag/Al2O3
catalysts were reported to exhibit a poor activity in NH3-SCR but they become very active in case of H2
addition [30-32]. An improvement of the N2 yield can also be obtained modifying the alumina support
to form surface zinc aluminates [21]. Indeed, an activation of the ethanol conversion in acetaldehyde was observed, but mainly from 250-300°C.
Interestingly, the ethanol dehydrogenation leading to acetaldehyde appears concomitant with a high proportion of NO2 emission from NO oxidation, as previously reported by Flura et al. [23]. This NO2
formation at relatively low temperature (from 150°C) may also favourably interfere in the SCR process, favouring the fast SCR reaction (Eq. 1). Moreover, the formation of ammonia by the isocyanate hydrolysis route (Eq. 9) appears in the EtOH-SCR reaction pathway. Ammonia was detected for
5
temperature higher than 250°C, when NOx reach a high conversion level [23]. It could indicates that
ammonia is a key intermediate species, but with a too low production rate at low temperature. Obviously, N2 yield of EtOH-SCR process seems to appear strongly dependant to subsequent ammonia
route formation. Thus, in the present work, we studied the role of ammonia as co-reactant species for assisted EtOH-SCR process in NO rich media for future application in a coupled Urea/Ethanol-SCR process. Particular attention was paid to increasing the efficiency of EtOH-SCR system at low temperatures (T=175-250°C) while overcoming the NO2 yield of the DOC.
2. Experimental part
2.1 Materials
Silver supported catalyst was selected to conduct EtOH-SCR experiments due to their high reactivity toward oxygenated compounds [33-35]. Alumina support was provided by Axens and exhibited a specific surface area of 170 m2 g-1 after calcination4 hours under air at 700°C. Silver (2.0
wt.%, which is
commonly described as the optimal loading [36]) was added by impregnation of AgNO3 dissolved in
ethanol [21,23,37]. Sample was finally calcined under synthetic air with 10 % H2O at 700°C for 4 h and
is noted Ag/Al.
WO3/CexZr1-xO2 catalyst was selected as NH3-SCR material [38-40]. Ceria-zirconia support (40 wt% of
CeO2) was provided by Solvay. This solid solution, was first calcined 4 hours under air at 700°C before
use and exhibited a specific surface area of 73 m2 g-1. Tungsten (6
wt% WO3) was added by impregnation
at 60°C under continuous agitation using an aqueous solution of ammonium metatungstate. After drying at 80°C, the preparation was placed in an oven at 120°C during a night. Finally, the solid was calcined under synthetic wet air (10 % H2O) during 4h at 700°C. The obtained catalyst is noted WO3
/Ce-Zr.
2.2 Characterization
Specific surface areas were determined by BET method (Tristar 3000, Micromeritics) using nitrogen adsorption at 77 K. Prior to the N2 physisorption, the samples were degassed under vacuum 2 h at
250°C. The Ag/Al and WO3/Ce-Zr catalysts exhibited specific surface areas of 160and 52 m2 g-1,
respectively.
The powder XRD patterns of Ag/Al was collected using an Empyrean (PANalytical) diffractometer. Data acquisition was recorded from 20° to 120° (2θ) with a scanning step of 0.1°. X-ray diffraction pattern
6
evidenced the -Al2O3 phase [ICDD PDF n° 00-050-0741(I)] with no visible reflection assigned to silver
species (Ag0, Ag
2O, AgO, Ag2Al2O4…).
Temperature programmed reduction (TPR) experiments were performed on a Micromeritics Autochem 2920 apparatus equipped with a thermal conductivity detector (TCD). Sample of about 100 mg was placed in a U-shape quartz reactor. Prior to the TPR measurements, the sample was calcined at 500°C for 60 min under O2 flow (heating rate: 5°C min-1). The sample was cooled down to room
temperature, and it was purged under Ar flow for 45 min. The reduction was carried out under 1 vol.% H2 in Ar flow up to 500 °C (heating rate: 5°C min-1). TCD signal being sensible to water, an H2O-trap was
added downstream of the reactor, allowing the quantification of the H2 consumption during the TPR
experiment. H2-TPR experiment of Ag/Al showed a broad H2 consumption peak, with a maximum at
around 260°C. Hydrogen consumption indicated that 33 % of the deposited silver was in metallic state, according to results previously reported by Musi et al [41].
Transmission Electron Microscopy (TEM) micrographs were recorded on JEOL 2100 instrument (operated at 200 kV with a LaB6 source and equipped with a Gatan Ultra scan camera). TEM
experiments showed that Ag/Al2O3 presents small silver particles, most of the particles ranging below
3 nm (Supplementary information (SI) file, Figure S1).
Infrared characterization was carried out with a Nicolet 6700 infrared spectrometer equipped with a MCT detector and a KBr beamsplitter using a resolution of 4 cm-1 and 126 scans. A home-made
designed cell (SI file, Figure S2) that allows in situ treatment and high temperature adsorption of probe molecule was used. The cell was connected to a vacuum manifold system which could supply nitric oxide, ethanol, ammonia and oxygen. Silver supported catalyst was pressed as self-supported wafer (disc of about 20 mg, 2 cm2) and was firstly treated in situ at 400°C under vacuum (residual pressure
of about 5.10-5 hPa). The calibrated doses of desired gas mixture were successively added at 200°C up
to equilibrium pressure. Three gas mixtures (EtOH-O2, NO-O2 and NH3) and combinations of
co-adsorption (EtOH-O2+NH3, NO-O2+NH3, EtOH-O2+NO-O2+NH3) were particularly studied. For EtOH-O2
and NO-O2 mixtures, the O2/reductant pressure ratio was fixed at 5. The spectra presented in this paper
were normalized to a disc of 10 mg cm-² and the reference spectra (recorded at 200°C after calcination)
was systematically subtracted to highlight the adsorbed species.
2.3 Catalytic tests
Catalytic tests were performed in a quartz tubular micro-reactor under a synthetic flow simulating a realistic Diesel engine exhaust. The total flow rate was fixed at 333 mL.min-1 for 100 mg of powdered
7
130 000 h-1 toward the catalyst (200 L h-1 g
cata-1; 100 L h-1 gpowder-1). For the dual-bed configuration, 100
mg of WO3/Ce-Zr were placed downstream 100 mg of Ag/Al catalyst (no SiC for these experiments).
Three reductants were evaluated, namely ethanol (EtOH), NH3, and a blend (EtOH+NH3). The
compositions of the gas mixtures for the various catalytic tests are reported in Table 1. Gaseous NO/NO2/NH3/O2/N2 gas flows were adjusted by mass-flow controllers (Bronkhorst). Ethanol aqueous
solution (8.02 10-1 mol L-1) was vaporized and mixed upstream the SCR catalyst by means of a
micro-nozzles provided by The Lee Company (Ønozzle= 50 µm) connected to a HPLC pump (Jasco, PU-2085, 22
µL min-1, P=10 Bar). The compositions of the feed gas and effluent stream were monitored
continuously using online MKS 2030 Multigas infrared analyser for NO, NO2, N2O, HNCO, NH3,
CH3CH2OH, CH3CHO, CH3OH, CH2O, C2H4, CH4, CO, CO2 and H2O.
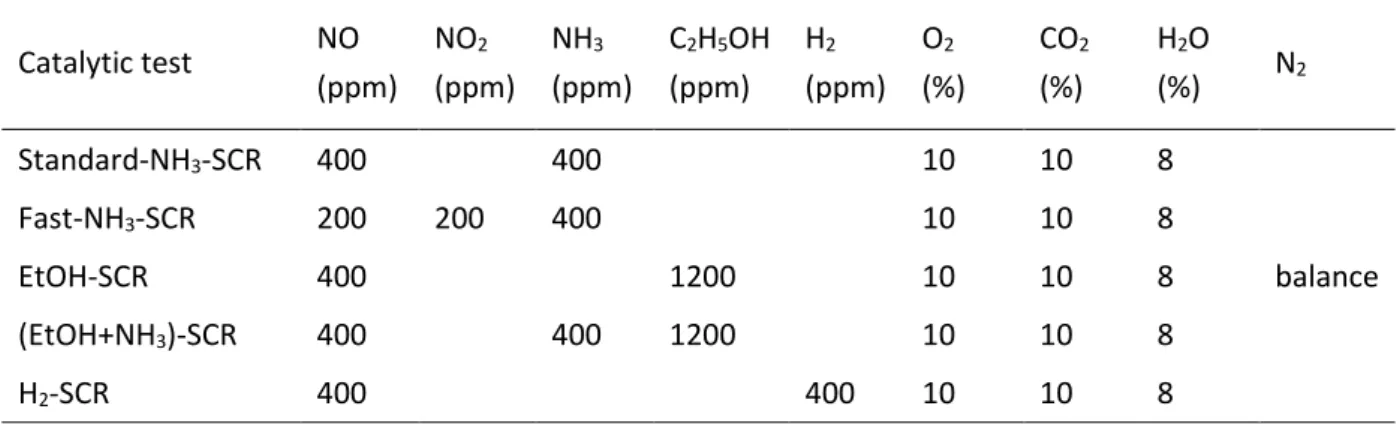
Table 1. Composition of the Gas mixtures of the SCR tests (total rate: 333 mL min-1 for 100 mg of
powdered catalyst). Catalytic test NO (ppm) NO2 (ppm) NH3 (ppm) C2H5OH (ppm) H2 (ppm) O2 (%) CO2 (%) H2O (%) N2 Standard-NH3-SCR 400 400 10 10 8 balance Fast-NH3-SCR 200 200 400 10 10 8 EtOH-SCR 400 1200 10 10 8 (EtOH+NH3)-SCR 400 400 1200 10 10 8 H2-SCR 400 400 10 10 8
3. Results and discussion
The NO reduction by ethanol (EtOH-SCR condition, Table 1) over Ag/Al catalyst is the reference test in this study. EtOH and NO concentrations were fixed at 1200 ppm and 400 ppm respectively, corresponding to a usual C/N ratio of 6 [10,21,23]. First, note that N2O emissions were limited at a very
low level whatever the involved catalytic system. More precisely, N2O was detected with a maximum
concentration of 6 ppm from 250 to 500°C in EtOH-SCR condition. The maximum N2O concentration
(11 ppm) was recorded at 450°C over Ag/Al catalyst in (EtOH+NH3)-SCR condition.
3.1 Highlight of the (EtOH+NH3) collaborative effect on NO SCR
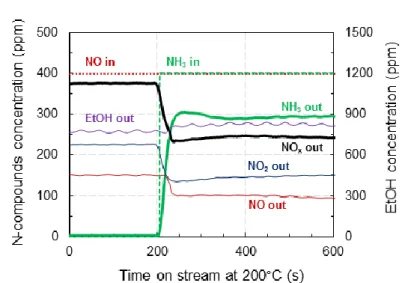
To highlight the beneficial effect of (EtOH+NH3) co-feeding on the NO reduction rate over Ag/Al, Figure
1 reports the evolution of outlet gas feed composition versus time on stream for NO, NO2, C2H5OH, and
8
Figure 1. Effect of NH3 co-feeding (400 ppm) at 200°C on NOx (NO, NO2), C2H5OH, and NH3 outlet
concentrations over Ag/Al in EtOH-SCR (400 ppm NO, 1200 ppm C2H5OH, 8 % H2O, 10 % CO2, 10 % O2
balanced in N2).
Figure 2. Comparison of EtOH-SCR (blue) and (EtOH+NH3)-SCR (red) behaviour in NOx conversion (full
line) and EtOH conversion (dotted line) over Ag/Al catalyst.
With only ethanol as reductant (EtOH-SCR condition), NOx conversion reached 9 % and a significant
NO2 outlet concentration was recorded at 225 ppm, which corresponds to a NO2/NOx outlet ratio of
0.6. In the same time, the C2H5OH conversion reached at 35 %.
At t=200 s, 400 ppm NH3 was added to the reaction mixture ((EtOH+NH3)-SCR, Table1). Outlet profiles
of NO and NO2 dropped rapidly to quadrupled the NOx conversion (up to 38 %), together with NH3
consumption. In parallel, ethanol and acetaldehyde outlet concentrations remained unchanged after
0 20 40 60 80 100 150 250 350 450 550 C onv ersio n (%) Temperature (°C)
9
few oscillations associated with gas feed stabilization. Obviously, NH3 addition to EtOH-SCR system
showed a dramatic benefit for the NOx conversion at low temperature and in NO rich media.
This significant deNOx enhancement is also reflected in a wider temperature range. Conversions of
EtOH and NOx for EtOH-SCR and (EtOH+NH3)-SCR over Ag/Al catalyst are reported in Figure 2. First,
note that addition of NH3 as co-reductant did not significantly affect the ethanol conversion profile
(blue and red dotted lines). On the contrary, the NOx conversion was remarkably enhanced, from 9 %
and 38 % at 200°C and 250°C , respectively (blue full line), to 38 % and 74 % (red full line) when EtOH and NH3 were co-fed. Above 350°C, full NOx conversion was achieved with or without NH3 addition.
Interestingly, the NOx conversion obtained with the (EtOH+NH3)-SCR condition then fitted with the
EtOH conversion, suggesting a beneficial effect of ethanol in the activation of ammonia to reduce NOx
over the Ag/Al2O3 material. This point is especially discussed section 3.2 focussed on C-compounds
distribution in EtOH-SCR and (EtOH+NH3)-SCR conditions.
However, to put in evidence the collaborative effect of ethanol and NH3 over Ag/Al, the NH3-SCR
behaviour was also examined on Ag/Al sample (experimental feed composition reported in Table 1). Results depicted in Figure 3 indicate that when only NO was introduced as NOx (orange line), the Ag/Al
catalyst exhibited nearly no activity to reduce NOx by NH3. The NOx conversion remained very low at
1-3 % whatever the studied temperature. The ammonia conversion (not shown) followed the same trend, with a maximum NH3 conversion of 4 % at 500°C. Note that the ammonia conversion was also
close to zero without NOx in the inlet mixture. These tests showed that this catalyst is unsuitable to
activate neither the direct NO reduction by NH3 nor the ammonia oxidation by O2. Considering that
EtOH-SCR led to high NO2 formation which may be favourable to the NOx reduction allowing the
“fast-SCR” process, the Ag/Al catalyst was also evaluated in NH3-SCR using a NO2/NOx inlet ratio of 0.5 (blue
line, Figure 3). Compared with the “standard NH3-SCR” condition, the NOx conversion by NH3 was just
a little improved and reached between 7 % and 15 % in the 200-500°C temperature range. Again, the ammonia conversion remained close to that of NOx, except for the higher temperatures. This poor
activity of Ag/Al catalyst in NH3-SCR is consistent with previously reported results [30-32] and
demonstrates that the enhancement of the deNOx efficiency in (EtOH+NH3)-SCR conditions is not
10
Figure 3. NOx conversion in NH3-SCR over Ag/Al catalyst for standard-SCR condition (▬: 400 ppm NO,
400 ppm NH3, 8 % H2O, 10 % CO2, 10 % O2 balanced in N2,) and fast-SCR condition (▬: 200 ppm NO,
200 ppm NO2, 400 ppm NH3, 8 % H2O, 10 % CO2, 10 % O2 balanced in N2).
3.2 Mechanistic study of the (EtOH+NH3)-SCR process
3.2.1 C-compounds distribution in EtOH-SCR and (EtOH+NH3)-SCR conditions
In order to obtain information about the reaction pathway involved in the (EtOH+NH3)-SCR chemistry,
the carbon compound distribution was examined depending on the presence of NH3. Results are
depicted in Figure 4. As previously reported [10], ethanol was mainly converted into acetaldehyde at low temperature (T<300°C). Formaldehyde, ethylene were also detected, as well as traces of methanol (not shown).
Figure 4. Ethanol conversion (▬, ---) and C-compounds distribution (acetaldehyde (▬, ---); ethylene (▬, ---); formaldehyde (▬, ---)) over Ag/Al catalyst in EtOH-SCR (full lines) and (EtOH+NH3)-SCR
(dotted lines) conditions.
(1200 ppm EtOH, with or without 400 ppm NH3,400 ppm NO, 8 % H2O, 10 % CO2, 10 % O2 balanced in
11
In reaction mixture including NH3 ((EtOH+NH3)-SCR), no apparent alteration in both ethanol conversion
and C-compounds selectivity was denoted. Consequently, there is no evidence for a reactivity between ammonia and organic species.
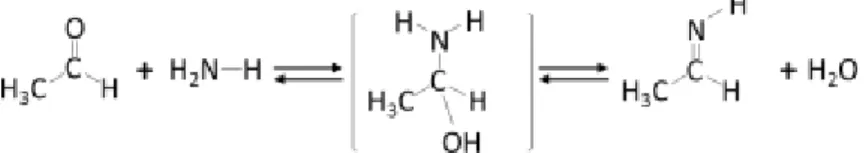
However, the possible formation of an organo-nitrogen intermediate species, obtained by reaction of ethanol with ammonia was supplementary checked by mass spectrometry analysis. In fact, ammonia condensation with aldehydes is well known to lead to imine compounds. The first step is a nucleophilic addition of primary amine like NH3, to the carbonyl group of acetaldehyde, followed by a rapid proton
transfer, as reported in Scheme 1 for ethanimine synthesis. In accordance with Vinogradoff et al. [42], the corresponding m:z=28 value is expected as the main peak corresponding to the loss of CH3
fragment from an alpha fragmentation of the ethanimine (CH=NH+). The m:z=42 and m:z=43 value of
CH3C=NH+ and CH3CH=NH+ respectively are also expected. Finally, none of these fragments were
observed, giving no evidence of an organo-nitrogen compound formation and confirming that a direct reaction pathway between organic species and ammonia to enhance the NOx reduction is invalidated.
Scheme 1. Ethanimine formation mechanism.
3.2.2 NO2 reactivity in (EtOH+NH3)-SCR
As previously reported in Figure 1, EtOH-SCR over Ag/Al sample revealed NO2 emission of
approximately 225 ppm at 200°C. More precisely, the NO2 emission reported in Figure 5 depended on
the temperature and varied together with the CH3CHO profile (Figure 4). As already reported in ref.
[10], the EtOH reaction pathway at low temperature (T<300°C) firstly involves a reaction between ethanol, NO and O2 to produce acetaldehyde and NO2 (Eq. 17).
C2H5OH + NO + O2 CH3CHO + NO2 + H2O (17)
Figure 1 also showed that addition of NH3 in the reaction mixture induced a decrease in NO2 outlet
concentration. Figure 5 confirms that (EtOH+NH3) co-injection (red curve, (EtOH+NH3)-SCR) led to a
significant decreases in NO2 emission for all the studied temperature. This result suggests a reactivity
between NH3 and the in situ NO2 formed from EtOH-SCR chemistry. Nevertheless, as previously
discussed, the Ag/Al catalyst presented a poor activity in NH3-SCR, even under the most favourable
fast-SCR stoichiometry (Figure 3), showing that NO2 did not preferentially react with NH3 over Ag/Al
12
Figure 5. NO2 outlet emission over Ag/Al catalyst: Reaction mixture: (▬) EtOH-SCR (400 ppm NO, 1200
ppm C2H5OH, 8 % H2O, 10 % CO2, 10 % O2 balanced in N2); (▬) (EtOH+NH3)-SCR (400 ppm NO, 1200
ppm C2H5OH, 400 ppm NH3, 8 % H2O, 10 % CO2, 10 % O2 balanced in N2).
Subsequently, the influence of the inlet NH3 concentration was studied in the low temperature range
(175°C-250°C). The ammonia concentration was adjusted from 0 to 750 ppm in addition to the gas mixture corresponding to EtOH-SCR condition (Table 1). Results are presented in Figure 6. As expected, the NOx conversion increased with temperature, and it clearly appears that the gain in NOx conversion
in regard on the amount of added ammonia is strongly temperature dependant, even in a rather small temperature range (175-250°C). Interestingly, Figure 6 clearly shows that NO2 is the main compound
affected by the NH3 addition, especially with the increase of the temperature. It indicates that
ammonia reacted preferentially with NO2 in ethanol media, even if the Fast-NH3-SCR test previously
depicted in Figure 3 showed a limited activity. In line with this observation, the calculated ratio between the amount of converted ammonia and the amount of supplementary converted NOx also
increased with the temperature. It was close to 1 at 175°C (with a quite large uncertainty because ammonia and NOx variations were then limited), increased to 1.1-1.2 at 200°C and reached 1.3-1.4 at
250°C, without clear evidence of the ammonia inlet concentration. Then, the apparent NH3-NOx
stoichiometry appeared to vary from a fast/standard-SCR stoichiometry at 200°C to an additional contribution of a NH3-NO2 reaction with the increase of temperature.
Lastly, whatever the temperature between 175°C and 250°C, the ethanol outlet concentration (not shown) appears unaffected by the amount of added ammonia.
To further study the interactions between ammonia, ethanol and NOx on Ag/Al catalyst, adsorption of
13
Figure 6. Effect of NH3 inlet concentration in NO (▬) and NO2 (▬) outlet emissions at 175, 200 and
14
3.2.3 Infrared Spectroscopy study
NH3 adsorption. NH3 adsorption over Ag/Al sample was firstly studied. Spectra (not shown) are
remarkable by low intensive bands due to the weak acidity of alumina to adsorb ammonia at 200°C. Nevertheless, ammonia is apparently adsorbed on both Lewis and Brønsted acid sites. The bands at 1228 and 1288 cm-1 are attributed to the symmetric deformation of NH
3 (s(NH3)) coordinatively bound
to Lewis acid sites on Ag/Al2O3. Note that the symmetric deformation vibration is the more sensitive
mode to the strength of the Lewis acid-base interaction. The two components observed at 1228 and 1288 cm-1 probably reveal ammonia coordination onto tetrahedral Al3+ and octahedral Al3+ Lewis acid
sites of different strength. The band at 1579 cm-1 is due to the asymmetric deformation of NH 3
(as(NH3)) adsorbed on Lewis acid sites on the catalyst surface. Two bands at 1684 and 1628 cm-1 are
attributed to s(NH4+) and as(NH4+) bound onto Brønsted acid sites respectively. The peak at 1395 cm -1 is assigned to NH
4+ species on Al2O3 support (as(NH4+) [43-46]. The corresponding assignments are
reported Table 2.
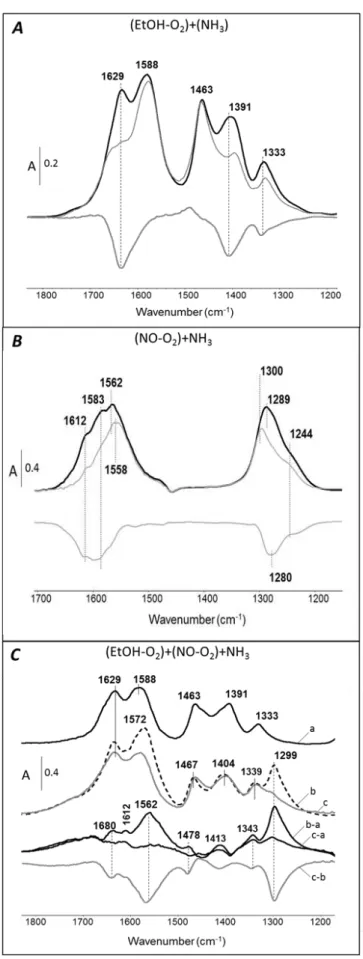
EtOH-O2 co-adsorption. IR spectra of (EtOH-O2) adsorption at equilibrium (Figure 7A black full line)
results in the appearance of several bands at 1629, 1588, 1463, 1391 and 1333 cm-1. Assignments are
reported in Table 2. In accordance with results reported in previous study for acetic acid adsorption, the bands at 1588 and 1463 cm-1 are assigned to adsorbed acetate (
as(OCO) and s(OCO) respectively)
[47]. In addition, bands at 1629, 1391 and 1333 cm-1 are clearly observed. The band at 1629 cm-1 is
assigned to asymmetric stretching vibration mode (as(CCO)) and peaks at 1391 and 1333 cm-1 is
attributed to a symmetric stretching vibration (s(CCO)) mode and to a C-H deformation mode ((CH)) of
enolic species (CH2-CH-O)—, respectively. Several bands are observed around 1800-1700 cm-1 and
1300-1200 cm-1 which are assigned to acetaldehyde gas species. These bands disappear after
evacuation.
NH3 adsorption over (EtOH-O2) ad-species As shown in Figure 7A, the adsorption of ammonia (10 hPa
at equilibrium) on ethanol-covered Ag/Al2O3 surface leads to decrease the intensity of the bands at
1629, 1391 and 1333 cm-1 previously attributed to enolic species. It means that, without NO x
compounds, ammonia reacts preferentially with ethoxy species than with acetate. This is highlighted by subtracting spectra obtained after adsorption of ethanol and ammonia (shown in bold gray line). The negative absorption bands show the consumption of the enolic species by ammonia. Note that the IR vibration mode of ammonia is not observed.
15
Table 2. Infrared bands attribution for adsorbed species and free OH groups on Ag/Al2O3
Gas mixture
Surface species Assignment Wavenumber
(cm-1) Type Ib
(AlVI)OH (OH) 3800-3785
Type Ia
(AlIV)OH (OH) 3780-3760
Type IIb
(AlVI)2OH (OH) 3745-3740
Type IIa
(AlIVAlVI)OH (OH) 3735-3720
Type III
(AlVI)3OH (OH) 3710-3680
(EtOH-O2)
Enolic (CH2-CH-O)— as(CCO) 1629
Acetate (CH3-(C=O)-O)— as(OCO) 1588
Acetate (CH3-(C=O)-O)— s(OCO) 1463
Enolic (CH2-CH-O)— s(CCO) 1391
Enolic (CH2-CH-O)— (CH) 1333 (NO-O2) Monodentate Nitrate 3' 1547-1562 3'' 1299-1289 Bidentate Nitrate 3' 1587-1583 3'' 1254-1244 Bridged Nitrate 3' 1612 Monodentate Nitrite 1 1313 3 1229 (NH3)
Ammonium ion (Brønsted AS) s(NH4+) 1684
Coordinated ammonia (Lewis AS) as(NH3) 1628
Coordinated ammonia (Lewis AS) as(NH3) 1579
Ammonium ion (Brønsted AS) as(NH4+) 1395
Coordinated ammonia (Lewis AS) s(NH3) 1288
16
Figure 7. Transmission IR spectra of co-reactive compounds adsorption at 200°C over Ag/Al catalyst.
17
(NO-O2) adsorption. It is well-known that NO2 and NO can react on metal oxide surfaces to yield a
number of different surface species that in principle can be differentiated by infrared spectroscopy and results in different absorption frequencies in the spectral range from 1200 to 1700 cm-1. Nitrogen
dioxide adsorption can result in the formation of both adsorbed nitrate (NO3-) and nitrite (NO2-). The
coordination of nitrate, nitrite, and nitric oxide in inorganic complexes has been discussed in the literature in detail and provides a useful guide for the interpretation of the infrared absorption bands of adsorbed species [48-50]. It is reported that the planar nitrate ion belongs to the point group D3h
and has four fundamental vibrations: 1 (symmetric stretch), 2 (out-of-plane bend), 3 (asymmetric
stretch), and 4 (in-plane bend). The last three are infrared active. The surface interaction with NO2 or
(NO+O2) leads to the reduction of the nitrate ion symmetry from D3h to C2v and causes the degenerated
3 mode to split into four modes, of which two are IR active (3’ and 3’’ for the high and low-frequency
component respectively).
IR spectra of adsorbed N-containing species after an exposure of Ag/Al2O3 to (NO-O2) are reported in
Figure 7B (black dotted line). After the first adsorption dose (spectra not shown), spectrum is remarkable by bands at 1313 and 1229 cm-1. The band observed at 1229 cm-1 is assigned to the
asymmetric stretch vibration (3) of the nitrite ion; the band at 1313 cm-1 to the symmetric stretching
vibration (1). For higher (NO-O2) coverage, several absorption bands are observed, unanimous
assigned to nitrates species by many authors despite some inconsistencies. For instance, Venkov et al. [48] assigned the band at 1627 (3’) and 1261 cm-1 (3’’) to bridged nitrates while the bands at 1593
(3’) and 1296 cm-1 (3’’) are due to bidentate nitrate. The bands at 1562 cm-1 associated with one
component around 1300 cm-1 corresponds to monodentate nitrate. Note that a similar coincidence
between the 3’’ vibrations of mono- and bidentate nitrates was reported in this work. Yu et al. [51]
observed monodentate (1560, 1250 cm-1), bidentate (1583, 1302 cm-1), and bridging (1612 cm-1)
nitrates after an exposure of the Ag/Al2O3 to NO+O2. Tamm et al. [52] assigned the high-frequency
component (3’) at 1611, 1586 and 1546 cm-1 to bridge-bound, bidentate and monodentate nitrates
species respectively associated to the low-frequency component at 1250 cm-1 (bidentate) and 1304
cm-1 (monodentate).
Finally, in this work, the assignments reported in Table 2 are proposed. The bands at 1254 and 1587 cm-1 and the bands at 1299 and 1547 cm-1 growth simultaneously, which indicates that they either
correspond to two surface species. With (NO+O2) coverage increase, these bands are shifted to
1244/1583 cm-1 and 1289/1562 cm-1 (black full line). In agreement with data from the literature, the
bands with maxima at 1562 and 1289 cm-1 are attributed to monodentate nitrate, and the doublet at
18
NH3 adsorption over (NO-O2) ad-species. After adsorption of (NO-O2) at equilibrium (10 hPa, bold black
line, Figure 7B), the co-adsorption of ammonia (10 hPa, gray line) was performed. It induced a decrease of the intensity of the high-frequency component (3’) of bridged (1612 cm-1) and bidentate (1583 cm -1) nitrates, but without a full consumption of adsorbed NO
x compounds after two hours at 200°C. The
3’’ band at 1289 cm-1 is shifted to higher frequency of about 1300 cm-1. Note that the s(NH3) vibration
mode of coordinated ammonia can be superimposed to the degenerated 3’’ mode of adsorbed
monodentate nitrate.
More precisely, the negative bands near 1612, 1583 and 1280 cm-1 illustrates that bridged and
bidentate nitrates are preferentially consumed by ammonia co-adsorption. The higher stability of the monodentate nitrate is in accordance with previous literature data [52]. This result shows a direct interaction between nitrates (preferentially bidentate and bridged) and NH3 on the catalyst surface.
Effect of NH3 adsorption over (EtOH-O2)+(NO-O2) ad-species. Resulting IR spectra for (EtOH-O2
)+(NO-O2)+NH3 are presented in Figure 7C. The black full line (spectrum a) corresponds to the spectrum
recorded after EtOH-O2 adsorption that is consistent with results already discussed in Figure 7A. After
evacuation and co-adsorption of NO-O2, the spectrum in black dotted line (b) exhibited a new band at
1299 cm-1which is attributed to
3’’ of monodentate nitrate. The corresponding 3' overlaps in the as(OCO) of adsorbed acetate species (1588 cm-1). To highlight adsorbed species resulting of the
co-adsorption of (EtOH-O2) and (NO-O2), these two spectra were subtracted (b-a). Nitrates species are
then clearly distinguished by bands at 1612 cm-1 (
3' bridged nitrates) and 1562 cm-1 (3' monodentate
nitrates). Co-adsorption of NH3 (spectra c, c-a and c-b), results in a strong decrease of all the bands
assigned to the nitrate species. Unlike co-adsorption (NO-O2)+(NH3), the presence of enolic and
acetates species on the catalyst surface greatly enhanced the reduction of nitrates with ammonia. In addition, the affected species are different, monodentate nitrates were almost fully consumed by NH3
in presence of EtOH.
OH and NH stretching modes. In Figure 8 is presented IR spectra recorded in the 3900-3000 cm-1
spectral range ((OH) and (NH)) for the following gas mixture co-adsorption: NO-O2, NO-O2+NH3,
EtOH-O2+NH3 and EtOH-O2+NO-O2+NH3. IR spectra are remarkable by NH stretching bands at 3390 and 3290
cm-1 assigned to coordinated ammonia. These bands are not observed when ammonia is adsorbed
alone (without NOx pre-adsorption; spectra not shown). Thus, it is proposed that when nitrates are
formed, due to their negative induction effect, they withdraw electron density from nearby Al3+ cation.
As a result, the Lewis acidity of the latter increases and nitrosyl complexes/ammonia adsorption is probably formed.
19
Figure 8. IR spectra at 200°C in (OH) and (NH) stretching region over Ag/Al catalyst. ---: reference
spectrum after calcination (400°C under vacuum); —: (NO-O2) adsorbed species; ---: (NO-O2)+(NH3)
adsorbed species; …: (EtOH-O2)+(NH3) adsorbed species …: (EtOH-O2)+(NO-O2)+(NH3) adsorbed
species.
Additionally, OH groups of alumina are characterized by complex O-H stretching band in the 3900-3500 cm-1 zone. The assignment of these bands was largely studied in the literature but is still controversial.
Among the various proposed models, the most used was proposed by Tsyganenko et al. [53,54] and completed by Knözinger et al. [55]. Five types of OH species were identified on the surface of alumina layers, depending firstly on the number of Al3+ bonding to the OH group and secondly on the
coordination number of the Al3+ ion. This model was used in this work to study the free OH group of
silver supported alumina catalyst. IR spectra reported Figure 8 are consistent with those reported in the literature, showing the different types of OH groups of alumina that display bands at 3758, 3728 and 3680 cm-1. Assignments are reported in the Table 2.
In addition, Figure 8 indicates that adsorption of reactive species (NO-O2, EtOH-O2) led to the decrease
of peaks at 3758 cm-1 and 3728 cm-1 attributed to a loss of OH surface species. These absorption bands
have been described before [56] and correspond to the O-H stretching vibration of OH groups coordinated with one aluminum atom in coordination states IV (Type Ia), and with two aluminum atoms in coordination IV and VI (type IIa), respectively.
Interestingly, new OH bands at 3598-3577, 3528, and 3470 cm-1 are observed. These bands can be
assigned to the O-H vibration of hydrogen-bonded OH groups of acids, such as HNO3 or HONO [50].
The observed acidic OH vibrations (3600-3400 cm-1) are caused by adsorbed HNO
3 or HONO, which are
20
new intermediate species are especially observed after EtOH adsorption (gray dotted line). It suggests that resulting ethanol ad-species enhance the reactivity of NOx compounds.
To conclude, IR characterization reveals that ammonia is highly reactive towards enolic ad-species. In addition, bridged and bidentate nitrates are preferentially consumed by ammonia co-adsorption, but are still observed in absence of ethanol. Finally, over surface pre-exposed to ethanol, the reactivity of NH3 with nitrates compounds is enhanced and intermediates HONO or HNO3, commonly reported as
intermediates in NOx SCR pathway, are observed.
3.2.4 Role of H* Intermediate species
IR characterization showed that ethanol ad-species are involved in the reduction of NOx compounds
by NH3 in the (EtOH+NH3)-SCR process. As mentioned in the introduction part, the first step of the
EtOH-SCR framework results in C2H5OH dissociative adsorption into surface ethoxide C2H5O* and
surface hydrogen H* species (Eq. 11) [10,24,26,57]. Thereafter, ethoxide is converted into
acetaldehyde (Eq. 12) providing a second surface-bound hydrogen ad-atoms. Figure 4 shows that acetaldehyde emission started from 175 °C (lowest tested temperature) and reached a maximum at 250°C, indicating that hydrogen ad-atoms should be available at low temperature. Addition of hydrogen into the reaction mixture was reported to enhance the deNOx efficiency in EtOH-SCR process.
It was advanced that H2 addition promotes the partial oxidation of C2H5OH to form enolic species which
mainly contribute to accelerate NOx reduction [29,58,59]. Additionally, Flura et al. [10] observed that
NO oxidation into NO2 was enhanced in presence of small amounts of H2 (167 ppm) over silver
supported catalyst. It was proposed that hydrogen is able to reduce silver particles, leading to higher oxidation performances. It is also likely that hydrogen favours the nitrates species desorption. The promotion effect of H2 co-feeding was also evidenced in hydrocarbon-SCR, with an enhancement of
the deNOx activity at low temperature [60]. However, the most significant impact of H2 addition is
observed on the H2-assisted NH3-SCR process over Ag/Al2O3 catalysts [24,32,61,62]. Consequently, the
H2 behaviour in NO reduction was examined and compared to the previously studied reductant
mixture.
First, the deNOx efficiency of Ag/Al catalyst was evaluated in H2-SCR. Figure 9 reports the NOx
conversion (full line) and the NO2 emission (dotted line) for H2-SCR, EtOH-SCR and EtOH+NH3-SCR. As
expected, no deNOx activity was observed in H2-SCR condition (brown curve). Formation of NO2 was
observed, but in a lower extent than in EtOH-SCR condition, with maximum concentrations of 130 ppm for H2-SCR (at 300°C, brown dotted line), compared with 250 ppm for EtOH-SCR (at 200°C blue dotted
21
temperature (Eq. 17). More interestingly, these experiments demonstrates that the hydrogen H*
species provided by the ethanol dehydrogenation do not directly act as NOx reductant over Ag/Al but
would rather be involved during the (EtOH+NH3)-SCR process (red curve).
To highlight the reactivity of hydrogen in the NOx reduction process by NH3, the reactivity of Ag/Al
sample was investigated in H2-assisted NH3-SCR and compared with both EtOH-SCR and (EtOH+NH3
)-SCR (Table 3). The H2 concentration was fixed in regard on the activity of ethanol dehydrogenation, i.e.
at 100 ppm and 270 ppm for temperature test of 175°C and 200°C, respectively. Compared with EtOH-SCR, NH3 addition induced an enhancement of the NOx conversion of 8 % and 25 % at 175°C and 200°C,
respectively. Interestingly, similar deNOx improvement was obtained in H2-assisted NH3-SCR despite
the low H2 concentration used. It clearly indicates that the deNOx enhancement supplied by the NH3
addition to EtOH-SCR is related to the H* species formed during ethanol oxidation.
Table 3. NOx conversions at 175 and 200°C in EtOH-SCR (1200 ppm C2H5OH), in NH3-assisted EtOH-SCR
(1200 ppm C2H5OH + 400 ppm NH3) and in H2-assisted NH3-SCR (400 ppm NH3 + 100-270ppm H2)
processes blended in 400 ppm NO, 8 % H2O, 10 % CO2, 10 % O2
Temperature (°C) NOx conv. EtOH-SCR (%) NOx conv. EtOH/NH3-SCR (%) NOx conv. gain by NH3 add. in EtOH-SCR[a] (%) NOx conv. H2-assisted NH3 -SCR[b] (%) 175 7 15 8 9 200 9 38 29 27
[a] difference between NOx conv. in EtOH-SCR with or without NH3 addition
[b] H2 amount corresponds to the quantity potentially produced by EtOH oxidation to CH3CHO during
EtOH-SCR process (100 ppm H2 at 175°C; 270 ppm H2 at 200°C).
Figure 9. NOx conversion (full line) and NO2 emission (dotted line) over Ag/Al catalyst for H2-SCR (▬),
EtOH-SCR (▬) and EtOH+NH3-SCR (▬).
0 70 140 210 280 350 0 20 40 60 80 100 150 250 350 450 550 NO 2 out ( ppm ) C onv ersio n (%) Temperature (°C)
22
3.2.5 Proposed reaction pathways
The enhancement of NOx conversion by NH3 co-feeding in EtOH-SCR over Ag/Al catalyst is clearly
evidenced (Figure 2). However, no reactivity of ammonia with carbon-based by-products was observed. It means that NH3 did not react to produce organo-nitrogen reactive intermediate. In
addition, Ag/Al sample was not significantly active to reduce NOx by NH3. Obviously, NH3 is activated
over Ag/Al catalysts only in the presence of ethanol. Moreover, the highly beneficial effect of H2
addition on the NH3-SCR process over Ag/Al2O3 catalysts is well documented and the observed
improvement in (EtOH+NH3)-SCR over Ag/Al is consistent with the amount of H* species obtained from
ethanol dehydrogenation into acetaldehyde (see section 3.2.4). Besides, IR results evidence the formation of HONO/HNO3 intermediates when ethanol and NO are co-adsorbed.
Consequently, taking into account all the data presented in this work, it is proposed that the hydrogen H* species provided by the ethanol dehydrogenation are the main responsible for the high deNO
x
efficiency at low temperature observed in the (EtOH+NH3)-SCR experiments. Based on the mechanism
presented in the introduction part, it is assumed that the HONO/HNO3 route formation is a
determining step to the NOx reduction by NH3. The effect of H* species are tentatively attributed to an
activation of the NO oxidation into reactive intermediate N-containing species, such as HONO and/or HNO3, evidenced by FTIR experiments (Figure 7). Ammonium nitrite formation (Eq. 6), which is
described as the penultimate step of deNOx chemistry with many practical catalysts, can subsequently
be formed by reaction of NH3 with nitrous acid [63].
Finally, the proposed (EtOH+NH3)-SCR process avoids the rate-limiting step of nitromethane formation
by three different routes (Scheme 2). The N2 route formation originated from EtOH-SCR (blue route in
scheme 2) is limited at low temperature by the CH3NO2 rate-determining step. Ammonia formation is
obtained only for T > 250°C [23]. Gaseous NH3 addition helps to avoid this problem. Actually, the deNOx
efficiency improvement in the (EtOH+NH3)-SCR process is not determined by the efficiency of Ag/Al
sample to directly reduce NOx by NH3. In fact, the NH3-SCR route (green dotted route in scheme 2),
only active when NO2 is formed during EtOH-SCR, has only few influence on the overall efficiency of
the system. Finally, the remarkable NOx conversion achieved with the NH3 co-feeding is assigned to
the formation of HNOx species, obtained by the generation of H* compound from the dehydrogenation
of ethanol. Ethanol can therefore be seen as a hydrogen provider, in addition to induce the oxidation of NO into NO2. The added ammonia can then follow the conventional mechanism of H2-assisted NH3
-SCR exposed in the literature. This system allows the in situ generation at low temperature of the key intermediates of the deNOx chemistry over Ag/Al sample (red route in scheme 2).
23
Scheme 2. Proposal of reaction pathway in EtOH+NH3-SCR over Ag/Al catalyst.
With a conversion ranging from 15 to 75% in the 175-250°C region, this system is efficient for NOx
removal using only NO as NOx. However, this system can be further optimized by means of a dual-bed
configuration, exposed in the next section.
3.2.6 DeNOx efficiency Improvement of the (EtOH+NH3)-SCR process: dual-bed configuration
In this section, the (EtOH+NH3)-SCR process is extended to a more complex catalytic system to obtain
a supplementary enhancement of the NOx conversion at low temperature (175-300°C) using the same
ethanol-NH3 mixture. In fact, in (EtOH+NH3)-SCR process over Ag/Al, the outlet exhaust gas still
contained some NH3 and NOx (especially including NO2) in this low temperature range. Consequently,
a dedicated SCR catalyst placed downstream the Ag/Al2O3 catalyst was supposed to allow both a
supplementary NOx abatement together with an ammonia slip restraint. Supported transition metal,
ceria based oxides such as Fe2O3/WO3/ZrO2 [38], MnOx-CeO2 [39] or WO3/CexZr1-xO2 [40] or metal
exchanged zeolite [20] are active materials for this purpose. WO3/CexZr1-xO2 catalyst was selected in
this work as NH3-SCR material, since it appeared to be active with various NO2/NOx inlet ratio including
the standard-SCR stoichiometry. Moreover, this catalyst may also act as an ammonia slip catalyst since it was reported to be active in NH3 oxidation by O2, with a full selectivity into N2 [40].
First, single WO3/Ce-Zr catalyst was evaluated in EtOH-SCR and (EtOH+NH3)-SCR with only NO as
injected NOx (SI file, Figure S3). The NOx conversion obtained with only ethanol as reductant was very
limited, with a maximum of only 7 % recorded at 300°C. This WO3/Ce-Zr catalyst is then poorly active
in NOx reduction by ethanol. To the opposite, the NOx conversion was significant in (EtOH+NH3)-SCR
condition, from 13 to 70 % in the 175-450°C temperature range. Interestingly, this catalyst is very active in Fast-NH3-SCR condition, with NOx conversion of 53% and 90 % at 170°C and 200°C, respectively.
24
Figure 10. NOx conversion (full line) and NH3 oulet concentration (dotted line) in EtOH-SCR (▬) and
(EtOH+NH3)-SCR (▬) over Ag/Al sample (), and in (EtOH+NH3)-SCR condition over Ag/Al+WO3/Ce-Zr
() dual bed system (▬).
Figure 10 reports the NOx conversion obtained in (EtOH+NH3)-SCR over the the Ag/Al+WO3/Ce-Zr dual
bed system. Compared with Ag/Al alone, a remarkable supplementary NOx conversion was obtained
at low temperature. The NOx conversion was then ranked between 46 and 95% in the 175-250°C
temperature range, while only NO was initially injected. As expected, supplementary ammonia consumption was also observed in the dual bed system. At 200°C, the overall NH3-NOx stoichiometry
respected a ratio close to 1-1. Consequently, the low temperature ammonia slip was limited, at only 115 ppm and 125 ppm NH3 at 200°C and 250°C, respectively (Figure 10). For Temperature higher than
350°C, the ammonia over injection was factually not needed since the NOx conversion already reached
100% with ethanol. Moreover, in situ produced ammonia is emitted from Ag/Al (Figure 10)., as previously reported [23]. For instance, at 350°C, the WO3/Ce-Zr catalyst is virtually submitted to 400
ppm NH3 from ammonia co-injection plus 150 ppm NH3 from the EtOH process over Ag/Al. However,
WO3/Ce-Zr then acted as an ammonia slip catalyst since approximately 50 % of this 550 ppm ammonia
excess appeared converted into N2. This apparent conversion rate reached 86 % at 450°C Nevertheless,
taking into account the whole temperature range, the (EtOH+NH3)/NOx ratio should to be adjusted (i.e.
decreased) depending on the temperature to prevent ammonia emission.
Besides, over the the Ag/Al+WO3/Ce-Zr dual bed system, NO2 emitted from the first catalytic bed
(Ag/Al sample, Figure 5, red line) was fully converted over the downstream WO3/Ce-Zr material (SI file
Figure S4). Nevertheless, the NH3-NO-NO2 stoichiometry over the WO3/Ce-Zr sample did not
correspond to only the fast SCR reaction, NO2 appeared partially reduced into NO: at 200°C, 128 ppm
0 100 200 300 400 500 0 20 40 60 80 100 150 250 350 450 550 NH 3 ou let con cen tr atio n (pp m ) NO x con v ersio n (%) Temperature (°C)
25
NOx are supplementary converted into N2 in the dual-bed configuration, while 154 ppm NO2 and 285
ppm NH3 are converted.
In order to confirm that the efficiency gain observed in Figure 10 arose from a synergy effect between the two catalytic materials Ag/Al and WO3/Ce-Zr, (EtOH+NH3)-SCR experiments were performed over
single Ag/Al and WO3/Ce-Zr catalysts with doubled catalytic weight (200 mg), i.e. with the same catalyst
weight/molar flow (W/F) ratio than for the dual bed set-up. Results presented in SI file (Figure S5) indicate significantly lower deNOx efficiency in the 175-250°C temperature range over single catalysts
compared with the dual-bed system. Obviously, this result illustrates the benefit of the (EtOH+NH3
)-SCR process with the dual bed configuration.
Finally, the deNOx efficiency obtained in (EtOH+NH3)-SCR condition over the dual-bed system was
similar to the activity observed in the most favourable fast-SCR stoichiometry over single WO3/Ce-Zr
sample reported in SI file, Figure S3. This result is also better than that obtained over a patented iron exchanged ferrierite (Fe/FER) using the same set-up. In fact, results reported in [64] and in Figure S6 show that the NOx conversion in standard-SCR condition is limited from 58 to 69 % in the 200-500°C
temperature range. A 2.8%Cu /FER was also evaluated and exhibited conversions close to Ag/Al in (EtOH+NH3)-SCR condition (Figure S6), without reaching the efficiency reported on the combined Ag/Al
+ WO3/Ce-Zr in (EtOH+NH3)-SCR condition.
To conclude, a remarkable deNOx efficiency was obtained at low temperature over Ag/Al+WO3/Ce-Zr
dual bed catalysts devoted to the (EtOH+NH3)-SCR process. NOx conversion then reached 70 % at
200°C, compared with 7 % in EtOH-SCR over Ag/Al. Additionally, the deNOx efficiency of this
(EtOH+NH3)-SCR process is no longer determined by the activity of the upstream oxidation catalyst
(DOC) since results presented in this work were without NO2 in the inlet feed stream.
4. Conclusion
This work demonstrates that co-feeding ammonia and ethanol on a Ag/Al2O3 catalyst enables a drastic
enhancement of the NOx conversion at low temperature (175-250°C) using only NO as NOx (standard
SCR condition). The (EtOH+NH3)-SCR over Ag/Al catalyst has superior NOx reduction efficiency than
both NH3-SCR and EtOH-SCR in the temperature range 175-500°C. It is proposed that the hydrogen H*
species provided at low temperature by the ethanol dehydrogenation is the main responsible for the deNOx efficiency improvement, in addition to the beneficial concomitant NO2 formation observed at
low temperature with ethanol. Further deNOx improvement was obtained over a dual-coupled
26
remaining NH3 and NO2 from Ag/Al catalyst. A promising efficiency of 70% of NOx converted at 200°C
was reached, without dependence to the activity of the upstream oxidation catalyst (DOC).
The present results also have practical implications. A unique aqueous solution containing both urea (NH3 carrier) and ethanol could be used for this purpose, also allowing carrying away a much higher
amount of reductant species versus the conventional AdBlue solution.
Acknowledgement
Authors thank the Regional Council of Poitou-Charentes and the French Ministry of Research for financial support.
27
Supplementary information file
SI-1: Characterization of Ag/Al by TEM.
Transmission Electron Microscopy (TEM) micrographs were recorded on JEOL 2100 instrument (operated at 200 kV with a LaB6 source and equipped with a Gatan Ultra scan camera). TEM
experiments showed that Ag/Al2O3 presents small silver particles, most of the particles ranging below
3 nm (Figure S1).
Figure S1. A: Representative TEM images obtained for Ag/Al sample; B: Corresponding silver particle
28
SI-2: Design of the IR cell for high temperature in situ adsorption of probe molecule.
The home-made designed cell (Figure S2) allows in situ treatment and high temperature adsorption of probe molecule. The design of this specific IR cell enables to collect IR spectrum of adsorbed species and gaseous compounds at the same temperature.
Figure S2. Design of the home-made IR cell for high temperature in situ adsorption of probe
29
SI-3: Catalytic behaviors of WO
3/Ce-Zr sample.
Before use in the dual-bed catalytic system, the WO3/Ce-Zr sample was firstly evaluated alone with
various reaction mixtures depicted in table S1. Corresponding NOx conversions depending on the temperature are depicted in Figure S3.
Table S1. Composition of the Gas mixtures of the SCR tests (total rate: 333 mL min-1).
Catalytic test NO (ppm) NO2 (ppm) NH3 (ppm) C2H5OH (ppm) H2 (ppm) O2 (%) CO2 (%) H2O (%) N2 Fast-NH3-SCR 200 200 400 10 10 8 balance EtOH-SCR 400 1200 10 10 8 (EtOH+NH3)-SCR 400 400 1200 10 10 8
Figure S3. NOx conversion in EtOH-SCR (▬) and (EtOH+NH3)-SCR (▬) and Fast NH3-SCR (▬) over
WO3/Ce-Zr catalyst ().
(400 ppm NO, 1200 ppm C2H5OH, with or without 400 ppm NH3, 8 % H2O, 10 % CO2, 10 % O2
balanced in N2).
The NOx conversion obtained with only ethanol as reductant (blue full line, Figure S3) was very
limited, with a maximum of only 7 % at 300°C. It results that WO3/Ce-Zr catalyst is not efficient to
reduce NOx by ethanol. To the opposite, for the (EtOH+NH3)-SCR condition, the NOx conversion (full
red line) was significant, from 13 to 70 % in the 175-450°C temperature range. Finally, this catalyst is very active in Fast-NH3-SCR condition, with NOx conversion of 53% and 90 % at 170°C and 200°C,
respectively. 0 20 40 60 80 100 150 250 350 450 550 NO x c o n v er sion ( % ) Temperature (°C)
30
SI-4: NO
2emission in dual-bed configuration.
Figure S4. NOx conversion (full line) and NO2 outlet (dotted line) over Ag/Al () and dual-bed
Ag/Al+WO3/Ce-Zr () system for (EtOH+NH3)-SCR process.
During EtOH-SCR experiments over Ag/Al2O3 catalyst, significant NO2 emission was recorded outlet.
The addition of NH3 led to a decrease in the NO2 outlet concentration. However, unconverted NO2
was still available. By adding a dedicated NH3-SCR sample downstream the Ag/Al2O3 catalyst, a full
consumption of the emitted NO2 was recorded (Figure S4). Consequently, the dual-bed system takes
advantage of the remaining unconverted NO2 and NH3 to enhance the deNOx efficiency.
0 60 120 180 240 300 0 20 40 60 80 100 150 350 550 NO 2 o u t ( p p m) NO x c o n v er sion ( % ) Temperature (°C)
31
SI-5: Effect of catalytic weight in (EtOH+NH3)-SCR over dual and single bed
With the co-injection of ethanol and NH3, a remarkable deNOx activity was reached at low
temperature using the dual bed configuration (red curve, Figure S5). To ensure that the efficiency gain provided by the dual bed configuration arose from a synergy effect between the two catalytic materials Ag/Al (100 mg) + WO3/Ce-Zr (100 mg), (EtOH+NH3)-SCR experiments were performed over
single Ag/Al and single WO3/Ce-Zr catalysts with doubled catalytic weight (200 mg).
Figure S5 clearly shows a higher deNOx efficiency over the dual-bed system. SCR experiments
performed with doubled weight over single Ag/Al or WO3/Ce-Zr materials did not allow the NOx
conversion achieved over the dual bed configuration. Obviously, this result illustrates the synergetic effect denoted over Ag/Al+WO3/Ce-Zr association.
Figure S5. NOx conversion in (EtOH+NH3)-SCR over single Ag/Al (200 mg, ), single WO3/Ce-Zr (200
mg, ) or dual bed Ag/Al+WO3/Ce-Zr (100+100 mg, ) system.
SI-6: Comparison with metal exchanged zeolite catalysts.
Metal exchanged zeolite-based catalysts, devoted to NH3-SCR process, were reported to be relevant
materials for the NOx abatement of mobile source. A variety of zeolites have been proposed (ZSM-5, mordenite, beta, ferrierite, Y-zeolite, chabazite,…) and in the last few years, new generations of iron or copper exchanged zeolites based on small pore materials have emerged. As a consequence, iron or copper-exchanged ferrierite (FER) samples have been evaluated in NH3-SCR in our laboratory
(Figure S6).
A patented thermos-resistant Fe/FER zeolithe dedicated to NOx treatment from vehicles was evaluated in standard SCR with NH3 using the same catalytic bench (same total flow rate and NOx
concentration, and the same catalyst mass) [M. Seneque, X. Courtois,F. Can, D. Duprez, Top. Catal.59 (2016) 938-944]. Results reported in Figure S5 show that the deNOx efficiency is limited from 58 to
69% in the 200-500°C temperature range (NOx conversion in Fast-SCR condition reached around 97%
0 20 40 60 80 100 150 250 350 450 550 NO x Con v er sion ( % ) Temperature (°C)
32
in the whole temperature range [Top. Catal.59 (2016) 938-944]). It clearly evidences that this iron-exchanged sample is strongly dependant to the NO2/NOx inlet ratio.
In addition, a 2.8% Cu/FER was very recently prepared at the laboratory by ion exchange in a host zeolite provided by Sigma Aldrich. After hydrothermal ageing at 700°C, this sample was evaluated in standard NH3-SCR, but with a quite higher total flow rate/catalyst mass ratio (5 versus 3.33) and with
500 ppm NO in the reaction mixture. This Cu/FER sample exhibited a different behaviour compared with Fe/FER, with a limited deNOx efficiency at low temperature but a full NOx reduction from 300°C.
Indeed, the NOx conversion profile was similar to that recorded over Ag/Al in (EtOH+NH3)-SCR
condition. Taking into account the corresponding experimental set-up (total flow rate, catalyst weight, NO inlet concentration), the activities at 200°C are 1.67 10-5 mol
converted NO /min /gcata and 1.50
10-5 mol
converted NO /min /gcata for Ag/Al in EtOH+NH3 condition and Cu/FER in standard SCR condition,
respectively. Consequently, the activity is 11 % higher at this temperature with the (EtOH+NH3)-SCR.
Figure S6. NOx conversion in EtOH-SCR (▬) and (EtOH+NH3)-SCR (▬) over Ag/Al sample, and in
(EtOH+NH3)-SCR condition over Ag/Al+WO3/Ce-Zr dual bed system (▬).
For comparison, NOx conversion obtained in NH3-SCR over zeolite-base catalysts are also reported:
patented Fe/FER (▪▪▪) and 2.8% Cu/FER (▪▪▪).
Finally, the deNOx efficiency of the (EtOH+NH3)-SCR process is significantly higher than that obtained
over zeolite based catalysts, especially when a specific NH3-SCR sample is associated downstream to
Ag/Al in a dual-bed configuration. This combined dual-bed system (Ag/Al+WO3/Ce-Zr) achieved a
remarkable NOx conversion of 70 % at 200°C, compared to 20 % for Cu/FER sample when only NO
was introduced as NOx. 0 20 40 60 80 100 150 250 350 450 550 NO x c o n v er sion ( % ) Temperature (°C)
33 References
[1] R.N. Colvile, E.J. Hutchinson, J.S. Mindell, R.F. Warren, Atmos. Environ. 35 (2001) 1537-1565. [2] G. M. Whitesides, Angew. Chem. Int. Ed. 54 (2015) 3196-3209.
[3] J. Kašpar, P. Fornasiero, N. Hickey, Catal. Today 77 (2003) 419-449.
[4] D. Chatterjee, O. Deutschmann, J. Warnatz, Faraday Discuss. 119 (2001) 371-384.
[5] W. Yang, R. Zhang, B. Chen, D. Duprez, S. Royer, Environ. Sci. Technol. 46 (2012) 11280−11288. [6] J. Liu, X. Li, Q. Zhao,C. Hao, D. Zhang, Environ. Sci. Technol. 47 (2013) 4528−4535.
[7] F. Figueras, J.L. Flores, G. Delahay, A. Bourane, J.-M. Clacens, A. Desmartin-Chomel, B. Coq, A. Giroir-Fendler, Top. Catal. 39 (2006) 59-64.
[8] F. Poignant, J. Saussey, J.C. Lavalley, G. Mabilon, J. Chem. Soc., Chem. Commun. (1995) 89-90. [9] L. Capek, K. Novoveska, Z. Sobalık, B. Wichterlova, L. Cider, E. Jobson, Appl. Catal. B 60 (2005) 201–210.
[10] A. Flura, X. Courtois, F. Can, S. Royer, D. Duprez, Top. Catal. 56 (2013) 94-103. [11] P. Forzatti, I. Nova, E. Tronconi, Angew. Chem. Int. Ed. 48 (2009) 8366-8368. [12] M. Koebel, M. Elsener, G. Madia, Ind. Eng. Chem. Res. 40 (2001) 52-59.
[13] A. Grossale, I. Nova, E. Tronconi, D. Chatterjee, M. Weibel, Top. Catal. 52 (2009) 1837-1841. [14] I. Nova, C. Ciardelli, E. Tronconi, D. Chatterjee, B. Bandl-Konrad, Catal. Today 114 (2006) 3-12. [15] Y.H. Yeom, J. Henao, M.J. Li, W.M.H. Sachtler, E. Weitz, J. Catal. 231 (2005) 181-193.
[16] Y.H. Yeom, B. Wen, W.M.H. Sachtler, E. Weitz, J. Phys. Chem. B 108 (2004) 5386-5392. [17] M. Li, J. Henao, Y. Yeom, E. Weitz, W.M.H. Sachtler, Catal. Lett. 98 (2004) 5-9.
[18] M. Li, Y. Yeom, E. Weitz, W.M.H. Sachtler, Catal. Lett. 112 (2006) 129-132. [19] Y.H. Yeom, M. Li, W.M.H. Sachtler, E. Weitz, J. Catal. 246 (2007) 413-427.
[20] « Urea-SCR Technology for deNOx after treatment of Diesel Exhausts, I. Nova and E. Tronconi
eds, Springer 2014 DOI 10.1007/978-1-4899-8071-7.
[21] A. Flura, F. Can, X. Courtois, S. Royer, D. Duprez, Appl. Catal. B 126 (2012) 275-289. [22] Y.H. Yeom, M. Li, W.M.H. Sachtler, E. Weitz, J. Catal. 238 (2006) 100-110.
[23] F. Can, A. Flura, X. Courtois, S. Royer, G. Blanchard, P. Marécot, D. Duprez, Catal. Today 164 (2011) 474-479.
[24] Y.F. Tham, J-Y.C. Chen, R.W. Dibble, Proc. Combust. Inst. 32 (2009) 2827-2833. [25] S. Kameoka, T. Chafik, Y. Ukisu, T. Miyadera, Catal. Lett. 55 (1998) 211-215. [26] J. Deng, J. Wang, X. Xu, Catal. Lett. 35 (1995) 75-88.
[27] K. Eränen, F. Klingstedt, K. Arve, L. Lindfors, D.Y. Murzin, J. Catal. 227 (2004) 328-343. [28] J. Shibata, K. Shimizu, Y. Takada, A. Shichi, H. Yoshida, S. Satokawa, A. Satsuma, T. Hattori, J. Catal. 227 (2004) 367–374.
[29] X. Zhang, H. He, Z. Ma, Catal. Commun. 8 (2007) 187-192. [30] S. Fogel, P Gabrielsson, Appl.Catal. B 158-159 (2014) 1–10. [31] K-I. Shimizu, A. Satsuma, Appl. Catal. B 77 (2007) 202-205. [32] M. Richter, R. Fricke, R. Eckelt, Catal. Lett. 94 (2004) 115-118.
[33] V. Houel, P. Millington, R. Rajaram, A. Tsolakis, Appl. Catal. B 73 (2007) 203-207. [34] V. Houel, P. Millington, R. Rajaram, A. Tsolakis, Appl. Catal. B 77 (2007) 29-34.
[35] B. Sawatmongkhon, A. Tsolakis, S. Sitshebo, J. Rodriguez-Fernandez, M. Ahmadinejad, J. Collier, R.R. Rajaram, Appl. Catal. B 97 (2010) 373-380.
[36] T. E. Hoost, R-J. Kudla, K. M. Collins and M. S. Chattha, Appl. Catal. B 13 (1997) 59-67. [37] T. Sato, S. Goto S, Q. Tang, S. Yin, J. Mater. Sci. 43 (2008) 2247-2253.
[38] N. Apostolescu, B. Geiger, K. Hizbullah, M.T. Jan, S. Kureti, D. Reichert, F. Schott, W. Weisweiler, Appl. Catal., B 62 (2006) 104-114
[39] G. Qi, R.T. Yang, R. Chang, Appl. Catal. B. 51 (2004) 93-106.