HAL Id: hal-01893877
https://hal.archives-ouvertes.fr/hal-01893877
Submitted on 13 Apr 2021
HAL is a multi-disciplinary open access
archive for the deposit and dissemination of
sci-entific research documents, whether they are
pub-lished or not. The documents may come from
teaching and research institutions in France or
abroad, or from public or private research centers.
L’archive ouverte pluridisciplinaire HAL, est
destinée au dépôt et à la diffusion de documents
scientifiques de niveau recherche, publiés ou non,
émanant des établissements d’enseignement et de
recherche français ou étrangers, des laboratoires
publics ou privés.
optical properties of Cryptomonas sp. to light and
nitrogen stresses
A. Sciandra, L Lazzara, Hervé Claustre, M. Babin
To cite this version:
A. Sciandra, L Lazzara, Hervé Claustre, M. Babin. Responses of growth rate, pigment composition
and optical properties of Cryptomonas sp. to light and nitrogen stresses. Marine Ecology Progress
Series, Inter Research, 2000, 201, pp.107 - 120. �10.3354/meps201107�. �hal-01893877�
INTRODUCTION
Cryptophytes and some rhodophytes can be distin-guished from other eucaryotic micro-algae by the pres-ence of green-orange absorbing phycobiliproteins (PBPs). Different PBPs have been studied essentially in Cyanophyceae: allophycocyanin (AP), phycocyanin (PC) and phycoerythrin (PE), which harvest photons at different wavelengths (λ) between 520 and 660 nm. Clustered within phycobilisomes at the surface of thy-lakoids, these biliproteins constitute the major
light-harvesting pigments. The light-light-harvesting system in the Cryptophyceae differs from that in the Cyano-phyceae and RhodoCyano-phyceae; it does not consist of phy-cobilisomes and contains only a single biliprotein, PC or PE (Rowan 1989). Electron microscopic studies indi-cate that the biliproteins may be positioned within the intrathylakoidal spaces (Gantt et al. 1971).
As the amount of cell PE depends simultaneously upon light and nitrogen conditions, it is difficult to dis-tinguish the different acclimation modes of Crypto-phyceae to environmental factors. Abundance and composition of chromoproteins seem to follow 3 major regulations: (1) Chromatic adaptation fits the pigment composition to the spectral composition of the
photo-© Inter-Research 2000 *E-mail: sciandra@obs-vlfr.fr
Responses of growth rate, pigment composition
and optical properties of
Cryptomonas sp. to
light and nitrogen stresses
A. Sciandra
1,*, L. Lazzara
2, H. Claustre
3, M. Babin
31Laboratoire d’Océanographie Biologique et Ecologie du Plancton Marin, ESA-CNRS 7076, Université P.M. Curie Paris VI, Station Zoologique, BP 28, 06234 Villefranche-sur-Mer, France
2Dipartimento di Biologia Vegetale, via Micheli 1, 50121 Firenze, Italy
3Laboratoire de Physique et Chimie Marines, ESA-CNRS 7077, Université P.M. Curie Paris VI, BP08, La Darse, 06238 Villefranche-sur-Mer, France
ABSTRACT: The cryptophyte Cryptomonas sp. was cultured in nitrogen- and light-limited conditions
to investigate relationships between inherent optical properties (absorption and fluorescence), pig-ment contents, N/C ratio and somatic growth rate. The 2 limitations induced large variations in phy-coerythrin (PE) and chlorophyll a (chl a) contents, with a significantly higher variation in PE than chl a
under nitrogen stress. Under N limitation, there is a significant relationship between the PE/chl a
ratio and the growth rate. In the case of light perturbation, the ratio PE/chl a was slightly modified
during photoacclimation. Emission and excitation spectra of PE and chl a showed that the coupling
efficiency between these pigments is less affected by nitrogen than by light changes. It is suggested that transfer of energy between PE and chl a is regulated differently when growth is limited by light
or nitrogen. Under nitrogen deprivation, the pool of PE is preferentially degraded to reduce the energy transmitted to chl a, and to support the N demand. Under a light change, the energy
har-vested by PE and transferred to chl a is regulated by the coupling efficiency between the 2 pigments,
and secondarily by synthesis or degradation of the PE quota. For each limitation, different relation-ships are shown between optical characteristics based on fluorescence ratios and growth rate. KEY WORDS: Cryptophyceae · Growth rate · Quota · Chlorophyll a · Phycoerythrin · Absorption ·
Fluorescence · Photoacclimation · Nitrogen limitation · Light limitation
synthetically available radiation (PAR) (Tandeau de Marsac & Houmard 1988, 1993, Grossman 1990, Gross-man et al. 1994, Campbell 1996). (2) Photoacclimation regulates the amount of cell pigments to optimize the flux of energy absorbed by the cells as a function of ir-radiance and their metabolic requirements (Kana & Glibert 1987a,b). (3) The PBP pool is dependant on ni-trogen availability. The relationship between the N sta-tus and the PBP content is not straightforward, because it reflects at least 2 kinds of metabolic regulation. Firstly, when nitrogen-limiting conditions lead to un-balanced fluxes of C and N, carbon fixation is down-shifted by reducing the energy transferred from PBPs to Photosystem II (PSII) (Allen et al. 1990, Turpin 1991). This uncoupling may parallel the denaturation of PBPs. Secondly, it is hypothesized that PBPs constitute cell re-serves in the case of nitrogen deprivation (Carr 1988). For instance, non-nitrogen-fixing cyanobacteria can use their PBPs by degrading the linker polypeptides of phycobilisomes, inducing rapid cell bleaching (Collier & Grossman 1992, 1994). Wyman et al. (1985) have sug-gested that Synechococcus sp. Strain DC2 can develop
a nonphotosynthetic pool of free PE usable as a nitro-gen source if necessary, but this point is under debate (Glibert et al. 1986, Kana & Glibert 1987b). Degradation may be passive (no synthesis of new biliproteins during cell division leading to progressive pigment dilution) or active (breakdown of existing biliproteins). Different studies have shown that the nitrogen from protease PBP degradation (Foulds & Carr 1977, Woods & Hasel-korn 1980) is used for the synthesis of new proteins (Allen & Hutchison 1980, Boussiba & Richmond 1980, Duke & Allen 1990). Kana et al. (1992) have noticed specific adaptations in different natural strains of Syne-chococcus confronted with N limitation. Oceanic
spe-cies, unable to store important reserves and exposed to variable nutritive conditions, retain their phycobili-somes for some time after nitrogen deprivation. This al-lows them to quickly resume optimal photosynthetic ac-tivity in the event of N enrichment. Inversely, this adaptive strategy does not exist in coastal strains, in which N-limiting conditions lead rapidly to the break-down of phycobilisomes and synthesis of new proteins. Most studies concerning phytoplankton acclimation focus on the response of growth to either photon or nu-trient flux. However, the growth response to the most limiting factor (sensu Liebig 1840) is not independent from the state of any other factor, if the latter is at a sub-optimal level (Sciandra et al. 1997). In dynamic environ-ments such as fronts or tidal regions, mesoscale and sub-mesoscale motions can induce rapid variations in cell-growth factors, forcing phytoplanktonic communities to adapt their metabolism to the nature of the limitation. Since nutrient and photon fluxes govern metabolic N and C pathways which are internally coupled, the study
of a common cell index responding to both these fluxes, as PE or chl a, should provide new insights into the
adap-tive processes involved. In contrast to cyanobacteria, marine Cryptophyceae have been poorly studied. This work presents experimental results on how Crypto-monas sp. regulates its internal pool of PBPs to optimize
its growth rate under light and nitrogen stresses. Sym-bols and units used herein are listed in Table 1.
MATERIALS AND METHODS
Cultures. The Cryptomonas sp. strain was isolated
from natural populations in the Gulf of Naples (Thy-rrenian Sea) by L.L. and maintained in f/2 Guillard medium at 19°C. To induce nitrogen (N) enrichment and starvation of Cryptomonas sp. cells, two 5 l NO3
-limited continuous cultures were exposed continuously to similar PAR and constant temperature (20°C). Details for the chemostats and enriched sea-water composition are described in Bernard et al. (1996). In the LN–HN (low N → high N) culture (PAR = 112 µmol quanta m–2s–1in the center of the reactor), cells previ-ously N-starved were submitted to a NO3 pulse
(250 µM). In the HN–LN (high N → low N) culture (PAR = 95 µmol quanta m–2 s–1), N limitation was
achieved by replacing the previous renewal medium with one lacking NO3. Fig. 1 shows how the dilution
rates (Dt) and the NO3 concentration in the renewal
medium were adjusted in order to maintain concen-trated suspensions of Cryptomonas sp. in each
chemo-stat before and after N perturbations. The effects of PAR variation were studied in one 6 l batch HL–LL (high light → low light) culture. Cells were previously adapted to high PAR (550 µmol quanta m–2 s–1) over
9 d, during which times the culture was diluted with new medium every 3 d. Twenty-four hours after the last dilution, PAR was reduced to 18 µmol quanta m–2
s–1by covering the culture vessel with a neutral screen.
NO3and NO2concentrations were determined with
a Technicon chain analyzer. Algae size spectra were obtained with the optical particle counter Hiac-Royco (Pacific Scientific). The frequency of data acquisition was adjusted accordingly to the dilution rate to prevent a decrease in the culture volumes, and was around 1 sampling every 3 h for the particle counts and 1 sam-pling every 6 h for the NO3and NO2measurements.
Nutrient and cell counts were monitored by the appa-ratus described in Bernard et al. (1996). NH4+ was
occasionally determined in the enrichment medium and in the cultures, and was always undetectable.
Growth rate. The rates of growth (µv) and cell
divi-sion (µn) were respectively calculated from the
varia-tions of biovolume (v, the product of cell density and
(1)
where xn,vis the smoothed (5 data points average) cell
number or cell biovolume, and Dtthe dilution rate at
time t.
Spectral absorption. The spectral values of the absorption coefficient a(λ) of the algal cells were mea-sured in 1 cm quartz cuvettes with a dual beam spec-trophotometer (DMS-100 Varian) (see Fig. 2). Cuvettes were placed at the entrance of an integrating sphere. Measurements spanned from 380 to 750 nm with 1 nm increments, with filtered media from the culture (0.2 µm syringe filter, Sartorius) used as reference. The significant correlation between a(750) and cell density
and total carbon was interpreted as scattering during the absorption measurements. To rectify this bias, we assumed that Cryptomonas sp. exhibits no absorption
at 750 nm, and that scattering is wavelength-inde-pendent; a(750) was thus simply subtracted from a(λ). A final spectrum was obtained by averaging the spec-tra of 3 different samples corrected for the baseline. Depending on the algal concentration, the repro-ducibility of the 3 scans ranged between 3 and 10%.
Cell quota. Triplicates of 10 ml were filtered onto precombusted GF/F filters and kept in a dry-heat bath at 60°C before particulate carbon and nitrogen analyses were made with a LECO 900 CHN analyzer. For pigment determinations, 10 or 20 ml of culture (depending on the cell concentration) were filtered onto Whatman GF/F filters which were subsequently stored in liquid nitrogen before analysis (performed within 2 mo after sample collection). Extraction was in 3 ml cold methanol with a known amount of Zn(II) pyropheophorbide octadecyl ester as internal stan-dard (Mantoura & Repeta 1997). The extraction effi-n v n v n v t x x t D , , , = 1 d + d
Symbols Significance Units
λ Light wavelength in vacuo nm
φTPE–chl a Quantum yield of energy transfer from chl a to phycoerythrin Dimensionless
φDPE Quantum yield of heat dissipation Dimensionless
φFPE, φFchl a Quantum yield of PE and chl a fluorescence respectively Dimensionless
µn, µv Cell division and growth rates, respectively d–1 a(λ) Absorption coefficient of cell suspension at wavelength λ m–1
acm(λ) Absorption coefficient of cellular matter m–1
asol(λ) Absorption coefficient of cellular matter ideally dispersed into solution m–1
a*extPE(547) Specific absorption coefficient of PE extracted in phosphate buffer m–1
d Cell diameter µm
C Carbon –
Chl a Chlorophyll a –
DCMU Dichlorophenyl dimethylurea –
Dt Dilution rate at time t d–1 E(λ) Light energy at wavelength λ Quanta m–2s–1
F (λex,λem) Fluorescence measured at λemfor an excitation at λex(em = emission) Quanta m– 3s–1
F1 Ratio of PE fluorescence to chl a fluorescence when PE alone is excited Dimensionless F2 Ratio of chl a fluorescence when PE is excited, to chl a fluorescence when chl a
is excited in presence of DCMU Dimensionless HL–LL Batch culture submitted to light reduction (high light → low light) – HN–LN Continuous culture submitted to N deprivation (high nitrogen → low nitrogen) –
KTPE – chl a Rate constant of PE-chl a energy transfer s–1
KDPE Rate constant of PE heat dissipation s–1
KFPE Rate constant of PE fluorescence s–1
LN–HN Continuous culture submitted to N supply (low nitrogen → high nitrogen) – N, NO3, NO2, NH4 Nitrogen, nitrate, nitrite and ammonium, respectively µM
PAR Photosynthetically available radiation µmol quanta m–2s–1
PBP Phycobiliprotein –
PE Phycoerythrin –
qN, qC, qPE, qchl a N, C, PE and chl a quota, respectively, defined as amount of material per unit
cell volume mg µm– 3
Qa(λ) Mean efficiency factor for absorption by phytoplanktonic cells Dimensionless
Table 1. List of symbols used
ciency was improved by sonication for 30 s and the extract was then clarified by filtration (Whatman GF/C). The HPLC procedure is described by Vidussi et al. (1996).
The concentration of PE was indirectly estimated from absorption measurements of a(547) as:
(2) PE sol extPE = a a ( ) * ( ) 547 547
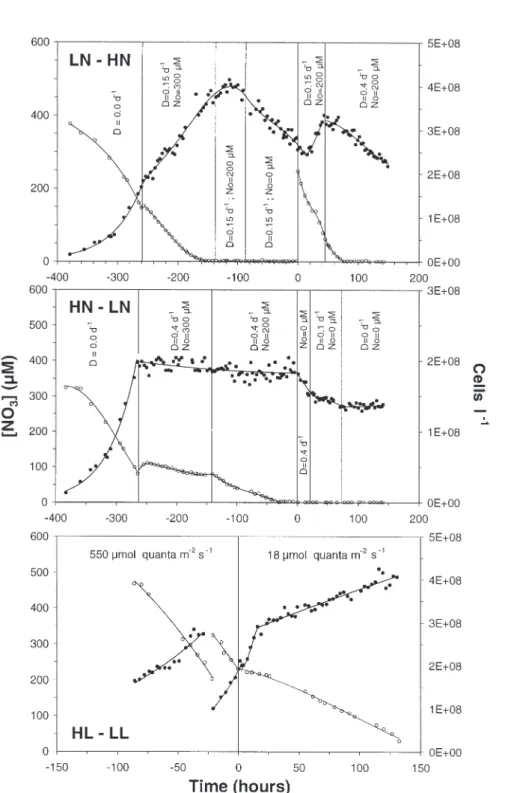
Fig. 1. Cryptomonas sp. Variations in cell density (D) and NO3concentration (s) in chemostats LN–HN and HN–LN, and in batch
culture HL–LL as a function of time. At time 0, NO3was added to LN–HN, the supply of NO3was stopped in HN–LN, and
the light was shifted down in HL–LL. Discontinuity at time –25 h in HL–LL culture resulted from manual dilution. Vertical bars delimit time periods with different dilution rates (Dt) and NO3concentrations in enrichment medium (No). LN–HN: low
where a*extPE(547) is the specific absorption coefficient
of PE extracted in solution (0.0029 m2 mg–1 in
phos-phate buffer: MacColl et al. 1976) and asol(547) is the
theoretical absorption of PE contained in the cells were it unpacked and dissolved in solution, i.e. the extrapo-lation of a(547) to cells of zero diameter. If the cell
phy-coerythrin were uniformly distributed in the medium, the absorption coefficient asol(547) would be the same
as that measured in suspension, a(547), but modified
by a flattening factor. The extent of this spectral flat-tening arising from pigment packaging was expressed by Morel & Bricaud (1981) as Qa*(λ), the ratio of the
absorption coefficient of the suspension to the
absorp-tion coefficient of the same absorbing material in solu-tion:
(3) which can also be expressed as
(4) where Qa(λ) is the absorption efficiency of 1 spherical
cell with diameter d:
(5) Q a n d a t λ λ π ( ) = 4 ( )2 Qa Q a *λ λ ρ ( ) = 3 ( ) 2 ’ Q a a a * sol λ λ λ ( ) = ( )( )
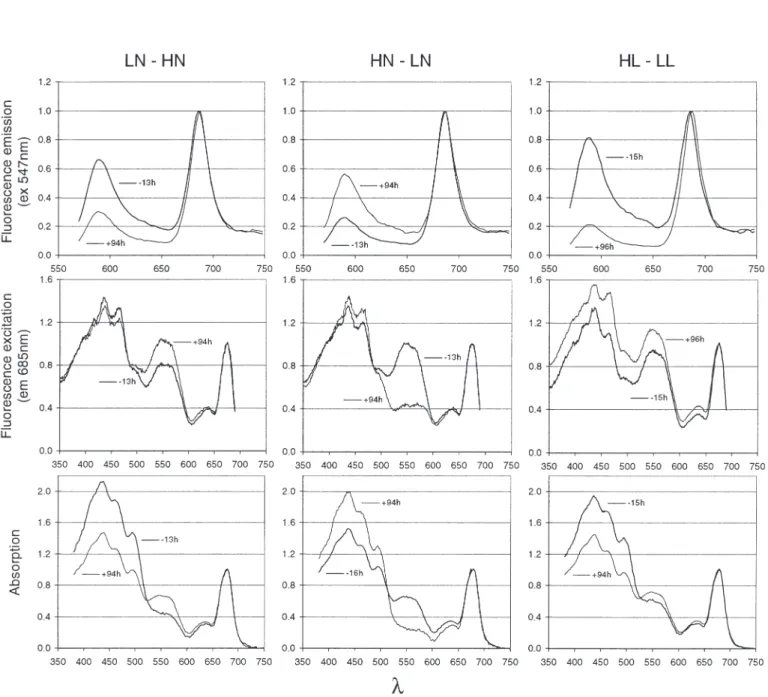
Fig. 2. Cryptomonas sp. Examples of fluorescence emission (ex 547 nm), fluorescence excitation (em 685 nm) and absorption
nt being the cell concentration. ρ’ is the product of d
and acm(λ), the absorption of cell material, is
Qa(λ), for spherical particles (van de Hulst 1957), has a
monotonic non-linear relationship with ρ’:
(6) Then, using the value of Qacalculated from Eq. (5), it
is possible to solve numerically Eq. (6) to obtain the values of ρ’, acm(λ) and asol(λ).
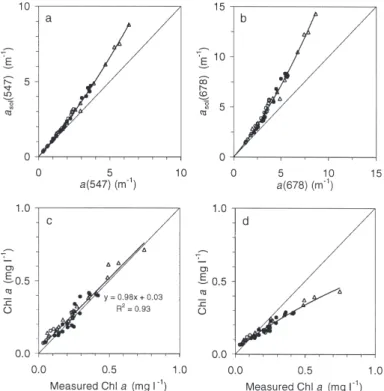
The package-effect for PE and chla absorption can
be seen in Fig. 3a,b, where the ratio of a(λ) to asol(λ)
decreases with increasing the pigment concentration. The data points form a clear curvilinear relationship because: (1) the cell concentration was stable in chemo-stats and, therefore, a(λ) variations reflect essentially changes in ρ’ and (2) in the HL–LL culture, variations in the cell concentrations are well-correlated with ρ’. In order to test the validity of this method in estimat-ing the pigment concentration, Eqs. (2) & (4) were applied to chla absorption values at 678 nm, taking a
specific absorption coefficient of 0.020 m2 mg–1. The
calculation of asol(678) provides a linear relationship
between measured and calculated chl a (Fig. 3c),
whereas the use of a(678) provides a curvilinear and
underestimated estimation of the measured chl a
because of the packaging-effect (Fig. 3d).
qN, qC, qPEand qchladenote, respectively, the N, C,
PE and chl a quota, defined as the amount of material
per unit cell volume.
Fluorescence spectra. Fluorescence excitation and emission spectra at room temperature were measured
on Cryptomonas sp. suspensions in 1 cm quartz
cuvettes, using quantum-correcting (oxazin and rho-damine) fluorescence spectrometers (PerkinElmer, LS5b and Spex, Fluorolog 2). The photosynthesis inhibitor DCMU was added at a final concentration of 20 µM, and the filtered samples were used for blank subtraction (Lazzara et al. 1996). Emission spectra were scanned both in the range 600 to 750 nm with excitation of chlorophyll a at 440 nm, and in the range
570 to 750 nm with excitation of PE at 547 nm. All emis-sion spectra were corrected for the instrument spectral response using a Li-Cor calibrated 200 W quartz-halo-gen tungsten filament lamp with known spectral irra-diance (Li-Cor calibrator, LI1800-02). Excitation spec-tra were measured with emission at 685 nm in the range 350 to 690 nm and with emission at 730 nm in the range 350 to 690 nm. The relative variations of the energy transfer from PE to chl a were assessed by
using 2 fluorescence [F(λex,λem)] ratios obtained
from the emission spectrum of PE and the excita-tion spectrum of chl a (Fig. 2).
F1 is defined as the ratio of PE fluorescence to
chl a fluorescence when PE alone is excited in the
presence of DCMU:
where: F(547, 590) = E(547) a(547)φFPE and
F(547, 685) = E(547) a(547)φFchl aφTPE– chl a, and
E(λ)a(λ) = energy absorbed at wavelength λ. The energy of each photon absorbed at 547 nm may be either transferred to chl a, dissipated as
heat, or re-emitted as fluorescence at 590 nm. Energy transfer (T), dissipation (D), and fluores-cence (F) occur with probabilities defined by the following respective quantum yields:
where φTPE– chl a + φDPE + φFPE = 1 and KTPE –chl a,
KDPE and KFPE = rate constants of the different processes, respectively. It follows that:
φ φ φ T T F D T D D F D T F F F D T PE–chl PE–chl PE PE PE–chl PE PE PE PE PE–chl PE PE PE PE PE–chl a a a a a K K K K K K K K K K K K = + + = + + = + + F1 = F F ( , ) ( , ) 547 590 547 685 Qa λ ρ ρ ρ ρ ( ) = +1 2 +2 1 2 e–’ e–’ ’ – ’ a a n dt cm λ sol λ π ( ) = 6 ( )3
Fig. 3. Cryptomonas sp. (a,b) Comparison of in vivo absorption and asolat (a) 547 nm and (b) 678 nm. (c,d) Comparison of the chl a
measured by HPLC with the chl a calculated from in vivo
absorp-tion at 678 nm (c) after and (d) without correcabsorp-tion for package effect (see ‘Materials and methods’)
(7) F1 increases when KTPE– chl a, the transfer rate from PE to chl a, is reduced.
F2 is defined as the ratio of chl a fluorescence when
PE is excited to chl a fluorescence when chl a is excited
at 440 nm in the presence of DCMU:
where F(547, 685) is as previously defined, and F(440, 685) = E(440) a(440)φFchl a. After simplifica-tion, this reads as:
(8) F2 increases both with φTPE –chl a, the PE–chla
energy-transfer efficiency, and with the PE to chl a
absorption ratio, which approximates the pig-ment-quota ratio.
RESULTS Growth rate
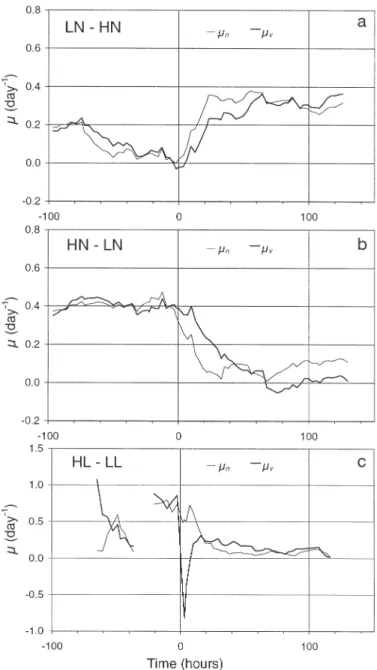
The growth ( µv) and division (µn) rates in the
LN–HN cultures declined progressively during the starvation period and increased as expected after the nitrate pulse (Fig. 4a). In HN–LN, µvand
µn were both equal to dilution rate (0.40 d–1)
before Time 0, and fell rapidly after N deprivation commenced (Fig. 4b). In each of the N-limited cul-tures, µvand µnwere very similar before N
pertur-bation, but showed divergent trends thereafter. In both cases, the division rate changed more rapidly than the growth rate, at least during the 2 days after Time 0. In the HL–LL culture, the division rate seemed first to be enhanced after the light shift-down, and then decreased significantly to approximately 0.1 d–1 (Fig. 4c). Growth rate
showed an important reduction immediately after light reduction, and became similar to the division rate after 1 d. Incorporation of NO3 was equally
significantly reduced (see Fig. 1) by the shift-down in light.
Mean cell size reacted significantly to change in growth conditions (Fig. 5). Nitrate deprivation and enrichment induced respectively an increase and a decrease in cell diameter. The light shift-down in HL–LL produced a rapid and transient reduction in cell size, showing that somatic growth was immediately inhibited by low light. Finally, light and N limitations had opposite effects on cell size.
Cell quota
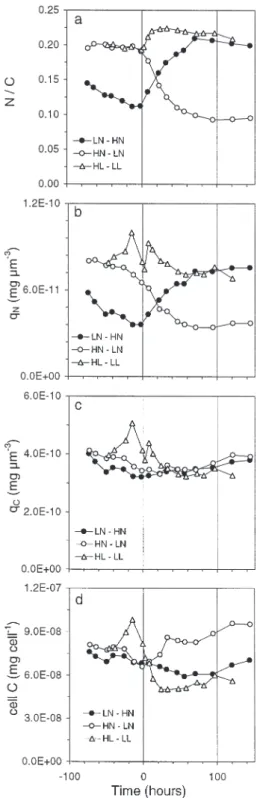
N/C variations in LN–HN and HN–LN were consis-tently opposite in all conditions of N limitation and enrichment tested (Fig. 6a). In LN–HN, the lower N/C ratio before NO3addition (Time 0) was slightly higher
than that in HN–LN at the end of the experiment. To attain a higher degree of N limitation in LN–HN, Dt
should have been set to 0 instead of 0.15 d–1 (see
Fig. 1). A non-zero dilution rate was nevertheless
F2 = TPE–chl a a a ( ) ( ) 547 440φ F2 = F F ( , ) ( , ) 547 685 440 685 F F F T chl PE PE–chl 1 = 1 φ a a K K
Fig. 4. Cryptomonas sp. Change in cell division (µn) and growth
maintained to compensate loss of culture from re-peated sampling. Before N perturbation, the difference in the N/C ratio was essentially due to the difference in
qN(Fig. 6b). In HN–LN, qNbegan to decrease before
Time 0, suggesting that N limitation occurred early, because of NO3 exhaustion in the chemostat 48 h
before Time 0 (see Fig. 1). qCremained nearly stable
and similar in both HN–LN and LN–HN (Fig. 6c), whereas, reflecting variations in cell volume (Fig. 5), carbon per cell increased and decreased in the N-deprived and N-enriched cultures respectively (Fig. 6d). Thus, when growth is N-limited, N/C, N per cell and qNshowed similar trends, since carbon per cell
and cell volume remained correlated. At Time 0, the N/C ratios were identical in HN–LN and HL–LL, whereas qN and qC were significantly higher in the
HL–LL culture, due to its exposure to higher irradi-ance. Reduction in light initially induced a transient increase in qN and qC, possibly due to the observed
drop in cell volume without concurrent loss of intracel-lular material. The increase in N/C observed after Time 0 indicates that the loss of internal C was globally greater than the loss of internal N.
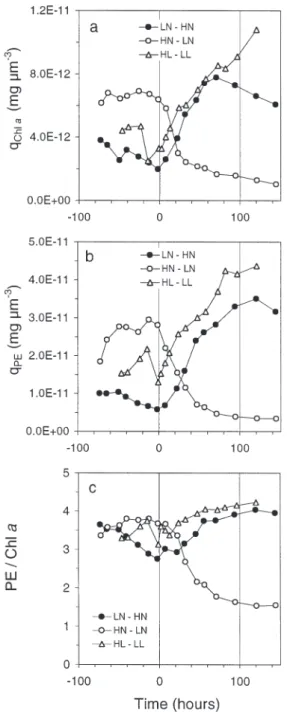
Before Time 0, the chl a quota (qchla) was governed
by the different nutrient and light conditions (Fig. 7a). For HN–LN and LN–HN, which were exposed to simi-lar PARs, qchl amirrored the N/C ratio. The intermediate
value obtained for the non N-limited culture HL–LL re-flects photoacclimation to higher PAR. After Time 0, the respective N and PAR perturbations for LN–HN and HL–LL led to similar increases in qchla, which stopped
earlier in LN–HN, as indicated by saturation of the N/C ratio. The amplitude of variation inqchlawas higher in
the light-perturbed culture (0.86 mg µm– 3) than in the N-perturbed cultures (0.65 mg µm– 3), whereas the
vari-ation in qPE (Fig. 7b) was similar in both treatments (3.0
and 3.1 mg µm– 3respectively). The PE/chl a ratio was
higher in the light-limited culture (4.2), but was not very different from that in the N-enriched chemostat (4.0). The highest variation in this ratio occurred in the
Fig. 5. Cryptomonas sp. Changes in mean cell diameter in
LN–HN, HN–LN and HL–LL cultures over time
Fig. 6. Cryptomonas sp. Change in (a) N/C ratio, (b) nitrogen
quota, qN, (c) carbon quota, qC, and (d) carbon per cell in
fully N-limited chemostat (0.37 to 0.15). As the ratio PE/chl a varied always in the same direction as qPEand
qchla, it can be inferred from Fig. 7 that N stresses
in-duced relatively more important changes in PE than in chla than light stress.
Fig. 8a,b shows how the chla and PE quota varied
with N status in the N-perturbed cultures HN–LN and LN–HN. The qchla and qPEvalues increased by factors
of 7.5 and 13, respectively, reflecting a greater mobility
of PE compared to chl a. The ratio PE/chl a was also
correlated with the N/C ratio; it ranged from 0.10 to 0.21 (Fig. 8c). In Fig. 8, where 2 variables are plotted against each other, the curves reveal different dynam-ics. In the case of N deprivation, the PE/chl a ratio
remained stable for several hours (whereas the respec-tive values of qPEand qchlachanged significantly
dur-ing the same period (Fig. 7a,b), and then decreased as a result of a higher rate of degradation for qPEthan for
qchla. The reverse was observed in the case of N
enrichment, which induced similar rates of PE and
chla synthesis on a short time-scale, and later a higher
rate of PE synthesis.
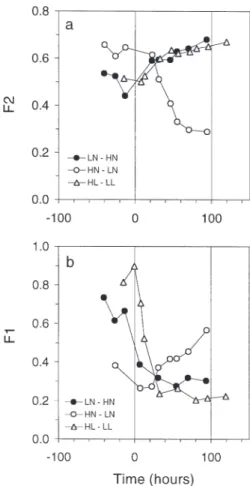
Fluorescence
Fig. 9 shows that light and N perturbations induced clear variations in the fluorescence ratios. F2 is not uniquely an indicator of energy coupling per se, since it is also dependent on the relative amounts of PE and chl a (Fig. 9a, Eq. 8). The relative variations in F2 and
PE/chl a ratios (Fig. 7c) were very similar. In contrast,
F1 depended only on PE-absorbed light, whose energy was either transmitted to chl a or re-emitted by PE
flu-orescence. The highest variation in F1 was in the light-perturbed culture (Fig. 9b), in which the correspond-ing PE/chl a varied less (Fig. 7c).
DISCUSSION
Relationships between qN, qPE, and qchl aunder
light and N stresses
PE was estimated assuming that the value deter-mined by MacColl et al. (1976) for PE in phosphate buffer is the same as that in the cell. As the solutions in which phycobiliproteins are extracted differ from the cell cytoplasm, their conformation and consequently their absorption spectrum may be modified (Glazer 1981, Rowan 1989). This could lead to an incorrect esti-mation of cell PE, with a constant error. Another source of bias is the effect of the N status on the absorption spectrum of PE. The degradation of PE probably releases free intracellular erythrobilins absorbing at different wavelengths. As their lifetime in the cyto-plasm is unknown, it is difficult to estimate how they might interfere with the remaining non-degraded PE. By using absorption at 547 nm to estimate cell PE, we have assumed that such interference can be ignored, and that the only error in estimation is in the absolute value of cell PE, arising from application of a specific absorption coefficient that can differ between cell and solution.
Fig. 7. Cryptomonas sp. Changes in (a) the chl a and (b) PE
quota, and (c) PE/chl a ratio in LN–HN, HN–LN, and
Proteins associated with both the light (pigments) and dark (carboxylase) reactions of photosynthesis are known to be degraded under N-limiting conditions. The strong correlations between the N/C ratio and the quotas of N-rich pigment complexes chl a and PE
under N-limited conditions are thus not surprising (Fig. 8). The variations in these pigment contents were
similar in N and light stresses in the growth conditions imposed of this experiment. In the case of N enrich-ment, a significant increase in qchla and qPE was
observed within the first 10 h. As this period was less than the division time, the changes in pigment con-tents clearly arose from actual synthesis. The reverse was true in the case of N deprivation, during which there was an active degradation of the light-harvesting complexes. In N-rich cells qPEwas 4-fold greater than
qchla. It remained 1.5-fold higher when cells were
N-deprived. Our data also show that the PE relative vari-ations were greater than those of chl a, both during
pigment synthesis and degradation, since the PE/chl a
ratio did not remain constant with time.
Relationship between qN, qPE, and qchl aand µv In the context of this study, it was necessary to verify to what extent growth was strictly limited by nitrogen in HN–LN and LN–HN. The concept of single nutrient
Fig. 8. Cryptomonas sp. Relationships between the N/C ratio
and (a) chl a quota qchl a, (b) PE quota qPE, and (c) PE/chl a
ratio in LN–HN and HN–LN cultures. For clarity, only mea-surements obtained just before, during, and just after tran-sient phases are plotted. Larger symbols indicate initial
conditions
Fig. 9. Cryptomonas sp. Changes in (a) F1 and (b) F2
in LN–HN, HN–LN, and HL–LL cultures over time (see ‘Results’)
limitation has been successfully formalized by the internal quota model, which hypothesizes that growth depends only on the amount of the internal limiting nutrient. Droop’s (1968) model applies correctly to growth in the steady state and when the algal popula-tion is defined as a biomass (rather than as a cell den-sity) and the internal quota as a mass per unit biomass (rather than as mass per cell) (see Droop 1979). It can be seen that during the transient phase following the N (30 h) and light (10 h) perturbations, growth rate esti-mated from cell density differed markedly from that estimated from biovolume (Fig. 4). The difference between µvand µnarises essentially from the transient
variation of the cell volume just after perturbation, and from the opposite effects of N stress on cell division and cell size. Given the nearly invariant ratio between cell carbon and cell volume (Fig. 6c), the somatic growth rate can reasonably be represented by the vari-ation in time of biovolume, µv.
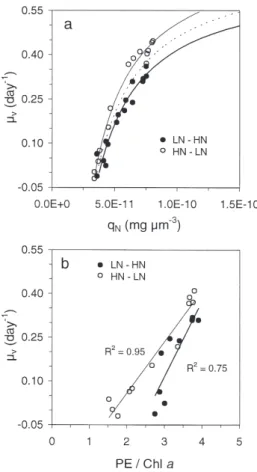
In the N-limited cultures, µv was measured before
and during the N perturbations, i.e. in non-steady conditions. Despite this, we have fitted Droop’s model to the data in Fig. 10a, from which 2 relationships emerge, one for N enrichment and one for N depriva-tion. The small but significant discrepancy between these 2 relationships shows that during the transient phase following perturbation the relationships be-tween the nitrogen quota and µv are not the same
under N enrichment and N impoverishment. This results from the delay between the external nitrogen variation and the subsequent changes in internal quota and growth rate. In the case of N supply, this delay most probably corresponds to the time necessary for assimilation processes (NO3and NO2reduction,
ami-nation, protein synthesis). The steady-state relation-ship between µvand qNshould thus lie between the 2
curves in Fig. 10a. It can be seen that for a given N quota, the predicted growth rate is under estimated in the case of N enrichment and over estimated in the case of N deprivation. Despite the discrepancy ob-served in the Droop relationships between LN–HN and HN–LN, growth was strictly N-limited in both cul-tures.
A significant relationship exists between growth rate and the PE/chl a ratio under N-limited conditions
(Fig. 10b). This is in accordance with the previously described correlation between the PE/chl a ratio and qN, and between qNand growth rate. Two distinct
rela-tionships correspond to N enrichment and deprivation conditions, reflecting the facts firstly that qPEand qchla
were not in equilibrium with growth rate, as was the case for qN(see Fig. 10a), and secondly that the
prior-ity given to the degradation and synthesis of chl a and
PE was not the same under N deprivation and enrich-ment. This can also be seen from the opposing curves
in Fig. 8c. In the case of N supply, chl a and PE were
immediately synthesized at the same rate, while later PE was preferentially synthesized to increase the nitro-gen reserve. In the case of N limitation, chl a and PE
were initially degraded at the same rate, while later PE was preferentially degraded to support the N demand. The relationships in Fig. 10b are linear instead of curvilinear, due to the fact that both chl a and PE cell
contents display curvilinear relationships with growth rate (data not shown).
Relationships between optical properties of Cryptomonas sp. and µv
Under N limitation, F1 (the presumed extent of PE–chl a coupling, Fig. 11a) was poorly correlated with
the growth rate of Cryptomonas sp., in contrast to F2 (relative PE–chl a quota and presumable intensity of
PE–chl a coupling, Fig. 11b). The weak correlation in
Fig. 11a can be interpreted by examining F1 (Eq. 7). The F1 ratio is composed of 3 terms which, under N
Fig. 10. Cryptomonas sp. Relationships between growth rate µvand (a) nitrogen quota and (b) PE/chl a ratio in LN–HN and
HN–LN cultures. Curves in (a) represent fit of Droop’s model (1968) to data
stress, may vary. The most simple and immediate pat-tern would be where only KTPE– chl a, the rate of energy transfer from PE to chl a, is influenced by N status.
Studies have nevertheless showed that PSII activity, and thus φFchl a, is affected by N deprivation (Kolber et al. 1988). Effects of KTPE– chl aand φFchl avariations are synergetic, because they are both placed as the denominator of the F1 ratio. The fluorescence rate of PE, KFPE, may also be subject to variations if free phy-coerythrin molecules appear within the chloroplast as a consequence of LHC protein degradation. In this case, a relaxation in the so-called ‘concentration quenching’ may lead to a significant increase in KFPE
(enhanced fluorescence) and, therefore, a dispropor-tionate increase in F1 relatively to the decrease in
KTPE–chl a. These combined effects, and the fact that changes in KTPE –chl a, φFchl aand KFPEmay occur at dif-ferent times as the intensity of N limitation increases can explain why the relationship between µvand F1 is
scattered.
Conversely, the strong correlation between µv and
F2 (Eq. 8 and Fig. 11b) arises from: (1) the wide range in variation of the absorption ratio a(547) /a(438) under
N-limitation, and (2) the fact that this ratio is expected to vary with energy-transfer efficiency, φTPE –chl a. As for
qNand the PE/chl a ratio, 2 relationships between µv
and F2 can be distinguished, reflecting different dynamics of N mobilization in LN–HN and HN–LN. In the case of N addition, the growth enhancement is trig-gered by a preferential synthesis of PE, whereas under N restriction, the PE pool is preferentially degraded to allow the cell to maintain an optimal growth rate.
Given the small impact of the light shift-down on the N/C ratio (Fig. 6a), light limitation on growth was not reflected by significant relationships between this ratio and F1 or F2 (data not shown). This indicates that when photoacclimation takes place, the syntheses of PE and
chl a are enhanced at rates that do not greatly modify
their initial proportions. This confirms the observation that the PE/chl a ratio was not greatly affected by the
Fig. 11. Cryptomonas sp. Relationships between growth rate, µvand (a) F1 and (b) F2 in N-limited cultures and between F1 and
light change (Fig. 7c). In contrast, the energy transfer between PE and chl a seemed to be greatly increased
under a low-light regime, so that the relations between F1 and the growth and division rates are positive (Fig. 11c,d). During light variations, energy transfer may be controlled by state transition, i.e. dissocia-tion/association of parts of PS II antenna. In this case, the F1 ratio is certainly a good indicator of energy transfer (KTPE–chl a), because (1) φFchl adoes not vary as a consequence of photoacclimation (see e.g. Falkowski et al. 1994), and (2) KFPE is not expected to vary as a function of transition state, given that, in this case, phy-coerythrin is likely to remain bounded to antenna pro-teins whether the latter are attached to the antenna or not.
The light shift-down had a drastic and transient effect on cell size (Fig. 5). During the 24 h following light stress, qCwas not stable (Fig. 6c) and µvwas not
a good estimator of somatic growth rate (Fig. 4). In Fig. 11c, the relationship between µv and F1 applies
only to the data acquired before light reduction and 24 h later.
The relationships shown in Fig. 11 were acquired in unsteady perturbed cultures and are rather noisy. They nevertheless show that N and light stresses have dif-ferent effects on the coupling between PE and chl a.
When growth is N-limited, a reduction in the amount of energy transferred from PE to chl a is achieved by
reducing the proportion of PE to chl a and, to a lesser
extent, by decreasing the PE–chl a coupling efficiency.
Under light limitation, the total amounts of chl a and
PE are markedly increased, but their relative propor-tion is less affected, so that the energy transfer be-tween them is essentially regulated through coupling efficiency. These different kinds of regulations are in agreement with the hypothesis that PE, like other accessory pigments, plays a role in N sequestration. Under N limitation, C fixation is reduced to balance the internal demand, which is subject to the N assimilation rate. Preferential degradation of PE allows the cell to reduce its photosynthetic capacity and to sustain the N demand with the catabolites arising from such degra-dation. Under non-limiting nutrient conditions, the proportion of PE to chl a is less affected by the light
regime, because there is no need for extra nitrogen to sustain optimal growth, and the energy transfer from the former to the latter is regulated through their coupling efficiency. Because of the cell’s adaptation to N or light limitation, light-dependent growth is best correlated with F1, whereas N-limited growth is best correlated with F2.
Acknowledgements. We thank Gilbert Malara for technical
help, Kadija Oubelkheir for pigment analysis, Flavienne Bruyant for fluorescence spectra acquisition, and Patrick
Chang for improving the English. We also thank the anony-mous reviewers for their comments. This research was sup-ported by funds from the PROSOPE group project (PROOF French Program), by the CNRS, and by the University of Flo-rence (Fondi di Ateneo, ex-MURST 60%).
LITERATURE CITED
Allen MM, Hutchison F (1980) Nitrogen limitation and recov-ery in the cyanobacterium Aphanacapsa 6308. Arch
Microbiol 128:1–7
Allen MM, Law A, Evans H (1990) Control of photosynthesis during nitrogen depletion and recovery in a non-nitrogen-fixing cyanobacterium. Arch Microbiol 153:428–431 Bernard O, Malara G, Sciandra A (1996) The effects of a
con-trolled fluctuating nutrient environment on continuous cultures of phytoplankton monitored by a computer. J Exp Mar Biol Ecol 197:263–278
Boussiba S, Richmond AE (1980) C-phycocyanin as a storage protein in the blue-green algae Spirulina platensis. Arch
Microbiol 125:143–147
Campbell D (1996) Complementary chromatic adaptation alters photosynthetic strategies in the cyanobacterium
Calothrix. Microbiology 142:1255–1263
Carr NG (1988) Nitrogen reserves and dynamic reservoirs in cyanobacteria. In: Rogers LJ, Gallon JR (eds) Biochemistry of the algae and cyanobacteria. Clarendon Press, Oxford, p 13–21
Collier JL, Grossman AR (1992) Chlorosis induced by nutrient deprivation in Synechococcus sp. strain PCC 7942: not all
bleaching is the same. J Bacteriol 174:4718–4726 Collier JL, Grossman AR (1994) A small polypeptide triggers
complete degradation of light-harvesting phycobilipro-teins in nutrient-deprived cyanobacteria. EMBO J 13: 1039–1047
Droop MR (1968) Vitamin B12and marine ecology. IV. The
kinetics of uptake growth and inhibition in Monochrysis lutheri. J Mar Biol Assoc UK 48:689–733
Droop MR (1979) On the definition of X and Q in the cell quota model. J Exp Mar Biol Ecol 39:203
Duke CS, Allen MM (1990) Effect of nitrogen starvation on polypeptide composition, ribulose-1, 5-bisphosphate car-boxylase/oxygenase, and thylakoid carotenoprotein con-tent of Synechocystis sp. strain PCC6308. Plant Physiol 94:
752–759
Falkowski PG, Greene R, Kolber Z (1994) Light utilization and photoinhibition of photosynthesis in marine phytoplank-ton. In: Baker NR, Bowyer JR (eds) Photoinhibition of photosynthesis: from molecular mechanisms to the field. Bios Scientific, Cambridge, p 407–432
Foulds IJ, Carr NG (1977) A proteolitic enzyme degrading phycocyanin in the cyanobacterium Anabaena cylindrica.
FEMS Lett 2:117–119
Gantt E, Edwards MR, Provasoli L (1971) chloroplast struc-tures of the Cryptophyceae. J Cell Biol 48:280–290 Glazer AN (1981) Photosynthetic accessory proteins pigment
with bilin prosthetic groups. In: Conn EE, Stumpf PK (eds) The biochemistry of plants. Academic Press, New York, p 51–96
Glibert PM, Kana TM, Olson RJ, Kirchman DL, Alberte RS (1986) Clonal comparisons of growth and photosynthetic responses to nitrogen availability in marine Synechococ-cus sp. J Exp Mar Biol Ecol 101:199–208
Grossman AR (1990) Chromatic adaptation and the events involved in phycobilisome biosynthesis. Plant Cell Envi-ron 13:651–666
Grossman AR, Schaefer MR, Chiang GG, Collier JL (1994) The responses of cyanobacteria to environmental conditions: light and nutrients. In: Bryant DA (ed) The molecular biol-ogy of cyanobacteria. Kluwer, Dordrecht, p 641–675 Kana TM, Glibert PM (1987a) Effect of irradiances up to
2000 µE m–2 s–1 on marine Synechococcus WH7803-I.
Growth, pigmentation and cell composition. Deep-Sea Res 34:479–495
Kana TM, Glibert PM (1987b) Effect of irradiances up to 2000 µE m–2 s–1 on marine Synechococcus WH7803-II.
Photosynthetic responses and mechanisms. Deep-Sea Res 34:497–516
Kana TM, Feiwel NL, Flynn LC (1992) Nitrogen starvation in marine Synechococcus strains: clonal differences in
phy-cobiliprotein breakdown and energy coupling. Mar Ecol Prog Ser 88:75–82
Kolber ZJ, Zehr JP, Falkowski PG (1988) Effect of growth irra-diance and nitrogen limitation on photosynthetic energy conversion in photosystem II. Plant Physiol 88:923–929 Lazzara L, Bricaud A, Claustre H (1996) Spectral absorption
and fluorescence excitation properties of phytoplanktonic populations at a mesotrophic and an oligotrophic site in the tropical North Atlantic (EUMELI program). Deep-Sea Res (I) 43:1215–1240
Liebig J (1840) Chemistry in its application to agriculture and physiology, 4th edn. Taylor and Walton, London
MacColl R, Berns DS, Gibbons O (1976) Characterization of cryptomonad phycoerythrin and phycocyanin. Arch Bio-chem Biophys 177:265–275
Mantoura RFC, Repeta DJ (1997) Calibration methods for HPLC. In: Mantoura RFC, Jeffrey SW, Wright SW (eds) Phytoplankton pigments in oceanography: guidelines to modern methods. UNESCO, Rome, p 407–428
Morel A, Bricaud A (1981) Theoretical results concerning light absorption in a discrete medium, and application to specific absorption of phytoplankton. Deep-Sea Res 28A: 1375–1393
Rowan KS (1989) Photosynthetic pigments of algae. Cam-bridge University Press, CamCam-bridge
Sciandra A, Gostan J, Collos Y, Descolas-Gros C, Lebou-langer C, Martin-Jézéquel V, Denis M, Lefèvre D, Copin-Montégut C, Avril B (1997) Growth compensating phe-nomena in continuous cultures of Dunaliella tertiolecta
limited simultaneously by light and nitrate. Limnol Oceanogr 42:1325–1339
Tandeau de Marsac N, Houmard J (1988) Complementary chromatic adaptation; physiological conditions and action spectra. Methods Enzymol 167:318–328
Tandeau de Marsac N, Houmard J (1993) Adaptation of cyanobacteria to environmental stimuli: new steps towards molecular mechanisms. FEMS Microbiol Rev 104:119–190 Turpin DH (1991) Effects of inorganic N availability on algal photosynthesis and carbon metabolism. J Phycol 27:14–20 Van de Hulst HC (1957) Light scattering by small particles.
Wiley, New York
Vidussi F, Claustre H, Bustillos-Guzmàn J, Cailliau C, Marty JC (1996) Rapid HPLC method for determination of phyto-plankton chemotaxinomic pigments: separation of chloro-phyll a from divinyl-chlorophyll a and zeaxanthin from
lutein. J Plankton Res 18:2377–2382
Woods NB, Haselkorn R (1980) Control of phycobiliprotein proteolysis and heterocyst differentiation in Anabaena.
J Bacteriol 141:1375–1385
Wyman M, Gregory RPF, Carr NG (1985) Novel role for phy-coerythrin in a marine cyanobacterium, Synechococcus
strain DC2. Science 230:818–820
Editorial responsibility: Otto Kinne (Editor), Oldendorf/Luhe, Germany
Submitted: August 26, 1999; Accepted: February 15, 2000 Proofs received from author(s): June 26, 2000