Evidence from Cancer Clinical Trials
The MIT Faculty has made this article openly available.
Please share
how this access benefits you. Your story matters.
Citation
Budish, Eric, Benjamin N. Roin, and Heidi Williams. “ Do Firms
Underinvest in Long-Term Research? Evidence from Cancer Clinical
Trials.” American Economic Review 105, no. 7 (July 2015): 2044–
2085. © American Economic Association
As Published
http://dx.doi.org/10.1257/aer.20131176
Publisher
American Economic Association
Version
Final published version
Citable link
http://hdl.handle.net/1721.1/97906
Terms of Use
Article is made available in accordance with the publisher's
policy and may be subject to US copyright law. Please refer to the
publisher's site for terms of use.
2044
Do Firms Underinvest in Long-Term Research?
Evidence from Cancer Clinical Trials
†By Eric Budish, Benjamin N. Roin, and Heidi Williams *
We investigate whether private research investments are distorted away from long-term projects. Our theoretical model highlights two potential sources of this distortion: short-termism and the fixed pat-ent term. Our empirical context is cancer research, where clinical
trials—and hence, project durations—are shorter for late-stage
can-cer treatments relative to early-stage treatments or cancan-cer preven-tion. Using newly constructed data, we document several sources
of evidence that together show private research investments are dis-torted away from long-term projects. The value of life-years at stake appears large. We analyze three potential policy responses: surro-gate (non-mortality) clinical-trial endpoints, targeted R&D subsi-dies, and patent design. (JEL D92, G31, I11, L65, O31, O34)
Over the last five years, eight new drugs have been approved to treat lung cancer, the leading cause of US cancer deaths.1 All eight drugs targeted patients with the
most advanced form of lung cancer, and were approved on the basis of evidence that the drugs generated incremental improvements in survival. A well-known example
1 See the lists of US Food and Drug Administration (FDA) approved hematology/oncology drugs by year: http://www.fda.gov/drugs/informationondrugs/approveddrugs/ucm279174.htm.
* Budish: Booth School of Business, University of Chicago, 5807 South Woodlawn Avenue, Chicago, IL 60637 (e-mail: eric.budish@chicagobooth.edu); Roin: Sloan School of Management, MIT, 50 Memorial Drive, E62-465, Cambridge, MA 02142 (e-mail: broin@mit.edu); Williams: Department of Economics, MIT, 77 Massachusetts Avenue, E17-222, Cambridge, MA 02139, and NBER (e-mail: heidiw@mit.edu). This paper was previously circu-lated under the title “Do Fixed Patent Terms Distort Innovation? Evidence from Cancer Clinical Trials.” We thank three anonymous referees for detailed and thoughtful comments that greatly improved the paper. We thank Meru Bhanot, David Burk, Toby Chaiken, Brian Cordonnier, Max Cytrynbaum, Greg Howard, Niels Joaquin, Megan McGrath, and Ana Medrano-Fernandez for excellent research assistance. Daron Acemoglu, Chris Adams, David Autor, Nick Bloom, Tim Bresnahan, Raj Chetty, Joe Doyle, Dan Fetter, Amy Finkelstein, Ray Fisman, Alberto Galasso, Matt Gentzkow, Wes Hartmann, Amanda Kowalski, Anup Malani, Matt Notowidigdo, Felix Oberholzer-Gee, Ariel Pakes, David Ridley, Al Roth, Jon Skinner, Alan Sorensen, Scott Stern, Glen Weyl, and seminar partic-ipants at the 2014 and 2015 ASSA meetings, BEA, Boston University Law School, Carnegie Mellon, the CBO, Chicago Booth, the Cornell Empirical Patent Law Conference, ETH-Zurich, the FTC, Georgia Tech, Harvard, Harvard Law School, LSE, MIT, NBER (Health Care, Industrial Organization, Law and Economics, Productivity, and Public Economics), the Northwestern Kellogg Healthcare Markets conference, Princeton, Stanford, Toulouse, University of Arizona, UC-Berkeley, UC-Berkeley Haas, UCSD, UCLA Anderson, UIUC, University of Michigan, University of Penn Wharton, UT-Austin, UVA, Wellesley, and Yale Law School provided very helpful comments. Research reported in this publication was supported by the National Institute on Aging and the NIH Common Fund, Office of the NIH Director, through grant U01-AG046708 to the National Bureau of Economic Research; the content is solely the responsibility of the authors and does not necessarily represent the official views of the NIH or NBER. Financial support from NIA grant T32-AG000186 to the NBER, NSF grant 1151497, the Chicago Booth Initiative on Global Markets, the NBER Innovation Policy and the Economy program, and the Petrie-Flom Center at Harvard Law School is also gratefully acknowledged.
† Go to http://dx.doi.org/10.1257/aer.20131176 to visit the article page for additional materials and author disclosure statement(s).
is Genentech’s drug Avastin, which was estimated to extend the life of late-stage lung cancer patients from 10.3 months to 12.3 months.2 In contrast, no drug has ever
been approved to prevent lung cancer, and only six drugs have ever been approved to prevent any type of cancer. While this pattern could solely reflect market demand or scientific challenges, in this paper we investigate an alternative hypothesis: private firms may invest more in late-stage cancer drugs—and too little in early-stage can-cer and cancan-cer prevention drugs—because late-stage cancan-cer drugs can be brought to market comparatively quickly, whereas drugs to treat early-stage cancer and to pre-vent cancer require a much longer time to bring to market. More broadly stated, we investigate whether private firms differentially underinvest in long-term research, by which we mean technologies with long time lags between the initial spark of an idea and the availability of a commercially viable product. We document evidence that such underinvestment is quantitatively significant in an important context—treat-ments for cancer—and analyze potential policy responses.
The idea that companies may be excessively focused on behaviors with short-run payoffs is an old one. A large policy- and practitioner-oriented literature has con-jectured that managers may maximize short-term rather than long-term firm value (Porter 1992a,b; National Academy of Engineering 1992). In the academic litera-ture, Stein (1989) and others have argued that firms may be more impatient than neo-classical models would predict due to frictions such as agency problems within the firm. While such corporate short-termism has been widely discussed, little empirical evidence exists to either support or refute this view (see Stein 2003 for a survey and Asker, Farre-Mensa, and Ljungqvist 2015 for a more recent contribution).
We propose an additional reason why private firms may be particularly likely to focus on the short term in the context of research and development (R&D): the structure of the patent system.3 Patents award innovators a fixed period of market
exclusivity (e.g., 20 years in the United States). Yet, since in many industries firms file patents at the time of discovery (“invention”) rather than first sale (“commer-cialization”), effective patent terms vary: inventions that commercialize at the time of invention receive a full patent term, whereas inventions that have a long time lag between invention and commercialization receive substantially reduced—or in extreme cases, zero—effective patent terms. This means that the patent system pro-vides, perhaps inadvertently, very little incentive for private firms to engage in long-term research.4 Our theoretical model clarifies that, in fact, there is a sense in which
2 Specifically, Avastin was approved for “unresectable, locally advanced, recurrent or metastatic non-squa-mous NSCLC [non-small cell lung cancer]” patients and the clinical trial effectiveness estimate is posted on the Genentech website: http://www.gene.com/media/product-information/avastin-lung. As noted on the website, this is the first drug to extend median survival time for this patient population beyond 1 year.
3 While the importance of patents has been debated in many industries, given our empirical focus on the phar-maceutical industry it is worth noting that a variety of evidence suggests that patents play a key role in motivating innovation in the pharmaceutical industry, including industry interviews (Mansfield, Schwartz, and Wagner 1981; Mansfield 1986; Levin et al. 1987; Cohen, Nelson, and Walsh 2000), the cost structure of new drug development relative to the generic production (DiMasi, Hansen, and Grabowski 2003; Adams and Brantner 2006; Wroblewski et al. 2009), and the fact that standard investment models used by pharmaceutical firms pay close attention to effec-tive patent length (Mayer Brown 2009). Informal interviews we conducted with venture capitalists for this paper also support this view, in the sense that these interviews highlighted the fixed term structure of the patent system as something that has important effects on research investments (see online Appendix C).
4 It has long been recognized that heterogeneity across inventions—such as variation in risk-adjusted costs of development—implies that any given fixed patent term will award “too much” market exclusivity to some inventions, and will be insufficient to motivate the development of others; on optimal patent length and optimal
corporate short-termism and fixed patent terms reinforce each other in distorting private research dollars away from long-term investments. The fixed patent term reduces the number of calendar years for which private firms enjoy monopoly pro-tection on investments, and excess discounting reduces the weight the private firm places on each of those years relative to the societal weight.
The idea that firms may underinvest in long-term research, while intuitive, is dif-ficult to test empirically. The key prediction is that there is “missing” private R&D on scientifically feasible projects that would be developed but for their long com-mercialization lags. In practice, we do not observe the comcom-mercialization lags of projects that are never developed, and “missing” private R&D is hard to distinguish from alternative explanations such as a lack of market demand or a lack of scientific opportunities.
Two features of cancer markets allow us to make progress on quantifying this missing R&D. First, the treatment of cancer patients is organized around the organ (e.g., lung) and stage (e.g., metastatic) of disease, which provides a natural catego-rization of both observed and potential R&D activity. Second, for each such group of cancer patients we observe a good predictor of how long it would take to com-mercialize drugs for those patients: survival time. Survival time predicts commer-cialization lags because a firm commercializing a new cancer drug must complete FDA-required clinical trials showing evidence that the drug is safe and effective; and, for cancer clinical trials, “effective” is usually interpreted as improving survival.5
To illustrate, consider two examples of clinical trials for prostate cancer treat-ments, both published in the New England Journal of Medicine in 2011. A first study, de Bono et al. (2011), analyzed a treatment for metastatic prostate cancer (an advanced stage of prostate cancer with a five-year survival rate on the order of 20 percent). The study tracked patient survival for a median time of 12.8 months, and estimated statistically significant improvements in survival (a gain of 3.9 months of life). A second study, Jones et al. (2011), analyzed a treatment for localized prostate cancer (an early stage of prostate cancer with a five-year survival rate on the order of 80 percent). The study tracked patient survival for a median time of 9.1 years, estimating statistically significant improvements in survival. As expected, this stark difference in patient follow-up times translates into a large difference in clinical trial length: 3 years for the metastatic patient trial versus 18 years for the local-ized patient trial. Consistent with the idea that commercialization lags differentially reduce private R&D incentives, the study of metastatic cancer patients was funded by a private firm (Cougar Biotechnology) whereas the study of localized cancer patients was funded by the National Cancer Institute.
We construct data on all clinical trials for cancer treatments over the period 1973–2011, which we match to data on patient survival times over the same period. Our survival data is drawn from patient-level cancer registry data, which we aggre-gate to cancer-stage-level patient groups. Our measure of cancer treatment R&D is newly constructed from a clinical trial registry that has cataloged cancer clinical patent breadth see, e.g., Machlup (1958); Nordhaus (1969, 1972); Scherer (1972); Kaplow (1984); Gilbert and Shapiro (1990); Klemperer (1990); and Scotchmer (1991). Relative to this literature, the patent analysis in our model highlights a simple—and, we think, important—specific form of heterogeneity in patent-provided incentives arising from commercialization lags that has potentially important consequences for welfare.
trials since the 1970s. The key feature of these R&D data which enables our analy-sis is that for each clinical trial, the registry lists each of the specific patient groups eligible to enroll in the trial—thus allowing a link between our measures of expected commercialization lag (survival time) and R&D activity (clinical trial investments) across cancer types and stages of disease.
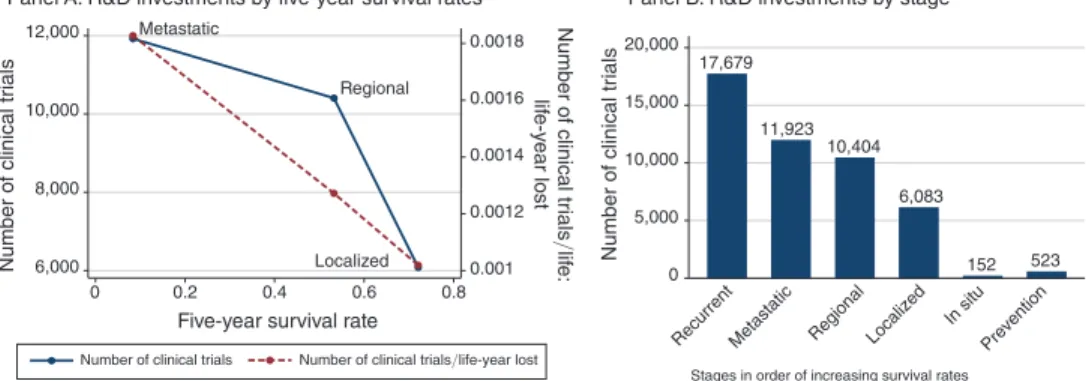
Using this data, we document that, consistent with our conjectured distortion, patient groups with longer commercialization lags (as proxied by higher survival rates) tend to have lower levels of R&D investment. Panel A of Figure 1 gives a sense of this basic pattern using stage-level data. On average, metastatic cancer patients have a five-year survival rate of approximately 10 percent, and have nearly 12,000 clinical trials in our data. In contrast, localized cancer patients have a five-year sur-vival rate of approximately 70 percent, and have just over 6,000 clinical trials in our data. This pattern is even more stark if we contrast recurrent cancers (advanced can-cers with very poor survival prospects) and cancer prevention: fewer than 500 trials in our data aim to prevent cancer, whereas recurrent cancers have more than 17,000 trials. A rough adjustment for market size—looking at the number of clinical trials per life-year lost from cancer—does little to change this basic pattern.
This new fact—a negative correlation between commercialization lags and R&D investments—is consistent with our conjectured distortion. However, by itself this fact is difficult to interpret for two reasons. First, this correlation need not reflect a causal relationship between commercialization lags and R&D investments. For example, if scientific opportunities are comparatively scarce for early-stage cancers, then a policy that shortened commercialization lags may have no effect on R&D investments. Second, even if this fact did reflect a causal effect of commercialization lags on R&D investments, on its own this fact need not be evidence of a distortion. As clarified by our theoretical model, the social planner is also more likely to pursue
Figure 1. Survival Time and R&D Investments: Stage-Level Data
Notes: This figure plots measures of clinical trial activity for each stage of cancer from 1973 to 2011. Panel A plots two measures of clinical trial activity for each stage of cancer from 1973 to 2011 against five-year survival rate among patients diagnosed with each stage between 1973–2004 (the cohorts for which five-year survival is uncen-sored). The left-hand-side axis plots the number of clinical trials enrolling patients of each stage from 1973 to 2011. The right-hand-side axis plots the number of clinical trials enrolling patients of each stage from 1973 to 2011 divided by number of life-years lost—measured as age-gender-year specific life expectancy (in the absence of can-cer) in the year of diagnosis, less observed survival time in years, averaged over patients diagnosed with that can-cer-stage between 1973–1983 (to minimize censoring) multiplied by market size. Panel B is a bar chart plotting the same data for localized, regional, and metastatic cancers, but also including the number of trials for preventive tech-nologies as well as in situ and recurrent cancers. For details on the sample, see the text and online Data Appendix.
Localized Regional Metastatic 0.001 0.0012 0.0014 0.0016 0.0018 Number of clinical tr ials /lif e: lif e-y ear lost 6,000 8,000 10,000 12,000 Number of clinical tr ials 0 0.2 0.4 0.6 0.8
Five-year survival rate
Number of clinical trials
17,679 11,923 10,404 6,083 152 523 0 5,000 10,000 15,000 20,000 Number of clinical tr ials
Recurrent Metastatic Regional Localized
In situ Prevention Stages in order of increasing survival rates
Panel A. R&D investments by five-year survival rates Panel B. R&D investments by stage
research projects that can be completed more quickly. To address these two con-cerns, we document evidence from two complementary empirical tests.
First, we document causal evidence that shortening commercialization lags increases R&D investments. The key idea behind this test is to take advantage of the fact that some types of cancers are allowed to use surrogate endpoints (that is, non-mortality based clinical trial endpoints), which break the link between patient survival rates and clinical trial length. We document that there is not a negative relationship between survival time and R&D in the sample of cancers allowed to use surrogate endpoints. This suggests that our cross-sectional fact is unlikely to be explained by factors such as the pattern of available scientific opportunities. However, this test leaves open the possibility that the social planner and private firms symmetrically respond to commercialization lags, and thus does not provide direct evidence of a distortion.
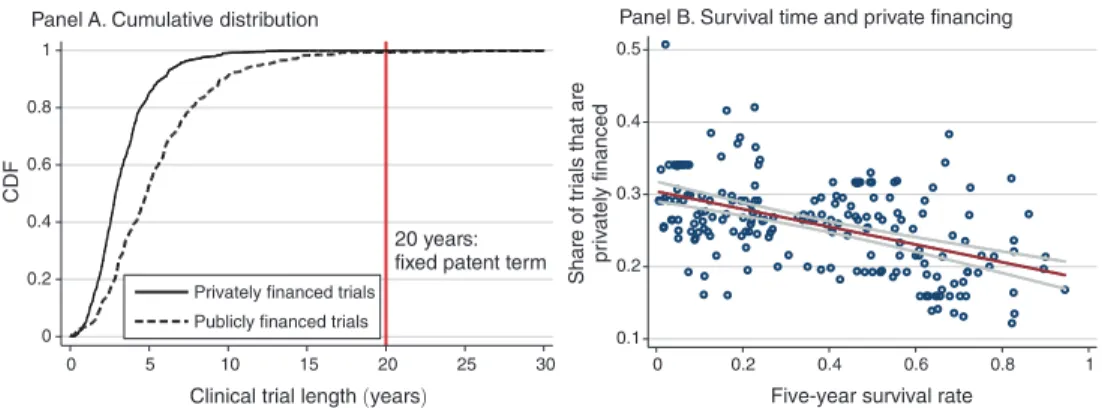
Second, we contrast public and private R&D investments. Consistent with our model, we document that commercialization lags reduce both public and private R&D investments. But also consistent with our model—and consistent with the con-jectured distortion—we document that the commercialization lag-R&D correlation is quantitatively and statistically significantly more negative for privately financed trials than for publicly financed trials.
As a complement to these empirical analyses, we also provide case study evi-dence documenting that all six FDA-approved cancer prevention technologies— technologies that should have long commercialization lags, and hence should be affected by the conjectured distortion—either relied on the use of surrogate end-points or were approved on the basis of publicly financed clinical trials. That is, with the exception of a few instances where surrogate endpoints were able to be utilized, there have been zero privately developed chemoprevention drugs. Taken together, this body of evidence provides support for the idea that commercialization lags dis-tort private R&D investments.
Our theoretical model describes two potential mechanisms for our empirical results—corporate short-termism and the patent distortion—but our results do not speak to which mechanism is quantitatively more important. The existing literature also provides little insight into the expected magnitudes of either mechanism. On one hand, the corporate finance literature has struggled to devise tests for the pres-ence of short-termism bias, in part because the key theoretical implications often focus on behaviors that by construction are undertaken by managers but unobserved by the market. Perhaps most closely related is Bernstein (forthcoming), who docu-ments that public firms pursue lower “quality” R&D than privately held firms, but he lacks a direct measure of commercialization lags. On the other hand, the innova-tion literature has provided remarkably little evidence that stronger patent protec-tion induces more R&D investments. For example, Lerner (2002) and Sakakibara and Branstetter (2001) find little evidence that stronger intellectual property rights induce more R&D.6
6 While the prior innovation literature has primarily focused on how patents affect the level of R&D, note that our model suggests a mechanism through which the structure of the patent system may also have important effects on the direction of R&D. This idea has been discussed by several legal scholars (Eisenberg 2005; Abramowicz 2007; Roin 2010), but to the best of our knowledge has not previously been formally investigated either theoreti-cally or empiritheoreti-cally.
We use our theoretical model to analyze the innovation and social welfare con-sequences of three policy levers that could address this distortion: allowing firms to rely on surrogate endpoints in clinical trials, a patent design change that would start the patent clock at commercialization, and R&D subsidies targeting projects with long commercialization lags. Two aspects of this analysis are important to high-light. First, surrogate endpoints have benefits beyond just eliminating the distortion, because the social planner also values completing projects more quickly. Second, patent reforms would address only the distortion generated by patents, and would not address the distortion generated by corporate short-termism. Given that our empirical work does not quantify the relative importance of corporate short-termism and patents, our analysis of patent reforms as a policy lever should be considered suggestive rather than conclusive.
Our empirical focus on cancer treatments is of substantive interest because of cancer’s tremendous morbidity and mortality burden. In 2009, cancer was the sec-ond leading cause of death in the United States (after heart disease), accounting for almost 25 percent of all deaths. Using an economic framework which values improvements in health based on individuals’ willingness to pay, Murphy and Topel (2006) estimate that a permanent 1 percent reduction in cancer mortality has a pres-ent value to currpres-ent and future generations of Americans of nearly $500 billion, and that a cure (if feasible) would be worth about $50 trillion. Taking advantage of our surrogate endpoint variation, we estimate counterfactual R&D allocations and induced improvements in cancer survival rates that would have been observed if commercialization lags were reduced. Based on these counterfactuals, we esti-mate that among one cohort of patients—US cancer patients diagnosed in 2003— longer commercialization lags generated around 890,000 lost life-years; valued at $100,000 per life-year lost (Cutler 2004), the estimated value of these lost life-years is on the order of $89 billion.
The paper proceeds as follows. Section I presents the model. Section II describes our data. Section III documents the negative correlation between survival time and R&D investments, and Section IV interprets this relationship. Section V derives a back-of-the-envelope estimate of the life-years lost due to longer commercialization lags. Section VI concludes.
I. Theory
We conceptualize R&D as consisting of two stages: invention and commercial-ization. By invention we mean developing the basic idea for a product to the point where it is patentable: producing a new chemical compound, building a prototype, etc. By commercialization we mean all that is involved in bringing an invented prod-uct to market: getting FDA approval for the new chemical compound, producing the prototyped good at efficient scale, etc. The commercialization lag of an R&D project is the amount of time between invention and commercialization.
Our purposefully simple model shows why private-sector R&D may be distorted away from inventions with long commercialization lags. Note importantly that both private and social R&D incentives decline with commercialization lag—all else equal, both firms and society prefer inventions to come to market quickly. But, due to either excessive discounting or the fixed patent term, private incentives will
decline more rapidly than social incentives, which is what gives rise to the distor-tion. Our model also analyzes three potential policy interventions which can be used to address this distortion.
Reflecting our empirical setting we focus the model on the pharmaceutical indus-try, though our analysis applies more broadly.
A. Preliminaries
A representative firm conducts undirected R&D which stochastically yields inventions. Whenever the firm’s undirected R&D yields an invention, it then must decide whether to invest directed R&D toward the goal of commercializing the spe-cific invention. An invention is characterized by the following parameters:
Timing Parameters.—The year in which the invention is realized by the firm’s undirected R&D is t invent , which we normalize to zero. The number of years that the commercialization effort will take is t comm , which we call commercialization lag. In the context of the pharmaceutical industry, commercialization lags arise both in research and in clinical development; to fix ideas, think of t comm as the number of years that it will take to conduct US Food and Drug Administration (FDA)-required clinical trials. We treat t comm and several other parameters below as deterministic for simplicity; in practice many of the parameters would be stochastic.
Cost of Commercialization.—If the firm elects to commercialize the invention it incurs commercialization costs of c . For simplicity, we treat commercialization costs as a one-time cost incurred at time t invent .7 Conceptually, we think of the firm as
deciding at time t invent whether to allocate capital to the project, e.g., in pharmaceu-ticals, the firm decides at time t invent whether to invest in conducting clinical trials.
Likelihood of Successful Commercialization.—The commercialization effort yields a commercially viable product with probability p . The success parameter p can be interpreted as the likelihood that FDA clinical trials are successful.
Obsolescence Risk.—If the product is successfully commercialized, then it is useful until superseded. We model obsolescence risk in a simple way, assuming that obsolescence occurs with probability 1 − γ per year in each year following t invent .8
Obsolescence risk would more appropriately be modeled as an endogenous parame-ter (for example, a function of R&D investments); for simplicity we follow much of
7 An alternative approach would be to interpret c as the net present value of costs that are incurred over t
comm
years, but this raises the issue of which discount factor to use for the purpose of computing this net present value— the neoclassical discount factor δ or the short-termism discount factor ηδ . Treating costs as incurred at time t invent
circumvents this issue, and captures the idea that clinical trials require similar financial resources whether they are funded by a private firm or the government. Our approach also abstracts from staged investment and the associated real-option considerations which, while important, are not directly related to the goals of our model: see, e.g., Gompers (1995) and Neher (1999) for analyses of staged financing.
8 An alternative would be to incorporate obsolescence that occurs before t
comm into the probability of
commer-cialization success p , and only use the term obsolescence to describe cases where the product is superseded after successful commercialization at t comm . This is economically equivalent, but less convenient mathematically; see
the previous patent theory literature in taking obsolescence risk as exogenous (e.g., Grossman and Lai 2004).9
Monopoly Profits and Social Value.—If the product is successfully commercial-ized, non-obsolete, and protected by patent, it yields profits of π per year to the invent-ing firm, and social value of v monop per year.10 If the product were priced by a social
planner instead of a monopolist, it would yield social value of v > v monop per year.
Imitability.—If the product is successfully commercialized, non-obsolete, and not protected by patent, generic entrants may imitate the commercialized product.11
Imitation reduces the inventing firm’s profits from π to (1 − ι)π , where ι ∈ [0, 1] denotes the imitability of the product (that is, vulnerability to generic competition). The case ι = 1 corresponds to perfect imitability, which drives the inventing firm’s profits to zero. We focus on ι = 1 for most of the analysis, but note that even in pharmaceuticals generic entry sometimes does not drive profits all the way to zero (see Bronnenberg et al. 2013).
Discounting and Excess Impatience.—The project’s neoclassical risk-adjusted discount rate is r . Following Stein (2003), corporate short-termism can be modeled as an excessive private-sector discount rate. For mathematical convenience we work with discount factors instead of discount rates, so corporate short-termism is reflected as a lower discount factor. Specifically, society applies the obsolescence-risk-weighted discount factor δ = γ/(1 + r) , whereas private firms apply the discount factor ηδ , with η ≤ 1 . The η term reflects excess impatience due to corporate short-termism.
Patent Term and Timing of Patent Filing.—In a fixed-term patent system, patents for new inventions last t patent years from the filing date.12 So long as an invention
is protected by patent, imitation is illegal. Firms may choose whether to file for patent protection at the time of invention t invent or at the time of commercialization
tcomm . If they file at the time of invention they receive patent protection with
prob-ability 1. If they wait until commercialization to file they receive patent protection with probability q ≤ 1 , reflecting the risk of disclosure, losing an R&D race, etc. Pharmaceutical firms face very strong incentives to file patents at the time of inven-tion (Wegner and Maebius 2001; Galli and Faller 2003; Schreiner and Doody 2006):
9 Across industries, many inventions become obsolete long before their patents expire (Schankerman and Pakes 1986). However, this is generally not the case in the pharmaceutical industry, as many drugs are still in use long after their initial FDA approval date and generate significant sales revenues near the end of their patent term (Grabowski and Kyle 2007).
10 A natural alternative assumption would be to model profits as endogenous to entry, since more competition could result in lower profits. We do not focus on this possibility here given that in our context, this would cut against our distortion: projects with short commercialization lags should have more entry, and be lower profit, which would in turn lower incentives for subsequent entry. Given that our data suggest that this dynamic is not sufficiently strong to offset our main finding—that projects with short commercialization lags have more entry—we focus on an exog-enous profit parameter for simplicity.
11 In the pharmaceutical industry, generic manufacturers are usually poised to enter the market as soon as patents expire (Grabowski and Kyle 2007; Hemphill and Sampat 2012). Such formal analyses are consistent with anecdotal evidence that industry analysts, and, e.g., the Wall Street Journal, closely track patent expirations in the pharmaceuti-cal industry, and these patent expirations tend to result in sharp changes in the profitability of branded drugs.
12 We here abstract away from the provisions of the 1984 Hatch-Waxman Act, which awards some qualifying pharmaceutical firms extended patent terms; we discuss such policy levers in Section IE.
delaying risks a competitor patenting first, or subsequent disclosures undermining the drug’s novelty or non-obviousness for purposes of patentability (Thomas 2007; Patrick 2005; Zanders 2011).13 In practice, firms almost always have possession of
the core patents over their drugs before entering clinical trials (Mossinghoff 1999; Patrick 2005; Thomas 2007).14 For this reason we focus on the case of q = 0 for
most of the analysis.
B. Effective Monopoly Life and Effective Total Life
We define an invention’s Effective Monopoly Life (EML) as the expected num-ber of years, in present value terms as discounted by the private firm, that the firm can expect to earn monopoly profits from the commercialized product. This is the expected amount of time that the invention is commercially viable, protected by patent, and not yet superseded. We focus our analysis on the case of inventions that are imitable if not protected by patent ( ι = 1 ) and where firms must file for patent protection at invention in order to receive patent protection ( q = 0 ). This is the most relevant case for the pharmaceutical industry; below we discuss other cases.
If t patent > t comm then EML can be written as
(1) EML = p
∑
t comm t patent −1(
ηδ)
t = p (ηδ) ______________ t comm − (ηδ) t patent 1 − ηδ .The key thing to notice about equation (1) is the role of the timing parameters: at best, the period of monopoly is from t comm to t patent . This best case occurs if the invention is successfully commercialized (which occurs with probability p ) and not superseded as of time t patent (obsolescence risk is incorporated into δ ). As soon as time reaches t patent , the invention will be imitated and the monopoly position lost. Note as well that if t patent ≤ t comm , then EML = 0 : by the time the invention is commercialized, patent protection has expired.
Next, we define an invention’s Effective Total Life (ETL) as the expected number of years, in present value terms as discounted by society, that the invention will be commercialized and non-obsolete,
(2) ETL = p
∑
t comm ∞ δ t = p δ _____ t comm 1 − δ .There are two differences between EML and ETL. First, monopoly life runs at best until t patent , whereas total life runs indefinitely until the invention becomes obsolete. 13 Zanders (2011, pp. 322–23), for example, argues: “A question that is often raised during my courses is ‘why don’t companies wait as long as possible before patenting?’ This is tempting, but given the fluid nature of employ-ment in the industry and the general leakiness of information, this would be tantamount to commercial suicide.”
14 Although the law is not settled, FDA clinical trials most likely constitute a public disclosure of the drug; see
SmithKline Beecham Corp. v. Apotex Corp., 365 F.3d 1306, 1318 (Fed. Cir. 2004), opinion vacated and superseded, 403 F.3d 1331 (Fed. Cir. 2005). The SmithKline decision held that a drug’s use in clinical trials puts it in the public domain, but since that opinion was vacated and the court decided the case on other grounds, the state of the law here is unclear. Once an invention is in the public domain, the inventing firm must file for patent protection within one year of public disclosure else they lose the right to patent (35 USC. 102).
Second, monopoly life is measured according to the private-sector discount factor ηδ whereas total life is measured according to the social discount factor δ .
If the invention is not perfectly imitable ( ι < 1 ) then the formula for EML would need to be modified to account for the fact that profits do not fall all the way to zero at t patent .15 In the extreme case of zero imitability ( ι = 0 ) and zero short-termism
( η = 1 ), EML and ETL coincide. If the invention has q that is not only strictly positive but sufficiently large, then the formula for EML would need to be modified to account for the fact that firms may choose to file for patent protection at t comm rather than t invent .16 In this case, the period of monopoly protection runs from t
comm
to t comm + t patent , but the firm enjoys a successful, patent-protected invention with probability of just pq rather than p .
C. Private and Social Incentives to Invest
A profit-maximizing firm attempts to commercialize an invention if and only if the expected profits exceed the costs,
(3) Private Investment Occurs ⇔ EML · π ≥ c .
In words, the firm can expect to enjoy monopoly profits of π for EML years. If
EML · π exceeds the costs of commercialization c , it is optimal to commercialize.
Suppose instead that society owned the firm. If commercialization is successful, the social planner will price at marginal cost, and hence create social welfare of v per year. Hence the social planner attempts to commercialize the invention if and only if expected social welfare, if the good is priced at marginal cost, exceeds the costs of commercialization,
(4) Investment is Socially Optimal ⇔ ETL · v ≥ c .
Notice that ETL ≥ EML and v ≥ π by definition. By construction, this ignores issues such as business stealing and R&D races which, although important, are not the focus of our analysis.17 Thus, in our framework, anytime a private firm would
choose to commercialize an invention, so too would the social planner. The projects that the private firm does not pursue, but that society would pursue if it owned the firm, are those where
(5) Private and Social Investment Differ ⇔ EML · π _______c ≤ 1 ≤ ETL · v ______c . In words, private and social investment decisions differ when the social return is positive but the private return is negative. The private market can under-provide R&D if either EML/ETL < 1 or π/v < 1 .
15 The modified formula becomes EML = p
(∑ t comm
t patent −1 (ηδ ) t + (1 − ι) ∑
t patent
∞ (ηδ ) t
) .
16 The specific condition to check to see whether firms prefer to patent at t
invent or t comm is which is larger of
p∑ t comm
t patent −1 (ηδ ) t or pq ∑
t comm
t comm + t patent −1 (ηδ ) t . Clearly, the former is larger for sufficiently small q (as is the case in
phar-maceuticals) and the latter is larger for sufficiently large q .
17 Bloom, Schankerman, and Van Reenen (2013) provide a recent analysis estimating the magnitude of business stealing.
D. Distortions in the Level and Composition of R&D
Our model yields distortions, relative to the social optimum, in both the level and composition of commercialization activity. By distortion in level, we mean simply that fewer inventions are commercialized by private firms than would be the case if the social planner made commercialization decisions. This is a standard result. By distortion in composition, we mean that the private market may choose to commer-cialize A but not B, while a social planner would prefer to commercommer-cialize B over A. That is, the private sector not only pursues too little R&D relative to the social opti-mum, but also chooses the wrong projects relative to what the social planner would choose. We state this formally as follows:18
PROPOSITION 1: The private firm’s commercialization activity differs from the
social optimum in both the level and the composition:
(i) (Distortion in levels) Commercialization activity is strictly lower than socially
optimal, unless (i) patent terms are infinite (i.e., t patent = ∞ ); (ii) firms are not excessively impatient (i.e., η = 1 ); and (iii) monopolists capture full social surplus(i.e., π = v ).
(ii) (Distortion in composition) For two inventions, A and B , it is possible that
the expected social return ( ETL · v/c ) to pursuing invention A exceeds that of invention B , yet invention A is not pursued while invention B is. For this to be the case, at least one of the following must hold:19
(a) π B / v B > π A / v A , i.e., monopolists capture more profit as a proportion of
potential social value from invention B than from invention A .
(b) EM L B /ET L B > EM L A /ET L A , i.e., the ratio of monopoly life to total
use-ful life is larger for invention B than for invention A .
As noted above, Part 1 of Proposition 1 is a standard result, which indicates that the private sector pursues too little inventive activity relative to the first best. Part 2 of Proposition 1 indicates that distortions in composition can arise from differences across inventions in either π/v or EML/ETL .
An invention’s profitability to social value ratio π/v depends on the monop-olist’s ability to capture the value its invention creates.20 One extreme case is
if the monopolist can perfectly price discriminate, in which case π/v = 1 . The other extreme case is inventions that are non-excludable, in which case π/v = 0 . An example of the latter is a study on a non-excludable form of disease
18 Proofs are presented in online Appendix A.
19 We use subscripts A and B to denote the project-specific parameters associated with these specific inventions (e.g., π A is the monopoly profits associated with successful commercialization of invention A ).
20 Past authors have estimated that on the whole, pharmaceutical firms appropriate only a small share of the social value of their innovations—generally between 2–20 percent (Philipson and Jena 2006; Lakdawalla et al. 2010; Lindgren and Jonsson 2012). Nordhaus (2004) estimates that this general conclusion holds outside of the pharmaceutical industry as well, arguing that only a minuscule fraction of the social returns from technological advances over the 1948–2001 period was captured by producers.
prevention: e.g., a profit-maximizing firm would never conduct an expensive clinical trial to test whether a particular pattern of cardiovascular exercise reduces the risk of heart disease, because knowledge that a specific pattern of exercise reduces the risk of heart disease is non-excludable.
An invention’s monopoly-life to total-life ratio, EML/ETL , describes the propor-tion of the invenpropor-tion’s total useful life in which the private firm enjoys monopoly profits. Our central point is that an invention’s EML/ETL ratio declines with com-mercialization lag t comm , due to both short-termism and the fixed patent term. To see this, write out the expression for EML/ETL assuming that t comm ≤ t patent :
(6) EML _____ ETL = p (ηδ) ____________ t comm1 − ηδ − (ηδ) t patent _____________ p ____δ t comm 1 − δ = 1 − δ _____
1 − ηδ ( η t comm − η t patent δ t patent − t comm ) .
Notice, first, that if η = 1 and t patent = ∞ (there is no short-termism and pat-ent length is infinite), then EML/ETL = 1 for all t comm . 21 Commercialization lag
reduces incentives to invest, but it reduces both private and social incentives to invest at exactly the same rate.
Notice, too, that if η = 1 and t patent = t comm + k , that is, the patent term is finite but with the patent clock modified to start at commercialization, not invention (recall that we have normalized t invent = 0 ), then EML/ETL again doesn’t vary with
tcomm . EML is strictly less than ETL under this patent design, but, just as with infinite
patents, commercialization lag reduces private and social incentives at exactly the same rate.
However, if either η < 1 or the patent term is finite and starts at invention, then
EML/ETL declines with t comm . The decline in private incentives is more rapid than
the decline in social incentives.
PROPOSITION 2: Comparative statics of an invention’s proportion of monopoly
life to total life, EML/ETL , on its commercialization lag, t comm :
(i) If there is no short-termism ( η = 1 ) and the patent term is either
infinite ( t patent = ∞ ) or is finite but the clock starts at commercialization
( t patent = t comm + k for finite k ), then the ratio of monopoly life to total life,
EML/ETL , is constant in t comm : ∂ (EML/ETL)/∂ t comm = 0 .
(ii) If firms are excessively impatient ( η < 1 ) or the patent term is finite and
starts at invention, EML/ETL is decreasing in t comm .
(a) If t comm < t patent the decline is strict: ∂ (EML/ETL)/ ∂ t comm < 0 .
(b) If t comm ≥ t patent then EML = 0 . Hence EML/ETL = 0 .
21 Recall that while our analysis focuses on the case of perfect imitability ( ι = 1 ), an economically equivalent condition to t patent = ∞ is if ι = 0 . We discuss imperfect imitability in Section IE.
This result, in combination with Proposition 1, shows that private-sector R&D is particularly distorted away from R&D projects with long commercialization lags, relative to projects with shorter commercialization lags. Moreover, there is a sense in which the effect of excess impatience on ∂ (EML/ETL)/ ∂ t comm and the effect of the fixed patent term on ∂ (EML/ETL)/ ∂ t comm reinforce each other. The fixed patent term means that increasing t comm by one year reduces the number of calendar years of monopoly life by one year. Excess discounting means that the private firm places too little weight on each of these years of monopoly life relative to their societal value. To see this decomposition formally, define an invention’s effective patent life as EPL = p
∑
t t commpatent −1δ t = p(δ t comm − δ t patent )/(1 − δ) ; EPL is EML but using the
social discount factor δ . We can decompose EML/ETL into an excessive discount-ing term and a fixed patent term as
(7) EML _____
ETL = EML _____EPL
⏟ excess discounting · EPL ____ ETL ⏟ fixed patents .
It is easy to see that both terms in this decomposition are strictly declining with commercialization lag:
PROPOSITION 3: Decomposition of ∂ (EML/ETL)/ ∂ t comm into the effect of excess
discounting and the effect of the fixed patent term:
(i) If there is excess discounting, η < 1 , then ∂ (EML/EPL)/ ∂ t comm < 0 for
tcomm < t patent .
(ii) If there is a fixed patent term—a finite patent clock that starts at invention—
then ∂ (EPL/ETL)/ ∂ t comm < 0 for t comm < t patent .
Two hypothetical examples can illustrate this distortion in the composition of R&D. A vaccine administered to men at age 20 which prevented prostate cancer (which tends to affect men in their fifties or later) would have a high social value v (given the high morbidity and mortality burden of prostate cancer), but would have a low (or zero) EML/ETL ratio because of the long required clinical trials. In con-trast, a drug administered to late-stage prostate cancer patients which extended life from, say, six months to eight months, would have a lower social value v , but a high
EML/ETL ratio because of the short required clinical trials. Note that in the case of
these examples, our distortion of interest—generated by the difference in EML/ETL ratios—would be reinforced by differences in π/v .
E. Policy Responses
Our empirical work will provide support for the idea that private-sector R&D activity is distorted away from projects with long commercialization lags. Given that evidence, in this subsection we discuss the innovation and social welfare con-sequences of three policy interventions that could be used to address this distortion: a policy change that would allow firms to rely on surrogate (non-mortality) end-points in clinical trials; a patent design change that would start the patent clock at
commercialization; and targeted R&D subsidies. Some readers may prefer to skip this section on a first reading, returning to our analysis of policy responses after reading the empirical analysis.
Policy Lever: Surrogate Endpoints.—A major factor determining the duration of a clinical trial is the amount of time needed to observe statistically significant dif-ferences in treatment outcomes among enrolled patients, known as the “follow-up period.” The length of the follow-up period largely depends on two factors: the nat-ural progression of the disease, and the clinical trial endpoints required by govern-ment regulators.
Prior to marketing a new drug, firms must submit clinical trial results to the US Food and Drug Administration (FDA) documenting that their product meets a set of safety and efficacy standards. Over time, the FDA’s interpretation of which clinical trial endpoints can be used to support claims that a drug is effective have varied (see, e.g., Johnson, Williams, and Pazdur 2003). Conventionally, clinical trials evaluate whether a candidate product provides a clinical benefit to mortality—be it overall survival or a closely related measure such as “disease free survival,” which measures time until cancer recurrence. However, in recent years there has been increased interest in using surrogate endpoints as a substitute for the standard clinical end-points in a drug trial. In the case of hypertension, for example, lower blood pres-sure is accepted as a surrogate for the clinical endpoint of preventing cardiovascular complications (Lee et al. 2006). As we discuss in Section IVA, blood cell counts and related measures have been accepted surrogate endpoints for hematologic malignan-cies (leukemias and lymphomas).
Surrogate endpoints have the potential to dramatically reduce the length of clini-cal trials necessary to test whether a drug is effective. However, surrogate endpoints have also been extremely controversial. As described by Fleming (2005), although treatment effects on surrogate endpoints clearly establish some form of biological activity, changes in surrogate endpoints may not correlate with changes in the clini-cal endpoint of interest. As an example, he discusses prostate specific antigen (PSA) levels: although PSA levels are correlated with the extent of prostate cancer, the PSA level itself is not a mechanism through which prostate cancer progresses, and thus it is unknown whether a treatment that reduced PSA levels in prostate cancer patients would generate improvements in survival.22 Reflecting this type of concern,
most cancers use surrogate endpoints only on a limited, somewhat ad hoc basis.23
22 A non-cancer example of the controversy around surrogate endpoints arose recently in the context of treat-ments for early-stage Alzheimer’s disease. In a 2013 editorial in the New England Journal of Medicine, two FDA officials discussed the possibility of accepting new types of surrogate endpoints in clinical trials of treatments for early-stage Alzheimer’s disease (Kozauer and Katz 2013)—a proposal that was sharply criticized by the editorial board of the New York Times (“Drugs for Early-Stage Alzheimer’s,” March 18, 2013), among others.
23 As discussed by US Food and Drug Administration (2007) and Johnson, Williams, and Pazdur (2003), since 1992 the FDA’s accelerated approval regulations have allowed for the following: for diseases that are serious or life-threatening, a drug can be FDA approved based on a surrogate endpoint that is reasonably likely to predict clinical benefit but is not established at a level that would support regular approval, under the condition that the applicant is required to perform a post-marketing study to demonstrate that treatment with the drug is indeed sup-ported with clinical benefit. If the subsequent trials fail to demonstrate clinical benefit, or if the applicant does not conduct the required studies, the FDA can act quickly to remove the drug from the market. A recent President’s Council of Advisors on Science and Technology (2012) report argued that the FDA should expand this accelerated approval program.
In the context of our model, surrogate endpoints can be conceptualized as strictly reducing commercialization lag t comm : firms can always choose to use survival as an endpoint, and we assume that the surrogate endpoint can be observed strictly earlier than the survival outcome. For simplicity, we analyze the effect of an “ideal” surrogate endpoint—one that perfectly correlates with the true clinical outcome of interest. This assumption allows us to make the following simple point.
PROPOSITION 4: Allowing surrogate endpoints:
(i) Strictly increases commercialization activity: some inventions that would not
otherwise have been commercialized now are, and all inventions that would be commercialized even without surrogate endpoints still are.
(ii) Strictly increases firm profits and social welfare.
(iii) Let t ̂ comm denote commercialization lag, in the absence of a surrogate
end-point, based on the time required to show an effect on patient mortality. Let tcomm < t ̂ comm denote the commercialization lag if surrogate endpoints are allowed. If t comm is independent of t ̂ comm , that is, if the time required to show impacts on the surrogate endpoint is independent of the time required to show impacts on mortality, then allowing surrogate endpoints eliminates the distortion in composition associated with commercialization lag absent the surrogate endpoint: ∂E ( EML____ETL | t ̂ comm = x ) /∂x = 0 .
Clearly this proposition is based on a strong assumption of the existence of an ideal surrogate endpoint. Our objective here is simply to show that there would be social welfare benefits from the scientific discovery, validation, and allowance of valid surrogate endpoints.24 Note that surrogate endpoints are valuable both
because they eliminate the distortion in composition of R&D and because, even in the absence of a distortion, it is socially valuable to complete R&D projects sooner.
Patent Design.—In this section we discuss modifications to the fixed term patent design that address the distortion away from long-term R&D projects. Note, impor-tantly, that the patent design policy response differs from our other policy responses in that it addresses only the fixed patent term as a source of distortion, and not exces-sive discounting. As we will discuss below, if patents are unimportant for motivating R&D (formally, imitability ι is zero), the patent design policy response will not be effective at addressing the distortion of interest, but in our simple framework this policy reform would also not be harmful.25
24 The use of invalid surrogate endpoints could increase R&D investments but not generate any corresponding gains in survival. In the specific empirical context we analyze in Section IVA, we will document evidence that sur-rogate endpoints for hematologic cancers appear to have increased R&D investments, and that this increase in R&D investments appears to have translated into real improvements in patient health.
25 Our model focuses on a Nordhaus (1969)-style trade-off between the incentives for developing a new innova-tion and the deadweight loss of higher prices during the life of the patent. By construcinnova-tion, this type of framework abstracts away from other ways in which patent reforms could impact social welfare, including business stealing, the effects of patents on follow-on innovation, litigation, or the benefits of the disclosure function of the patent system.
We begin with a simple result, analogous to part (i) of Proposition 2, that shows that starting the patent clock at commercialization, rather than invention, eliminates the distortion in composition arising from the patent system.
PROPOSITION 5: If the patent clock starts at commercialization, i.e., t patent = t comm + x for fixed and finite x , then EPL/ETL is independent of
commercializa-tion lag, t comm .
If we make some admittedly stylized assumptions on the distribution of invention possibilities, we can make a stronger claim, which is that starting the patent clock at commercialization strictly increases social welfare. In fact, the result says we should go further: social welfare is maximized by awarding more post-commercialization patent life to inventions with longer commercialization lag than inventions with shorter commercialization lag, in contrast to the current system which awards inven-tions with longer commercialization lag less post-commercialization patent life than inventions with shorter lag.
PROPOSITION 6: Make the following assumptions about the distribution of
inven-tion parameters: δ < 1 and η ≤ 1 are constant across inventions, so that EML varies only with commercialization lag t comm , patent life t patent , and success prob-ability p ; the social-to-private value ratios v/π and v monop /π are constant across
inventions; the density of inventions on the extensive margin, i.e., the expected
num-ber of new inventions elicited by a marginal increase in t patent , is uniform; and, the expectation of costs, c , conditional on an invention being at the margin, is weakly
increasing in t comm . Suppose that private firms make commercialization decisions according to equation (3). Suppose that the length of the patent award can be con-ditioned on t comm but not on the other invention parameters. Then socially optimal patent policy requires that the number of years of post-commercialization patent protection increases monotonically with t comm , whereas under the fixed-term patent system the number of years of post-commercialization patent protection decreases monotonically with t comm .
The intuition for this result, which was conjectured informally in Roin (2010), is as follows. Fix a level of t comm , and consider an increase in post-commercialization patent life for inventions with this commercialization lag. This increase in patent protection has benefits and costs. The benefit is that more inventions with com-mercialization lag t comm will be commercialized at the margin; technically, we have increased EML and hence made it more likely that equation (3) obtains. The cost is that, for inframarginal inventions that would have been pursued absent the increase in patent protection, there is more deadweight loss, for the standard reason that social value under monopoly is smaller than social value under perfect competition from generic entrants. The proof makes two key observations. First, the deadweight loss costs on the intensive margin are strictly decreasing with t comm , both because the costs are pushed out further into the future and because the set of invention parameters for which private firms choose to commercialize is shrinking. Second, the benefits at the extensive margin are actually increasing with t comm : for a private firm to be willing to commercialize an invention with higher t comm , the invention
must be higher quality in the sense of higher private value π —especially if the firm is excessively impatient—which in turn implies higher social value v monop and v .26
Intuitively, when t comm is large, the inventions at the margin are especially worth encouraging, and the cost of doing so is comparatively low. Hence, the larger is
tcomm , the larger should be post-commercialization patent life.
We wish to make four further remarks concerning this result. First, conditioning the length of patent award on t comm should be feasible in practice, at least in the case of pharmaceuticals, since completion of FDA trials is intrinsically an observable event. Second, while we acknowledge that our assumption of constant social-to-private value ratios v monop /π and v/π is stylized, we note that the types of inventions that
take longer to reach the market (e.g., treatments of early-stage disease and disease prevention) seem likely to have especially high such ratios. If these ratios increase with t comm , then this increases the rate at which benefits at the extensive margin increase with t comm , strengthening the result. Third, the 1984 Hatch-Waxman Act27
contains a provision granting some qualifying firms a partial extension of patent life based on the time that the drug spent in clinical trials. Specifically, the act awards qualifying firms an additional half-year of patent life for every year spent in clinical trials, up to a maximum of 5 years not exceeding 14 total years. Our result says that the Hatch-Waxman extension is directionally correct, but that optimal policy would go further. Finally, we are here abstracting away from strategic responses that could be “unintended consequences” from such a change in patent policy.28 In practice,
awarding FDA-granted exclusivity periods that run from the date of FDA approval would likely accomplish the same goal, be administratively simpler to implement, and avoid unintended problems that could arise with revising the patent system.29
Our next result considers a more limited set of patent-design instruments than is allowed for by Proposition 6 and shows that there is still scope for improvement. PROPOSITION 7: Suppose that the length of the patent term must be fixed, but that
the patent clock can start either at invention or commercialization. Make the same assumptions regarding the distribution of invention parameters as in Proposition 6.
Given any patent term that runs from the date of invention, there exists a patent term
that runs from the date of commercialization that strictly increases social welfare. In particular, the optimal patent term that runs from the date of commercialization
is superior to the optimal patent term running from the date of invention.
26 It is not necessary for the result that benefits at the extensive margin are weakly increasing with t
comm , only
that they do not decrease too quickly (i.e., faster than do the deadweight loss costs on the intensive margin). For this reason, several of the assumptions in the proposition can be slightly relaxed. We have a numerical example, in which the density of the extensive margin is bimodal with a large decline between the two modes, which illustrates that the conclusion of the proposition is false if the density falls off too quickly. Intuitively, in the region in which the density on the extensive margins is very low, it is not sufficiently socially valuable to elicit inventions on the extensive margin to justify the deadweight loss costs for inventions on the intensive margin.
27 Public Law 98-417 (1984)
28 More generally, we here restrict our attention to policy mechanisms that work within the existing patent system. More sophisticated policy mechanisms—for instance, in conjunction with the ideas in Kremer (1998) and Weyl and Tirole (2012)—could also be used.
29 FDA exclusivity periods are currently granted to new drug applications (three years for new indications; five years for new molecular entities); to orphan drugs (seven years); and to pediatric approvals (six months).
Proposition 7 is useful for informing patent policy if it is possible to start the patent clock at commercialization, but difficult to condition the length of the patent award on the precise amount of time between invention and commercialization. As with the optimal policy considered above in Proposition 6, this more circum-scribed policy proposal could be implemented via FDA-granted exclusivity periods as opposed to a restructuring of the patent system. A recent policy in the spirit of this result is a provision of the 2010 Patient Protection and Affordable Care Act,30 which
grants some qualifying drugs (specifically, biologic drugs) a 12-year exclusivity period running from the date of FDA approval, which runs concurrently with any remaining patent terms. Proposition 7 supports extending this type of post-approval exclusivity period to all drug approvals (but note that our analysis does not specify the optimal length of such an exclusivity period).
A caveat to the results in this section is that they presume that patents are an important way to incentivize research and development activity.31 If patents do not
increase research investments, the policy responses analyzed in this section would be ineffective. Formally, consider an industry in which imitability ι = 0 , so patents are not necessary to protect monopoly profits from projects. In such an industry, the modifications to patent design outlined in Propositions 5–7 will have no effect on R&D activity, although it is worth noting that in our simple framework these pol-icy responses would not be harmful, only ineffective. By contrast, our other polpol-icy responses would be effective in such an industry provided that corporate short-ter-mism is relevant ( η < 1 ).
Policy Lever: Targeted R&D Subsidies.—The logic that targeted R&D subsidies can improve social welfare is simple and standard. Take a particular invention that is not pursued by the private sector, but that would be pursued in the first-best world, i.e.,
(8) EML · π < c < ETL · v .
Suppose that the deadweight loss of taxation is τ per dollar spent. Then, so long as the magnitude of the potential social gain is large enough relative to the magni-tude of the private loss—that is, the magnimagni-tude of the first inequality in (8) is small relative to the magnitude of the second inequality in (8)—there is a potential for welfare-increasing intervention.
Recall that we defined an invention’s effective patent life as EPL = p
∑
t t commpatent −1δ t ,
i.e., EPL is just like EML except that it uses the social discount factor δ rather than the private discount factor ηδ . The condition for the existence of a socially beneficial R&D subsidy is:
(9) EML · π < c and c + τ (c − EML · π) < EPL · v monop + (ETL − EPL) · v.
In words, the conditions are that, first, the private firm would not commercialize on its own, and, second, that the social value from commercialization exceeds the
30 Public Law 111-148 (2010).
31 As discussed in footnote 3, while patents have been controversial in many industries, a variety of sources of evidence suggest that patents are likely to be important in the pharmaceutical industry.