R esear ch Ar ticle Building Ther m a l, Ligh ting , and A coustics M o d eling E-mail: [email protected]
Heat and moisture balance simulation of a building with vapor-open
envelope system for subtropical regions
Yutaka Goto1,2 (), Karim Ghazi Wakili2, Thomas Frank2, Thomas Stahl2, York Ostermeyer1, Naoto Ando3, Holger Wallbaum1
1. Swiss Federal Institute of Technology Zurich, Wolfgang-Pauli Strasse 15, CH-8093 Zurich, Switzerland
2. Empa, Swiss Federal Laboratories for Materials Science and Technology, CH-8600 Duebendorf, Switzerland 3. The University of Tokyo, Tokyo 113-8657, Japan
Abstract
Global warming and the resource depletion induced discussions on sustainable developments within the construction sector. Also the rapid urbanization in subtropical regions is becoming one of the most important global issues. Appropriate measures must be taken in such developments to avoid further damage to the environment. In this study, the heat and moisture balance simulation of building with a sustainable building envelope system for subtropical climate was proposed. In the moisture balance simulation the moisture buffering by the interior materials was taken into account. The prediction of moisture buffer value (MBV) of the interior finishing materials was attempted and validated by measurements. Subsequently, the whole building calculation was carried out and the contribution of the moisture buffering to the indoor comfort and energy consumption was investigated. The MBVs of the mineral-based materials were predicted with high accuracy. However, that of wood-based composite was much higher than the experimental value. In order to create a more accurate model, nonlinear moisture conductance should be accounted when modeling wood-based materials. The heating and cooling demand of a test house was 9.4 kWh/m2 and 14.5 kWh/m2, respectively. It was concluded that the utilization of the
building envelope system has a high potential to provide sustainable houses in subtropical regions. In order to enhance both energy efficiency and indoor comfort of buildings in subtropical regions, there still is a strong need to develop a holistic method to find the optimum building design considering not only moisture buffering but also all the relevant factors. The presented model will be validated by in-situ measurements in the near future.
Keywords sustainability, vapor-open envelope, heat and moisture balance, subtropical climate, moisture buffering Article History Received: 13 February 2012 Revised: 4 April 2012 Accepted: 2 May 2012
© Tsinghua University Press and Springer-Verlag Berlin Heidelberg 2012
1 Introduction
Global warming and the resource depletion induced the discussions on sustainable developments. It is often said that sustainability comprises three pillars, namely ecological, economic, and social sustainability. It has been agreed that the load of the human activities to the environment must be minimized. However, the other two aspects of the sustainability are somehow intricate to assess their real benefit to the society. Nevertheless, it is certainly needed to provide solutions in any field so that substantial measures of so-called strong sustainability can be implemented for the realization of sustainable society. Among all the sectors,
construction industry is one of the most important fields since it is contributing by 50% to the greenhouse gasses emission related to the global warming and by 40% to the resource consumption on the global scale (UNEP 2003). Furthermore, many of the human activities take place in the built environments indoors. This means that the comfort and health issues, which needless to say are keys for social sustainability, are also greatly related to the quality of the buildings. Therefore buildings are no doubt one of the most important factors regarding all the aspects of sustainability.
When having an overview of the sustainable construction on global scale, there have been certain developments in terms of ecological issue in countries which have rather
mild/cold climatic conditions. The important technical issues such as interstitial condensation problem and the heat balance of buildings have already been investigated, and sophisticated technologies have been implemented in the industry (for example Peper and Feist 2001). At the same time, the rapid urbanization in developing countries is becoming one of the most important global issues (CIB & UNEP-IETC 2002). In order to decelerate the corresponding environmental load, appropriate measures must be taken in such developments immediately. Transferring the existing technologies from the countries with cold climatic conditions to those areas might be one of the solutions. However, there are always certain difficulties because every region has its own geographical, social and cultural background. In this sense, the adaption of the building designs to the local design conditions is of great importance. Especially when considering technology transfer from rather cold to rather warm regions, this climatic difference must be considered thoroughly. The difference of climatic condition has significant influence on the design of the building envelope and the housing services as the method to acquire the better energy efficiency and the better indoor comfort may be significantly different. In the worst case, the inappropriate building design results in damages to the building and to the health of the inhabitants (Jarvis and Morey 2001). Kishi et al. (2009) reported the health problem of residents in Japan due to the dampness in buildings, which is supposedly due to the lack of appropriate measures in the construction design.
Vapor-open building envelope system for subtropical regions has been presented and tested in the laboratory by the authors (Goto et al. 2011). This envelope system mainly consists of 3 layers with natural materials, namely, the external insulation layer with wood fiber board, the structural layer with cross laminated wooden panel and the interior finishing layer with clay board. The basic design philosophy of this system is that the envelope consists of hygroscopic materials with moderate vapor permeability. This system allows the moisture flux to move through the wall in both directions. By defining the appropriate thickness to each layer, it is possible to avoid moisture related problems inside the wall.
It has been shown that it is possible to predict the heat and moisture transfer across the wall with given exterior and interior boundary conditions by means of a commercial simulation tool for transient heat and moisture transfer. However, there remained a fundamental problem with the setting of the model. The rigid boundary conditions on both external and internal side are unaffected by the heat and moisture release or uptake of the wall. For the external side, this is negligible because the exterior climate is not assumingly affected by such a phenomenon. While, it is of
major concern for the internal side especially regarding the comfort issue. As for the heat exchange between them, it is assumed that there is not a big contribution of the interior finish to the air by heat conduction. However, the moisture exchange between them by adsorption and desorption must have a certain impact. In fact, there have been numbers of studies on the integration of moisture buffering into the building design process regarding acquiring more stable room climate and energy efficiency (for example (Padfield and Larsen 2004) and (Rode and Grau 2008)). Chan and Chow (1998) found that there is a big energy saving potential of the energy consumption for heating and cooling by implementing better quality building envelope under subtropical regions and Osanyintola and Simonson (2006) pointed out that it is further improved especially by enhancing the moisture buffering by room interior. In order to acquire more comfortable conditions as well as less moisture related problems in the hot and humid condition, controlling the indoor relative humidity within moderate range is one of the most important measures. While studies have been attempted in the conditions of cold regions (for example, Tariku et al. 2011) and, there is a strong need to integrate the moisture transfer simulation across the building envelope and the prediction of room temperature and humidity into one heat and moisture balance simulation of the whole building which considers the subtropical climatic conditions.
In this study, the heat and moisture balance simulation of an entire built environment applied to the envelope system was proposed. Within this simulation, the moisture buffering phenomenon by the interior materials were integrated into the moisture balance simulation using moisture buffer value (MBV) proposed in (Rode et al. 2005). At the same time, the prediction of MBV of interior finishing materials was attempted using transient heat and moisture transfer model. This model was validated by the actual moisture buffering test of those materials. In the end, the whole building calculation was carried out and the contribution of the moisture buffering to the indoor comfort and energy consumption was investigated using the climatic condition of Hikone(Japan), which has a typical subtropical climatic condition, as a reference case.
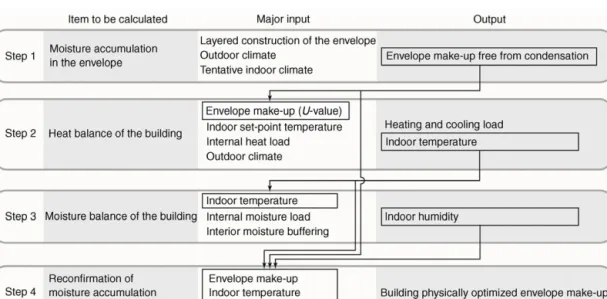
2 The whole building simulation model 2.1 The overall structure of the simulation
The purpose of creating the whole building simulation model is to predict indoor air temperature and humidity. By acquiring those values, it becomes possible to assess the energy consumption, indoor comfort and the risk of condensation of the building. The simulation consists of
four steps. Step 1 is the transient heat and moisture transfer simulation across the wall. In this step, the optimum layer construction, which does not have a permanent moisture accumulation in the wall, is identified by applying the actual weather data on the exterior side and a given room condition on the interior side. This method is described in (Goto et al. 2011) in detail. In Step 2, the dynamic heat balance simulation is carried out. The input for this simulation is the wall make-up which is identified in Step 1 and the parameters which have major impact on the heat transfer in the building such as the set-point temperature and ventilation rate as well as the outdoor climate. The time- dependent room temperature is calculated and this is used in Step 3, which is the simulation of moisture balance. In this dynamic moisture balance simulation, the time-dependent relative humidity of the room is predicted by introducing the moisture flow due to air exchange between the exterior and interior, internal moisture load and the moisture buffering by the interior materials. In Step 4, the predicted indoor temperature and humidity is finally used as the boundary condition of the transient simulation across the wall, which is done once with the tentative boundary indoor condition in Step 1. Once it is confirmed that there is no interstitial condensation with the predicted room condition, the optimization of the wall make-up and therefore the heat and moisture balance simulation is completed. The whole structure of the simulation is illustrated in Fig. 1.
2.2 Heat balance simulation
The heat balance simulation of the whole building is carried out using the simulation program Helios which was developed by EMPA (Frank and Carl 2006). Helios is able to perform
dynamic energy simulations on hourly basis in accordance with the ISO standard “Energy performance of buildings— Calculation of energy use for space heating and cooling” (ISO 13790 2007). For the energy calculation, a one zone building model is used. The major parameters considered in the calculation are: exterior temperature, exterior humidity, solar radiation, shading around the openings, ventilation rate, heat exchange by the mechanical ventilation, air infiltration, set-point indoor temperature, indoor heat load and indoor heat buffering by the building elements as thermal mass.
The thermal property of the envelope is defined according to the actual layer design of the building by characterizing the layers with its thermal properties such as thermal conductivity and specific heat capacity. The exterior climatic condition can be imported from external data base. The openings are modeled simply based on the area of each opening, their U-value and g-value (the ratio of the sunshine transmitting through glazing). The shading of each opening are modeled based on its simplified geometry. Regarding the consideration of the user behavior, the heating and cooling set-point temperature, which may differ from one inhabitant to another, needs to be defined. As for the interaction between the solar gain and human behavior, it can be modeled that movable shading is activated when the room temperature is at a certain degree or higher. The daily schedule of the internal heat gain due to the human activities and the appliances can also be defined on hourly base.
2.3 Moisture balance simulation
When discussing the moisture balance of buildings, it is necessary to differentiate two major sources of moisture. One source is the exterior air. When the exterior air enters the
house as the result of ventilation or infiltration, the moisture contained in the air also comes in. The other moisture source is the internal moisture load due to activities of the humans in the building such as cooking, bathing and so on. It is very important to note that this moisture generation creates humidity peaks in the buildings. A humidity peak directly affects the people’s comfort and creates the peak load of the equipment for dehumidifying which actually requires an adequate design of housing services and often results in higher energy consumption. When the interior of the room is designed using hygroscopic material such as wood and clay, this humidity peak could be reduced by the sorption effect of those materials, the so-called moisture buffering effect.
In order to include moisture buffering in the moisture balance simulation of a building, it is necessary to introduce a factor representing the buffering function. There are several methods to define the characteristics of moisture buffering such as the JIS standard “Test method of adsorption/desorption efficiency for building materials to regulate an indoor humidity” (JIS A 1470-1 2002) and the ISO standard “Hygrothermal performance of building materials and products” (ISO/DIS 24353 2006). In the NORDTEST project (Rode et al. 2005), one simplified method to determine the moisture buffering property moisture buffer value (hereafter called MBV) of building materials was proposed. In the present study, MBV was chosen for expressing the moisture buffering performance of interior materials. The advantage MBV is that all materials can be compared on the same basis. Since the testing method was designed assuming the ordinary conditions of built environment within the NORDTEST protocol, the comparison of materials can be directly used when designing the interior and choosing the materials.
By using the room temperature which is calculated in the heat balance simulation, the indoor humidity is cal- culated by means of a simplified moisture balance equation (Zürcher and Frank 2010) (Eq. (1)) which includes the factors of ventilation, internal moisture load and moisture buffering by the interior materials.
i R sor v i e int d ( ) ( ) d c V V q c c G t + ⋅ = ⋅ - + (1) Where VR (m3) is the volume of the room, Vsor (m3) is the
equivalent volume of air representing the sorption capacity of the interior surfaces, ci (g/m3) is the absolute humidity of
the room, qv (m3/h) is the exchanged airflow rate, ce (g/m3)
is the absolute humidity of the supply air, Gint (g/h) is the
internal moisture load. Vsor is calculated by Eq. (2).
sor i,sat MBV 100%RH k k A V c ⋅ ⋅ =
å
(2)Where A (m2) is the area of the sorption-active interior
surface area, MBV (g/(m2·%RH)) is the moisture buffer value
which was defined in the NORDTEST project (Rode et al. 2005) and ci,sat (g/m3) is the absolute humidity of the room
air by volume at saturation. By solving Eq. (1), the absolute humidity of the room air ci can be given as a function of
time as shown by Eq. (3). L sor R 1 / int i e v ( ) 1 e n t V V G c t c q - ⋅ + = + ⋅ -
(
)
(3) where nL (1/h) is the ventilation rate.3 Prediction of moisture buffering property 3.1 Moisture buffering value
Building materials are always exposed to the ambient air whose moisture content is continuously changing. The hygroscopic materials react to the change of relative humidity by adsorbing or desorbing the moisture in the air. The adsorption/desorption results in the weight change of the materials. This weight change is the index for evaluating the moisture buffering performance. In the definition of MBV, the weight change is divided by the sorption active surface area of the material and by the gradient of the relative humidity. Therefore MBV is expressed in the unit of g/(m2·%RH). As mentioned above, the advantage of MBV
is the universal use of this property within the construction industry. On the other hand, it is necessary to carry out the measurements for acquiring the value. The testing setup is rather demanding due to the special equipment which keeps the temperature and the humidity of a certain amount of air constant. For the time being, the number of materials whose MBVs have been published is limited. For practitioners who do not have the easy access to MBV equipment, this is a major lack of information. Therefore it is meaningful to establish a method to estimate the MBV with the aid of widely used simulation tools. This is expected to contribute to the building industry to save time and money to carefully investigate the moisture buffering influence on the built environment and energy consumption.
3.2 Moisture transfer mechanism
When discussing the property of weight change due to sorption, it is necessary to model the moisture transfer mechanism between the ambient air and the materials. In normal building materials under normal conditions, it is necessary to consider three moisture transfer mechanisms: surface emission, diffusion, and capillary conduction. All of
those properties are different from one material to another. In order to predict the MBV, it is definitely necessary to identify the parameters which are most relevant to the moisture buffering property. In the following these parameters are discussed.
3.2.1 Surface emission
Surface emission is characterized by the resistance when the moisture moves from the material surface to the surrounding air. It is called surface emission coefficient S. Because this is a convective transfer, the corresponding moisture transfer resistance decreases with increasing velocity of the ambient air. Hence, this parameter is dependent not only on the material characteristics but also on the micro structure of the surface, which could have a significant influence on the micro-scale airflow. In the conventional methods, S is acquired only by measurements which have a certain surface structure of the material and certain flow of the ambient air, which means that the S value is only valid within the measurement conditions. In this case, the measurement setup should not be largely different from the indoor airflow condition. There also have been attempts to define a model which is able to predict this convective moisture transfer without using the S value. Defraeye et al. (2012) created a conjugate model that can take into account the spatial and temporal variability of S, which is determined a posteriori in the model. However, the calculation model itself is not easy to deal with on the practical level yet.
3.2.2 Diffusion
Diffusion is characterized by two mechanisms in the material, namely vapor diffusion and surface diffusion. Vapor diffusion occurs through the pores and micro capillaries in the material. Its driving force is the gradient of the vapor pressure. The phenomenon is generally described by Fick’s law of diffusion. When discussing the vapor diffusion through building materials which have micro pores, Fick’s diffusion is not actually applicable to describe the diffusion phenomenon because the collisions between molecules and the inner surface of the material occurs more often than those between molecules themselves. This transport mechanism is called Knudsen transport. The Knudsen number determines whether statistical mechanics or the continuum mechanics formulation of fluid dynamics has to be used: if its value Kn is near or greater than one, the mean free path of a molecule is comparable to a length scale of the problem, and the continuum assumption of fluid mechanics is no longer a good approximation. In this case statistical methods have to be considered. However, when the normal conditions which are covered in building physics are applied, the resistance against the diffusion is given by dividing the
water vapor diffusion coefficient in air by water vapor diffusion resistance factor μ. By introducing μ, Knudsen transport can also be modeled in the similar way as Fick’s diffusion (Gertis 1976). Therefore it is significant to give the appropriate μ value of the material when modeling vapor diffusion within the simulations of porous building materials.
The other one is surface diffusion. This is the diffusions of the water molecule which is accumulated on the inner surface of the material. Relative humidity can be used as the driving potential when describing this mechanism by Fick’s law (Künzel 1995). When discussing the moisture buffering of a material due to moisture transport, this diffusion is less important since the transfer of the accumulated water does not give the weight change. However, this needs to be taken into account in the overall transfer model because all the moisture transports driven by the same potential are dependent on each other and cannot be separated from the whole system.
3.2.3 Capillary conduction
Capillary conduction happens when the micro capillaries are filled with liquid water. This accumulation is often called capillary condensation. The transport of this water is described by means of Hagen-Poiseuille law. It was reported that this law can be approximated by Fick’s diffusion equation by introducing the capillary transport coefficient which depends on the water content of the material (Crank 1975). Relative humidity is widely used as the driving potential to describe the transport mechanics.
3.3 The relevant parameters to model moisture buffering
As shown above, the moisture transfer mechanisms which are relevant to building materials can be modeled by diffusion law. In fact several studies have been done to predict the sorption behavior of materials using Fick’s diffusion model. Wadso (1993a,b) measured the sorption property of soft wood by the decently designed apparatus, and one of the results was that the diffusion coefficient gained within the measurements using dynamic change of humidity condition was much lower than the literature values which were gained under steady state conditions. Shi (2007) carried out the analyses of the sorption behavior of wood fiber board and wood fiber-based composites using a nonlinear curve fitting algorithm method. This was the attempt to fit the Fickian model curve to the measured weight change curve by changing the parameters, namely the moisture diffusion coefficient and the surface emission coefficient. Consequently it was shown that even though Fickian diffusion may not exactly model the actual sorption behavior, it was possible
to reproduce the measured curve roughly, which is actually good enough to calculate the MBV. Those studies give an important indication that as far as Fick’s diffusion model is concerned, the fitting of the curve can be achieved by controlling the value of diffusion coefficient and surface emission coefficient.
In the present study, the Fickian model was assumed to be sufficient to model the adsorption/desorption process in order to predict the weight change.The general goal of this study was to establish the holistic designing method of the wall make-up and the whole building being free from any experimental processes. It must be clearly noted that it was not aimed to develop a highly sophisticated model but rather to establish the method with which the MBVs of building materials can be roughly estimated.
3.4 Simulation tool
In order to carry out a reliable modeling of moisture buffering within the protocol of NORDTEST, it is necessary to employ a suitable simulation tool. The complexity of the model depends on the tools, but it is reasonable that the model is able to deal with the simultaneous heat and moisture transfer. Even though NORDTEST is performed in isothermal situation, the energy which are relevant to both heat and moisture transfer such as latent heat should be taken into account for achieving more reliable simulations. As for the geometry of the model, one dimensional model is enough because only one side of the test specimen is exposed to the air with humidity steps.
Numbers of simulation tools to carry out the one dimensional transient heat and moisture transfer through multi-layered building components have been developed and some of them are available commercially (for example, MATCH 1.6.0.5 (Bygge- og Miljøteknik 2003) and 1D-HAM (Hagentoft and Blomberg 2000)). WUFI Pro 5.1® is one of those tools (Fraunhofer-Institute for Building Physics 2011). The materials can be modeled by giving its thickness, bulk density in dry condition, porosity, moisture-dependent thermal conductivity, moisture storage function (sorption isotherm), moisture dependent vapor diffusion resistance factor (μ), specific heat capacity and liquid transport coefficient for suction and redistribution. In addition to those material properties, the surface emission resistance can be introduced by considering Sd-value which is the equivalent
air layer thickness in terms of diffusion resistance.
The coupled differential equation of heat and moisture transport used in WUFI is given in Eqs. (4) and (5) (Künzel 1995). v p sat d ( ) ( ( )) d H θ θ h δ φp θ⋅ t= ⋅ + ⋅ (4) p sat d ( ( )) d φ φ w D φ δ φp φ⋅ t = ⋅ + (5)
where dH/dθ (J/(m3·K)) is heat storage capacity of the
material, dw/dφ (kg/m3) is its moisture storage capacity of the
building material, (W/(m·K)) is its thermal conductivity,
Dφ (kg/(m·s)) is its liquid transport coefficient, δp (kg/(m·s·Pa))
is its water vapor permeability, hv (J/kg) is evaporation
enthalpy of water, psat (Pa) is water vapor saturation pressure, θ(℃) is temperature and φ is relative humidity. In the
calculation of WUFI Pro 5.1®, those differential equations are dealt as one dimensional heat and mass transfer.
As for the modeling of each moisture transport mechanism explained in Section 3.2.2, the resistance against vapor diffusion is given by μ. Also it should be noted that surface diffusion and capillary conduction are combined and described by the Fickian diffusion using relative humidity as the driving potential where the resistance factor is given by liquid transport coefficient Dφ.
3.5 Measurements of MBV
3.5.1 Test specimen
The interior finishing materials were chosen according to the design philosophy of the envelope system, which means the materials must be hygroscopic, natural and contain no toxic substances. Two materials were identified, namely a clay board and a composite of wood fiber and clay. The clay specimens were prepared with two thicknesses (14 mm and 20 mm) with the same composition of the ingredients. The thickness of the wood fiber/clay composite was 20 mm. Those boards were cut into 250 mm´250 mm square shaped specimens. In order to investigate the more realistic MBV, the boards with surface finishing were also considered. This 8 mm thick finishing was done with fine clay plaster which consists of several layers in accordance with the conventional plastering work including the surface painting. All surfaces of each board except the one which was exposed to the ambient air were coated by wax and sealed with aluminum tape so that no moisture uptake/release did happen through those surfaces. The specimens were seasoned in a climatic chamber under 23℃ and 50 %RH preliminary to the measurements.
3.5.2 NORDTEST
The MBV measurement was performed in a chamber (Feutron® Typ3523/16 Feutron Klimasimulation GmbH). In this chamber each material was exposed to the periodic change of the relative humidity, namely 8 hours at 75%RH and 16 hours at 33%RH and both at 23℃. This condition
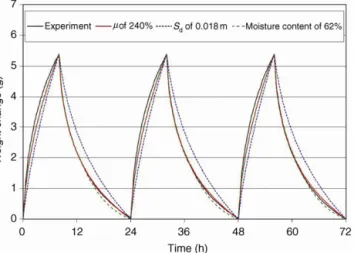
was in accordance with the NORDTEST protocol which assumes to be representing the actual moisture situation of rooms of normal residential buildings taking into account the human activities. The air inside the chamber was con- tinuously circulated so that there was no humidity gradient in the air. The weight of the specimen was measured every 12 minutes automatically. The agitation of the air was stopped at the weighting time so that the airflow did not disturb the measurement. The measurements were finished when the difference of the weight change within one cycle (24 hours) was within 5% difference in the last three cycles in a row. The measured weight change curve is shown in Fig. 2 and gained MBVs are listed in Table 1.
Fig. 2 Experiment and simulation result of NORDTEST: (a) non- plastered specimens; (b) plastered specimens
3.6 Comparison of the measurement and the prediction of MBV
3.6.1 Numerical simulation
The models corresponding to the measurements described above were created for the following materials: clay board of 14 mm thick, clay board of 20 mm thick, wood fiber/clay composite of 20 mm thick and the corresponding plastered boards of each type. In order to carry out more reliable simulations, the following material properties were measured: density in dry condition, thermal conductivity at different humidity conditions (0 and 80%RH), water vapor diffusion resistance factor at different humidity conditions (15%, 25%, 40%, 71.5%, and 86.5%RH, 23℃), and equilibrium moisture content at different humidity conditions (0, 30%, 50%, and 90%RH, 23℃). Porosity and specific heat capacity were taken from the database (Fraunhofer-Institute for Building Physics 2011) since those are assumingly not much relevant to the simulation result as long as NORDTEST is concerned. As for the plaster which was put on those materials, only the water vapor diffusion resistance factor was measured. The other parameters were taken from the abovementioned database. Those parameters are listed in Table 2.
The geometry of the model of plastered clay board of 20 mm is shown in Fig. 3 as an example. The Sd-value of
the surface of the plaster was tentatively given at 0 m.The other side of the specimen was modeled to be covered with an impermeable membrane with the Sd-value of 1500 m
because the specimen was sealed so that no moisture transfer was allowed. The heat resistance of each surface was set at 0.125 m2·K/W, which is the conventional value for indoor
partition wall.
The initial conditions for the simulation was set at 23℃ and 50%RH as the specimens for the NORDTEST were seasoned under this condition preliminary to the measurement. As a preliminary simulation, the simulation with the boundary condition which was extracted from the measurement (the measured temperature and the relative humidity) and the simulation with the designed boundary condition which merely reproduces the designed humidity jump were compared to each other. The result of those simulations corresponded to each other with a very high accuracy. Therefore the climatic condition in the actual simulations was given by the designed condition. The Table 1 Measured and predicted MBV
Moisture buffer value (MBV) (g/(m2
·%RH))
Clay board 14 mm Clay board 20 mm
Woodfiber/clay composite Clay board 14 mm plastered Clay board 20 mm plastered Wood fiber/clay composite plastered Experiment 1.55 1.62 2.05 1.46 1.40 1.56 Simulation 1.63 1.72 2.92 1.57 1.54 1.76
predicted weight change is shown in Fig. 2 and predicted MBV is listed in Table 1.
3.6.2 Comparison of the measurement and the prediction of MBV
As shown in Fig. 2(a), the experimental moisture buffering property of clay boards did not show the difference due to the thickness difference. This was because the thinner board (14 mm) was already thicker than the thickness of the sorption active part (generally called “penetration depth”). The prediction of the MBV of those boards was achieved with high accuracy. Regarding the MBV prediction of wood fiber/clay composite, the calculated value was 42% higher than the experimental value. It is assumed that wood fiber has a certain influence on this slower reaction to the moisture adsorption/desorption. Compared to mineral-based materials, which have been examined their buffering property by numerical means more or less successfully (for example (Roels 2008)), wood and wood-based materials are difficult to model due to the “retarded sorption” effect resulting from its complex cell wall structure. Håkansson (1998) conducted extensive analyses on the sorption property of thin wood samples by experimental and numerical investigations based on modified Fickian approach. It was shown that the prediction of sorption property was achieved rather accurately when internal nodes, which represent the nonlinear conductance taking into account the hysteresis, were introduced in the conventional Fickian model. Since this internal nonlinear conductance could not be modeled within WUFI program, the simulation shows by far faster
moisture uptake which results in the higher MBV value. It is suggested that experimental values shall be used for moisture balance simulations when modeling the moisture buffering by woods or wood-based materials unless models which can take into account the nonlinear moisture con- ductance are available. The finite difference model considering the hysteresis suggested by Korjenic and Bednar (2011) might be one of potential methods to model the nonlinear behavior.
Nevertheless, it should be still possible to roughly reproduce the moisture buffering performance of the wood fiber/clay composite by WUFI simulation using arbitrary parameters as explained in Section 3.3. Therefore simulations with higher water vapor diffusion resistance factor μ, higher Sd-value which represents the lower surface emission
coefficient and lower equilibrium moisture content were carried out as a parametric study. The same MBV as the actual measurement was gained when μ was set at 14.1 (240% of the measured value), when Sd-value was set at 0.018 m,
and when the equilibrium moisture content was reduced by 62%. Figure 4 shows the predicted moisture buffering curves of those together with the experimental result. The arbitrary change of μ gave the best fit to the empirical data. On the other hand, that of Sd-value did not give the fit to
the measured curve. This gives potential indication of how to roughly model the moisture buffering properties of wood and wood-based materials, which simply focuses on μ only. More holistic studies with more variety of wood-based materials might give a standardized method of predicting the MBV.
Table 2 Input parameters for the NORDTEST simulations Thermal conductivity
(W/(m·K))
Water vapor diffusion resistance factor μ
Equilibrium moisture content (kg/m3) Bulk density (kg/m3) Porosity (m3/m3) Specific heat capacity (J/(kg·K)) 0% RH 80% RH 15% RH 25% RH 40% RH 71.5% RH 86.5 RH 0% RH 30% RH 50% RH 90% RH 100% RH Clay board 1438 0.6 1500 0.30 0.49 7.6 8.7 8.1 7.2 6.1 0.0 6.26 8.42 16.85 300 Wood fiber/clay composite 495 0.88 1500 0.06 0.07 5.1 6.7 5.6 5.7 5.7 0.0 15.4 20.9 52.3 300 Clay plaster 1514 0.42 1000 0.59 1.63 15.2/11.3 (clay board/composite) 0 6.0 10.0 25.4 294
Fig. 4 The prediction of moisture buffering performance of the wood fiber/clay composite by arbitrary changes of moisture transfer parameters
Figure 2(b) shows that the moisture buffering per- formance of all the plastered samples was more or less the same, which means that the clay plaster was thicker than the moisture penetration depth. The prediction was more or less successful. This result indicated that it is very important to carefully choose the interior finishing material and its thickness in order to make use of the buffering property of the base material. When the thickness of the surface finishing is thicker than its penetration depth, the moisture buffering performance is defined by this surface material. On the other hand, when it is thinner than its penetration depth, the base material would contribute to the overall buffering performance. An additional simulation of the wood fiber/clay composite with a plaster which has the same material property but is 3 mm thick (less moisture capacity and lower diffusion resistance than the original thickness 8 mm) was conducted. It was shown that this system has a better buffering performance compared to the 8 mm plastered one by 67.8% because the whole interior finishing system was enhanced by the buffering performance of the wood fiber/clay composite which has better property than the plaster under the NORDTEST condition. The simulation result is shown in Fig. 5. This is an important indication of future material and wall system development when trying to enhance the indoor moisture buffering. 4 Heat and moisture balance simulation of a whole building
4.1 Example case
Within this project, several test houses are planned to be built in central Japan whose climatic condition is subtropical. In the present study, one of those test houses with a floor area
Fig. 5 The difference of buffering performance due to the thickness difference of the plaster
of 58.7 m2 (hereafter called “Test House”) was chosen for
carrying out the in-situ measurement of the room climate (Fig. 6). Test House will be located in Ohmihachiman city, and actual inhabitants (two adults) will be living in it. The wall make-up consists of external finishing with wooden cladding, 18 mm thick air layer, 180 mm thick wood fiber insulation, wind-tight and vapor-open membrane, structural wooden panel, 14 mm thick clay board and thin layer of plaster as interior finishing.
4.2 Heat and moisture balance simulation
The heat and moisture balance simulations were carried out in accordance with the methods described in Section 2.
As for the heat balance simulation, the whole building was modeled as one volume. The U-value of the wall and roof was 0.20 W/(m2·K) and that of the windows was 1.3–
1.5 W/(m2·K). The heat storage by the interior material (for
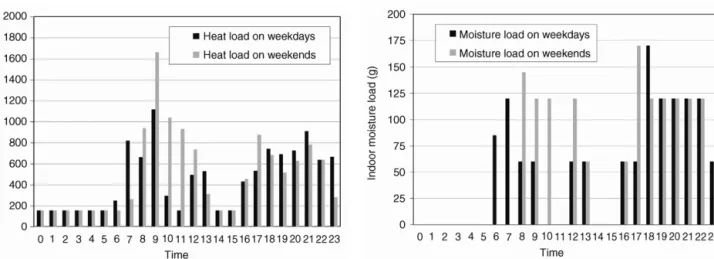
example the interior finishing with clay board and clay plaster) was taken into account by giving its area and heat capacity. The heating and cooling set-point temperature was set at 20℃ (maximum heating power: 3.0 kW) and 27℃ (maximum cooling power: 1.5 kW). Regarding the solar gains, it was modeled so that a movable shading was activated when the room temperature reached 25℃ or higher. The daily schedule of the internal heat gain due to the human activities and the appliances were defined in accordance with the Japanese guideline of energy consumption calculation (IBEC 2009). The difference of the occupation and human activities between weekdays and weekend was considered. The weekly schedule is shown in Fig. 7(a). Regarding the ventilation, the mechanical ventilation with heat recovery was translated into a reduction of ventilation rate considering the actual efficiency of the heat exchanger. The input of
Fig. 6 Test House (in meters. upper left: floor plan of the 1st floor; lower left: floor plan of the ground floor; upper right: south facade; lower right: east facade)
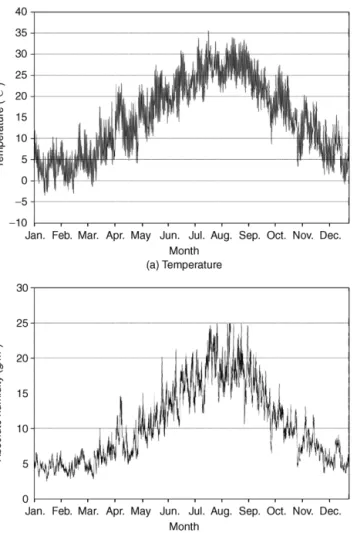
the modified ventilation rate was 0.14 (1/h). The climatic conditions at this site were generated with METEONORM 6.1 (©Meteotest, Bern, 2010) for Hikone city where there is the nearest weather station around Ohmihachiman city (at latitude 35.2° north and longitude 136.1° east). Its temperature and absolute humidity is shown in Fig. 8.
Regarding the moisture balance simulation taking into account the moisture buffering by interior materials, two MBVs were used. One was the MBV of untreated softwood which covers the large percentage of the ceiling (26.0 m2).
The actual experimental MBV was 1.2 g/(m2·%RH) which is
given in (Rode et al. 2005) as the value of untreated spruce wood. The other one was the MBV of the finishing of the walls with the clay board of 14 mm thick and the plaster of 8 mm thick (24.7 m2). The actual predictedMBV of this was
1.57 g/(m2·%RH). The temperature dependency of MBV of
each material was disregarded (the inputs were constant). The internal moisture load of the living room was defined according to the inhabitants’ occupancy and activities based on the literature (IBEC 2009). The weekly schedule is shown
Fig. 8 Climatic condition of Hikone city throughout a year: (a) temperature; (b) absolute humidity
in Fig. 7(b). The supply airflow rate was 50 m3/h. For taking
into account the dehumidification in summer, the moisture load due to the supply air was reduced assuming a radiator type dehumidifier with the surface area of 4.6 m2, which is
actually planned to be installed. It was modeled that this equipment was activated giving the surface temperature of 18℃ when the room air was 25℃ or higher.
4.3 Results
The result of the heating and cooling energy demand was 9.4 kWh/m2 and 14.5 kWh/m2, respectively. The predicted
interior temperature and the relative humidity of the living room which took into account the moisture buffering throughout the year is shown in Fig. 9. In order to clarify the effect of moisture buffering, the relative humidity was calculated in two cases, namely one case which takes into account the moisture buffering by the interior and the other case which does not. Those results in a humid period (from 22.08 to 01.09) are shown in Fig. 10.
Fig. 9 Predicted room climate: (a) temperature; (b) relative humidity
Fig. 10 Comparison of predicted relative humidity: “with moisture buffering” vs. “without moisture buffering”
5 Discussion
The energy consumption for both heating and cooling was low enough compared to the other advanced standards such as Passivhaus standard (Passivhaus Institut, heating load lower than 15 kWh/m2) and MINERGIE-P® standard
(MINERGIE® Building Agency, heating load lower than around 20 kWh/m2). This is because of the sufficient amount
of the insulation and the design considering the solar gains in winter. Slight overheating in summer was observed (the room temperature exceeded the set-point cooling temperature) even though the shading system was activated. Therefore it is assumed that the interior heat load due to the appliances and human activities have a certain influence on it. No energy consumption for dehumidification was accounted within this calculation method because the radiators were activated in summer with cold water circulation. The condensation on the radiators did not cause additional energy consumption except the one for operating the water circulation.
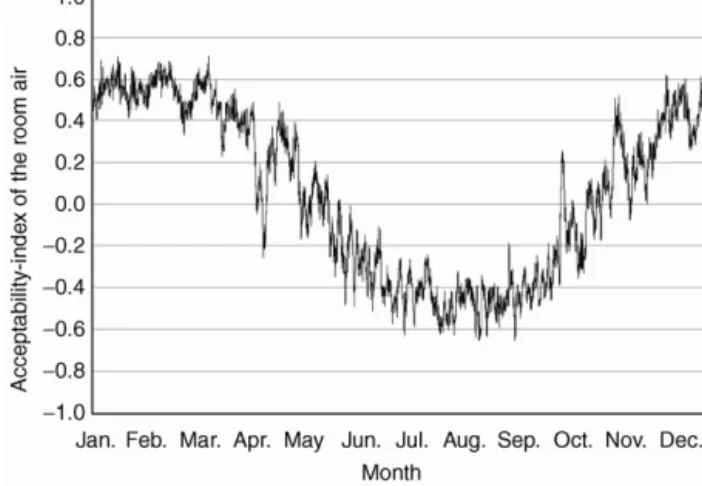
In Fig. 10 it is shown that the moisture buffering by the interior finishing reduced the humidity fluctuations. According to (Fang et al. 1998), the indoor air quality can be defined with an acceptability-index (Acc.), based on the air temperature, humidity and the pollution level. Acc. is given between 1.0 and –1.0. The higher the value, the more comfortable is the air. Figure 11 shows the predicted acceptability-index in the living room throughout the year for clean air (no CO2 concentration or contamination by
hazardous gasses). Figure 12 shows the comparison with the two cases, namely with and without buffering. The mean values of the Acc. did not change with the buffering function. However, it is worth noting that the fluctuation of the Acc. was reduced significantly.
Fig. 11 Air acceptability-index of living room throughout a year
Fig. 12 Comparison air acceptability-index: “with moisture buffering” vs. “without moisture buffering”
Apparently there is a substantial potential to improve the Acc. in summer. However, there is a fundamental trade-off between the energy consumption and the Acc. It is obvious that giving lower set-point temperature for cooling would result in the better Acc. but at the same time in higher cooling energy consumption. Also introducing mechanical dehumidification would result in the similar result. The important point is that there is a strong need to find the optimum for maximizing the benefit and minimizing the environmental load due to those measures. The possible parameters to be taken account are set-point temperature for heating and cooling, mechanical dehumidification, criteria for the activation of shading, mechanical ventilation and optimal insulation thickness with regard to energy consumption. Because those factors are dependent on each other in terms of creating indoor comfort and energy consumption, there is a strong need to develop a holistic method to find the optimum building design considering all those parameters.
MBV, an additional parametric study was conducted. The same calculation was carried out using the measured MBV of the plastered 14 mm clay board (1.46 g/(m2·%RH)) and
its result was compared to the result presented above. The difference between the predicted relative humidity of the living room was 0.9% at a maximum.
In the end, the transient heat moisture transfer simulation across the envelope described in (Goto et al. 2011) was carried out using the temperature and the humidity obtained by this heat and moisture balance simulation. The result showed that there was no interstitial condensation inside the envelope. As a result, it was concluded that the utilization of the building envelope system introduced in this study has a high potential to provide the low-energy-consuming and durable houses in subtropical regions. The present model will be validated by the in-situ measurement in Test House in the near future.
6 Conclusions
In this study, the heat and moisture balance simulation of building with the sustainable building envelope for subtropical climate was proposed. In the moisture balance simulation the moisture buffering by the interior materials was taken into account. The prediction of MBV of the interior finishing materials was attempted using transient heat and moisture transfer model. This model was validated by the actual moisture buffering test of those materials. In the end, the whole building calculation was carried out and the contribution of the moisture buffering to the indoor comfort and energy consumption was investigated using the climatic condition of Hikoneas a reference case.
Following conclusions were made:
(1) The MBVs of the clay board and the ones with clay plaster were predicted with high accuracy. However, that of wood fiber/clay composite was 42% higher than the experimental value. It is suggested that experimental values shall be used for moisture balance simulations when modeling the moisture buffering by woods or wood-based materials unless models which can take into account the nonlinear moisture conductance are available. (2) It was indicated that the moisture buffering properties
of wood and wood-based materials might be modeled with Fickian model in which modified vapor diffusion resistance is applied. More holistic studies with more variety of wood-based materials might give a standardized method of predicting the MBV.
(3) When designing the interior finishing enhancing its moisture buffering performance, the system within the penetration depth should be carefully designed. (4) The heating and cooling energy demand of the Test
House was 9.4 kWh/m2 and 14.5 kWh/m2 respectively,
which were fairly low. No energy consumption for dehumidification was accounted because of the radiator- based dehumidification strategy.
(5) The moisture buffering significantly contributed to the reduction of the relative humidity fluctuation. This also resulted in more stable air acceptability index.
(6) In order to enhance both energy efficiency and indoor comfort, there is a strong need to develop a holistic method to find the optimum building design considering design measures, whose performance are dependent on each other, such as set-point temperature for heating and cooling, mechanical dehumidification, criteria for the activation of shading, mechanical ventilation, insulation thickness and so on.
(7) From the findings mentioned above, it was concluded that the utilization of the building envelope system introduced in this study has a high potential to provide the low-energy-consuming and durable houses in sub- tropical regions. The present model will be validated by the in-situ measurement in Test House in the near future. Acknowledgements
The authors express the gratitude to Mr. and Mrs. Iida for their cooperation for the realization of the test house. The innovation promotion agency Commission for Technology and Innovation of the Swiss Confederation is also acknow- ledged for the financial support (grant 9755.1 PFIW-IW). References
Bygge- og Miljøteknik (2003). MATCH 1.6.0.5 Moisture and temperature calculations for constructions of hygroscopic materials. Available at online. http://www.match-box.dk. Accessed 18 Jan. 2012. Chan KT, Chow WK (1998). Energy impact of commercial-building
envelopes in the sub-tropical climate. Applied Energy, 60: 21-39. CIB & UNEP-IETC (2002). Agenda 21 for Sustainable construction
in developing countries—Discussion document. Available at online. http://cibworld.xs4all.nl/dl/publications/Agenda21Book.pdf. Accessed 18 Jan. 2012.
Crank J (1975). The Mathematics of Diffusion. Oxford: Oxford University Press.
Defraeye T, Blocken B, Carmeliet J (2012). Analysis of convective heat and mass transfer coefficient for convective drying of a porous flat plate by conjugate modeling. International Journal of Heat and Mass Transfer, 55: 112 124.
Fang L, Clausen G, Fanger PO (1998). Impact of temperature and Humidity on the Perception of Indoor Air Quality. Indoor Air, 8: 80 90.
Frank T, Carl S (2006). Ueberarbeitung Programm Helios Helios-XP Schlussbericht. Swiss Federal Office of Energy. (in German) Fraunhofer-Institute for Building Physics (2011). WUFI® PC-Program
components. Available at online. http://www.wufi.de/index_e.html. Accessed 18 Jan. 2012.
Gertis K (1976). Hygrische Transportphaenomene in Baustoffen. Berlin: Verlag Ernst & Sohn. (in German)
Goto Y, Ghazi Wakili K, Ostermeyer Y, Frank T, Ando N, Wallbaum H (2011). Preliminary investigation of a vapor-open envelope tailored for subtropical climate. Building and Environment, 46: 719 728.
Hagentoft CE, Blomberg T (2000). 1D-HAM version 2.0, coupled heat, air and moisture transport in multi-layered wall structures. Available at online. http://www.buildingphysics.com/manuals/1dham.pdf. Accessed 18 Jan. 2012.
Håkansson H (1998). Retarded sorption in wood – Experimental study, analysis and modelling. PhD dissertation, Department of Building Sciences, Lund University, Sweden.
IBEC (Institute for Building Environment and Energy Conservation) (2009). Calculation method of energy consumption of buildings in the standard for determination by business and building owners. Available at online. http://ees.ibec.or.jp/documents/index.php. Accessed 18 Jan. 2012. (in Japanese)
ISO/DIS 24353 (2006). Hygrothermal performance of building materials and products—determination of moisture adsorption/ desorption properties in response to humidity variation. International Organization for Standardization.
ISO 13790 (2007). Energy performance of buildings—Calculation of energy use for space heating and cooling. International Organization for Standardization.
Jarvis JQ, Morey PR (2001). Allergic respiratory disease and fungal remediation in a building in a subtropical climate. Applied Occupational and Environmental Hygiene, 16: 380 388. JIS A 1470-1 (2002). Test method of adsorption/desorption efficiency
for building materials to regulate an indoor humidity—Part 1: Response method of humidity. Japanese Standards Association. Kishi R, Saijo Y, Kanazawa A, Tanaka M, Yoshimura T, Chikara H,
Takigawa T, Morimoto K, Nakayama K, Shibata E(2009). Regional differences in residential environments and the association of dwellings and residential factors with the sick house syndrome: a nationwide cross-sectional questionnaire study in Japan. Indoor Air, 19: 243 254.
Korjenic A, Bednar T (2011). Developing a model for fibrous building materials. Energy and Buildings, 43: 3189 3199.
Künzel HM (1995). Simultaneous heat and moisture transport in building components—One- and two-dimensional calculation using simple parameters. Stuttgart: IRB Verlag.
Meteotest (2010). METEONORM 6.1. http://meteonorm.com. Accessed 7 Jun. 2012.
Osanyintola OF, Simonson CJ (2006). Moisture buffering capacity of hygroscopic building materials: Experimental facilities and energy impact. Energy and Building, 38: 1270 1282.
Padfield T, Larsen PK (2004). How to design museums with a naturally stable climate. Available at online. http://www.conservationphysics.org/musdes/musdes.pdf. Accessed 18 Jan. 2012.
Peper S, Feist W (2001). Climate Neutral Passive House Estate in Hannover-Kronsberg: Construction and Measurement Results. Available at online. http://www.passivhaustagung.de/zehnte/ englisch/texte/PEP-Info1_Passive_Houses_Kronsberg.pdf. Accessed 18 Jan. 2012.
Rode C, Grau K (2008). Moisture buffering and its consequence in whole building hygrothermal modeling. Journal of Building physics, 31: 333 360.
Rode C, Peuhkuri R, Mortensen L, Hansen K, Time B, Gustavsen A, Ojanen T, Ahonen J, Svennberg K, Arfvidsson J (2005). Moisture Buffering of Building Materials. Report BYG-DTU R-126, Department of Civil Engineering, Technical University of Denmark, Denmark.
Roels S (2008). Experimental analysis of moisture buffering. The International Energy Agency Annex 41.
Shi SQ (2007). Diffusion model based on Fick’s second law for the moisture absorption process in wood fiber-based composite: is it suitable or not? Wood Science and Technology, 41: 645 658. Tariku F, Kumaran K, Fazio P (2011). Determination of indoor humidity
profile using a whole-building hygrothermal model. Building Simulation, 4: 61 78.
UNEP (2003). Sustainable building construction. Industry and
Environment, 26 (2 3).
Wadso L (1993a). Measurements of water vapour sorption in wood. Part 1: Instrumentation. Wood Science and Technology, 27: 396 400. Wadso L (1993b). Measurements of water vapour sorption in wood.
Part 2: Results. Wood Science and Technology, 28: 59 65. Zürcher C, Frank T (2010). Bauphysik – Bau & Energie. Zurich: VDF