A high resolution record of vegetation and environmental variation through the last
∼25,000 years in the western part of the Chinese Loess Plateau
H.N. Wu
a,b, Y.Z. Ma
c, Z.-D. Feng
a,d,⁎
, A.Z. Sun
e, C.J. Zhang
a, F. Li
a, J. Kuang
aa
MOE Key Laboratory of West China's Environmental System, Lanzhou University, Lanzhou 730000, China
bGansu Provincial Water Resources and Hydropower School, Lanzhou 730020, China c
State Key Laboratory of Earth Surface Processes and Resource Ecology, Beijing Normal University, Beijing 100875, China
d
Department of Geology, Baylor University, Waco, TX 76798, USA
e
School of Geography Science, Southwest University, Chongqing 400715, China
a b s t r a c t
a r t i c l e i n f o
Article history:Received 30 July 2008
Received in revised form 12 December 2008 Accepted 21 December 2008 Keywords: Loess plateau MIS 2 Holocene Pollen record Vegetation history
We present a high-resolution reconstruction of vegetation and environmental changes from a 40-m thick section in the western part of the Chinese Loess Plateau in attempt to reveal the details of the MIS 2 and MIS 1 climate variations. Our data show that a desert steppe occupied the landscape between∼24,500 and ∼13,600 14C yr BP. Two episodes of further vegetation deteriorations occurred between ∼20,000 and
∼17,10014C yr BP and between
∼15,100 and ∼13,60014C yr BP, corresponding to the Heinrich events 2 and 1.
The late glacial stage between∼13,600 and ∼988014C yr BP included four sub-stages that correspond
chronologically and climatologically to the European deglacial sub-stages. Thefirst sub-stage (∼13,600 to ∼12,40014C yr BP) corresponds to the Bølling warm period; the second sub-stage (
∼12,400 to ∼11,50014C yr
BP) to the Older Dryas cold period; the third sub-stage (∼11,500 to ∼10,70014C yr BP) to the Allerød warm
period; and the fourth Sub-stage (∼10,700 to ∼988014C yr BP) to the Younger Dryas cold period. The early–
mid Holocene (∼9880 to ∼437014C yr BP) was a period when a forest steppe dominated the landscape under
a warm and wet climate. During this period, eight cool and dry spells occurred at∼972014C yr BP (E1),
∼938014C yr BP (E2),∼887014C yr BP (E3),∼866014C yr BP (E4),∼844014C yr BP (E5),∼8240 to ∼806014C
yr BP (E6),∼7120 to ∼655014C yr BP (E7), and∼5640 to ∼512014C yr BP (E8). After a major deterioration in
vegetation between∼4370 to ∼327014C yr BP, the study area experienced improved moisture conditions
between∼3270 to ∼145014C yr BP, followed by a persistent deterioration of vegetation under a drying
climate during the past∼1500 years.
© 2009 Elsevier B.V. All rights reserved.
1. Introduction
The past ∼25,000 years, which covers the last two complete marine isotope stages (i.e., MIS 2 and MIS 1), witnessed the most dramatic climatic changes of global scale during recent geologic history. Specifically, the Earth's climatic systems of the past 25,000 years experienced the Last Glacial Maximum at∼20,000 yr BP, the extremely unstable late glacial climatic oscillations between ∼15,000 and ∼10,000 yr BP, and then the Holocene Climatic Optimum at∼6000 yr BP (Bradley, 1999; Ruddiman, 2008). Although we have learned a lot about the climate changes of this period through several international programs (e.g.,CLIMAP, 1981; COHMAP, 1988), we need to further improve our understanding of regional climatic variations (Ruddiman, 2008). In that regard, the Chinese Loess Plateau, where the study area (i.e., the Zulihe River Basin) is located, is situated at an extremely important location. First, the high-latitudinal
continent-originated winter monsoon is considered to have dominated the interactions between the winter and summer monsoons during MIS 2 (from∼25,000 to ∼10,000 yr BP) (Zhou et al., 1996). Second, the low-latitudinal ocean-originated summer monsoon is shown to have dominated the interactions during MIS 1 (the past∼10,000 years) (An et al., 2000). Third, violent interactions between the winter and summer monsoons are considered to have characterized the late glacial period between∼15,000 and ∼10,000 yr BP, although only few records support this characterization (e.g., Zhou et al., 1999). In addition, the climatic systems of this period are also demonstrated to have changed on millennial–centennial scales (Bond et al., 1997, 2001) and these changes have been well documented in the North Atlantic area at higher latitudes (McManus et al., 1994; Oppo et al., 2003) and also in the Yangtze River Basin at lower latitudes (Wang et al., 2001, 2005). It is apparent that the need is pressing to investigate regional responses to these millennial–centennial scale climate changes in the western part of the Chinese Loess Plateau in middle latitudes to explore the geographic coherence of these changes.
Environmental and vegetation changes have been one of the foci for studying the global conditions within and between different ⁎ Corresponding author. Department of Geology, Baylor University, Waco, TX 76798,
USA. Tel.: +1 254 710 2194; fax: +1 254 710 2673. E-mail address:zhaodong_feng@baylor.edu(Z.-D. Feng).
0031-0182/$– see front matter © 2009 Elsevier B.V. All rights reserved. doi:10.1016/j.palaeo.2008.12.023
Contents lists available atScienceDirect
Palaeogeography, Palaeoclimatology, Palaeoecology
climate states and also for assessing land–air interactions under different vegetation conditions during different climate states (Bridg-man and Oliver, 2006). Unfortunately, high-resolution and well-dated pollen records are rarely available from the Chinese Loess Plateau, especially for the period between 25,000 and 10,000 years. The best early pollen work was undertaken bySun et al. (1995), who analyzed over 300 pollen samples (with 6 conventional 14C dates and 2 TL
dates) for the period covering the last∼100,000 years from a Weinan loess section (34.4° N and 109.5° E) in the southeastern part of the Chinese Loess Plateau. Recently,Feng et al. (2007)analyzed over 260 pollen samples covering the period between ∼ 50,000 and ∼10,000 years (with 20 AMS14
C dates) from a Jingning lacustrine– wetland–eolian section (35.5° N and 105.9° E) in the western part of the Chinese Loess Plateau.
MIS 1 of the Chinese Loess Plateau is better palynologically studied than MIS 2.Li et al. (2003)established a high-resolution Holocene pollen sequence from a Yulin sand–loess–peat section (37.5° N and 108.5° E) in the northeastern part of the Chinese Loess Plateau with 120 pollen samples and 23 AMS14C dates. In the western part of the
Chinese Loess Plateau, three high-resolution and well-dated Holocene loess–paleosol sequences have been recently established by Feng and his colleagues (Feng et al., 2004, 2006; Sun et al., 2007). First, 105 pollen samples with a chronological support of 8 AMS14C dates were
analyzed at a Dingxi Lacustrine–wetland and loess–paleosol sequence (32.5° N and 104.5° E). Second, 250 pollen samples with a chronological support of 9 AMS14C dates were analyzed at a Qin'an
(i.e., DDW site inFig. 1) wetland–fluvial and loess–paleosol sequence (35.1° N and 105.9° E). Third, 210 pollen samples with a chronological support of 9 AMS14C dates were analyzed at a Haiyuanfluvial–loess–
paleosol sequence.
Here, we present a high-resolution reconstruction of environ-mental variations and associated vegetation changes, based on 711
pollen samples and 1914C dates, from a 40-m thick lacustrine–fluvial–
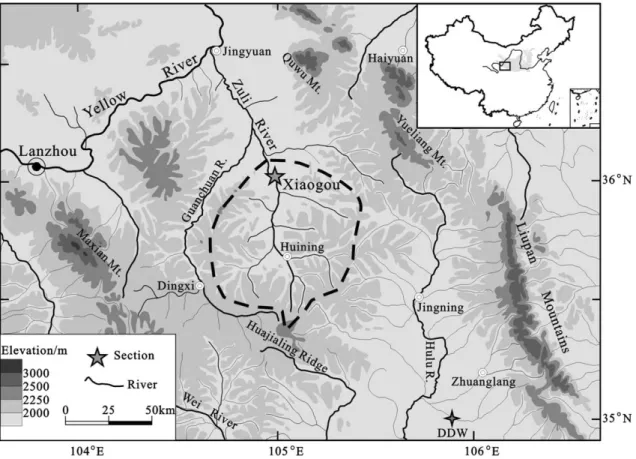
eolian sequence at Xiaogou section (36.1° N and 104.9° E) in the western part of the Loess Plateau (Fig. 1) in attempt to reveal the details of the MIS 2 climate changes and to further confirm the temporal patterns of the Holocene climatic changes documented at other sites. It is expected that this research will add a piece of valuable infor-mation to improving our understanding of the large-scale mechanisms that control or modulate the climate changes during recent geologic history.
2. Physiographic settings
The study area is the Zuli River Basin where the Zuli River is joined by the major branch (namely Guanchuan River) and then drains to the Yellow River. The studied section (i.e., Xiaogou section) is located on the river near the outlet of the basin (Fig. 1). The terrain of the study area is undulating with the elevations ranging from 1500 to 2000 m. The climate is characterized by cold and dry winters and warm and wet summers. The mean annual temperature is∼9 °C at the lowest (northern) end of the basin and gradually decreases to∼4 °C at the highest (southern) end. The mean annual precipitation is more than 500 mm in the southern end and gradually decreases northward to only 250 mm at the northern end. All of natural forests and most of natural shrubs have been cleared and the present vegetation is basically a mixture of the remnant natural and introduced grasses. The remaining natural herb component includes Stipa spp., Agropyron cristatum, Artemisia frigida and Thymus mongolicus, and the remaining natural shrub component mainly consists of Ajania fruticulosa, Lycium chinensis, Nitraria sibirica and Reaumuria soongarica. There are small patches of secondary forest (primarily Populus davidiana, Betula platyphylla, Pinus tabulaeformis, and Picea crassifolia) in the nearby mountains (e.g., Huajialing Ridge and Quwu Mountain) where the
Fig. 1. Map of the western part of Chinese Loess Plateau and location of the studied section (i.e., Xiaogou section) within the major trunk watershed of the Zulihe River Basin (dashed-line circled area).
available moisture is higher than the surrounding low-elevation loess terrains (Wu, 1980; Huang, 1997).
3. Laboratory methods and stratigraphy 3.1. Laboratory methods
The sampling interval was 6 cm for pollen analysis and 4 cm for grains-size and total organic carbon analyses. For pollen analysis of 711 samples, exotic Lycopodium tablets werefirst added for calculation of pollen concentration (Moore et al., 1991; Wang et al., 1995), and the samples were then treated with HCl (10%) and HF(39%). More than 300 pollen grains (excluding spores) were counted and identified for most samples. The raw pollen data are expressed as percentages of the sum of terrestrial pollen and are plotted against depth using Grapher 2.0 (Duane et al., 1990). The particle size of bulk samples was measured using a Malvern laser diffraction grain size analyzer and the total organic carbon (TOC) content was measured with titration methods (seeSinger and Janitzky, 1987).
3.2. Stratigraphy and chronology
The 40-m thick studied section (i.e., Xiaogou section) is a natural exposure of a lacustrine–fluvial–eolian sequence and the lacustrine– fluvial portion (4000–256 cm deep) was formed at the outlet of the basin between∼25,000 and ∼1450 14C yr BP under a completely
closed terminal lake when the Zuli River was dammed by a massive landslide, according to ourfield investigations. The eolian portion of
the section (256–0 cm deep) was formed during the past ∼1500 years (Fig. 2). We obtained 9 AMS14C dates on charcoal samples (Table 1)
that were measured at the NSF-AMS Facility at the University of Arizona (USA) and 10 conventional 14C dates of bulk organic-rich
samples (Table 2) that were measured at the MOE Key Laboratory of Lanzhou University (China). It should be particularly mentioned that four charcoal AMS14C dates from the top portion (0–1300 cm) seem to
be in a perfect order andfive bulk conventional14C dates from the
bottom portion (2600–4000 cm) are reasonably acceptable (Fig. 2). But, we were originally frustrated by thefive similar charcoal AMS14C
dates between 2100 and 2900 cm (i.e., open diamonds inFig. 2). The dates vary very little, ranging between∼9170 and ∼981014
C yr BP within the 8-m thick sediment (2100–2900 cm). We then dated five bulk organic-rich samples between 1600 and 2600 cm (filled diamonds inFig. 2) and again the dates refused to vary with depth,
Fig. 2. Diagram showing the stratigraphy and associated14
C dates of the Xiaogou lacustrine–fluvial–eolian section. Also included are photos of six representative segments, medium grain size data (μm) and14
C dates-based age-depth model.
Table 1
AMS14C dates of Xiaogou section
Lab no. Depth (cm) δ13C (‰) 14C age (yr BP)
AA64267 152–154 −20.0 803 ± 40 AA64268 674–675 −19.5 4033 ± 44 AA64270 1036–1037 −23.0 6412 ± 56 AA64272 1258–1259 −24.0 8039 ± 72 AA64275 2132–2133 −26.7 9171 ± 50 AA64276 2226–2228 −26.6 9292 ± 79 AA64277 2475–2478 −25.3 9393 ± 49 AA64278 2674–2676 −26.6 9210 ± 110 AA64279 2874–2876 −25.8 9807 ± 52
ranging between∼9780 and ∼11,26014C yr BP within the 10-m thick
sediment (1600–2600 cm). We thought of the possibility that the organic-rich sediments formed at∼10,00014C yr BP in the entire basin
or along the river banks might have been the source of the dated organic-rich sediments and the sediments between 1600 and 2900 cm were just reworked from the source sediments. However, our speculation was immediately rejected by the fact that the sediments between 1600 and 2900 cm are well-laminated (see photo at ∼2200 cm in Fig. 2) and regularly-interbedded (see photo at ∼2500 cm in Fig. 2). That is, it is naturally impossible that the organic-rich sediments formed at∼10,00014
C yr BP were impulsively re-transported from the source area(s) and rhythmically re-deposited in the closed terminal lake to form organic-rich and organic-poor alternating layers in this loess hilly area where upslope loess can be easily eroded and transported to the terminal lake. Our thought then went to the report that the atmosphericΔ14C instability at∼10,00014C
yr BP can result in large14C-date uncertainties (Kromer and Becker,
1992; Hughen et al., 1998; Wang and Jian, 1999). Whatever the reasons might be for the near-constant dates of the portion of the sediment (1600–2900 cm deep), our field investigation excluded the possibility that this portion (1300-cm thick) of sediment was suddenly deposited from an outburst of upstream lake or from megaflood erosion of previously-deposited organic-rich layer. Subsequently, we established an age-depth model by taking these four actual AMS 14C dates (solid line-indicated inFig. 2) at their face values for the upper portion (0–1300 cm) and by using the polynomial regression-produced model ages (dashed line-indicated inFig. 2) for the lower portion (1300– 4000 cm). The model is expressed as Age = 1E−06 (Depth)3−0.0053
(Depth)2+ 11.334(Depth). It should be noted that, although all of 19
dates participated in the age-depth model construction, thosefive AMS14C dates within the depths between 2100 and 2900 cm and also thosefive conventional14C dates within the depths between 1600 and
2600 cm were greatly discounted simply because they are so clustered. In other words, those clustered 10 dates statistically act like one or two dates in the polynomial regression model.
The section can be divided into six sediment units from the bottom to the top (Fig. 2).
Sediment Unit 1 (4000–3000 cm; ∼24,500 to ∼13,30014C yr BP)
consists of interbedded layers alternating between light-grey sandy silt and brown-grey silt. It has an average medium grain size of 23 µm and an average deposition rate of 0.09 cm/yr. The unit is interpreted to be afluvially-reworked loess-dominated lacustrine–fluvial complex formed under shallow-water conditions.
Sediment Unit 2 (3000–2000 cm; ∼13,300 to ∼947014C yr BP)
consists of four interbedded∼250 cm thick layers alternating between light-grey silt and brown-grey silty clay. It has an average grain size of 14 µm and an average deposition rate of 0.26 cm/yr. The unit is interpreted to be a lacustrine facies-dominated lacustrine-fluvial complex formed under deeper-water conditions.
Sediment Unit 3 (2000–1260 cm; ∼9470 to ∼8050 14
C yr BP) consists of eight interbedded thin layers (∼100 cm each) alternating between light-grey silt and brown-grey clayey silt. It has an average
grain size of 17 µm and an average deposition rate of 0.52 cm/yr. Unit 3 is also interpreted to be a lacustrine-dominated lacustrine-fluvial complex. However, there are two major differences from Sediment Unit 2. First, each of the interbedded layers is thinner in Unit 3 than in Unit 2. Second, the color is lighter and the average deposition rate is higher than that of the Unit 2, probably suggesting that the upstream erosion was increased either due to increased precipitation or due to decreased vegetation coverage.
Sediment Unit 4 (1260–780 cm; ∼8050 to ∼4730 14
C yr BP) consists of four interbedded layers (∼125 cm each) alternating between light-grey clayey silt and brown-grey or bluish silty clay. It has an average grain size of 15 µm and an average deposition rate of 0.14 cm/yr. It is our interpretation that the brown-grey or bluish silty clay layers were formed under deeper-water conditions (see Photo of 9–10 m in Fig. 2) and the light-grey clayey silt layers are fluvially-reworked loess layers formed under shallower-water conditions.
Sediment Unit 5 (780–256 cm; ∼4730 to ∼145014C yr BP) is
fluvially-reworked loess-dominated lacustrine–fluvial complex containing wet-land-facies lenses (e.g., at∼300 cm depth) and has an average grain size of 18 µm and an average deposition rate of 0.16 cm/yr.
Sediment Unit 6 (256–0 cm; ∼1450 to ∼014C yr BP) is a massive loess
unit with an average grain size of 16 µm and an average deposition rate of 0.18 cm/yr.
4. Pollen data and interpretation
4.1. A brief review of modern pollen assemblages
A survey of modern pollen assemblages within the study area is limited in their ability to interpret fossil pollen records simply because the natural vegetation has been severely disturbed. Therefore, our interpretation of the fossil pollen records has to rely on the modern pollen-vegetation studies from other areas in China where human disturbance is minimal. The pollen spectra of a temperate deciduous forest are dominated by deciduous arboreal taxa including Quercus, Betula, Alnus, Acer, Ulmus, and Populus (9.0–50.0%) and also by Pinus (5.9–54.6%), accompanied by Artemisia (3.9–58.8%), Gramineae (1.1– 10.0%) and Chenopodiaceae (1.0–11.5%) (Wang et al., 1996; Zhao et al., 1998; Xu et al., 2000, 2007). It should be noted that Ulmus is normally under-represented and Quercus is proportionately represented in the modern pollen spectra of temperate deciduous forest (Zhao et al., 1998; Li et al., 2000; Ma et al., 2004; Xu et al., 2007). In a temperate steppe forest, the pollen spectra are co-dominated by the herb com-ponent (20.0–80.0%) and the arboreal component (15.0–40.0%). The arboreal component includes Pinus (5.1–42.2%), Quercus (1.1–11.9%) and Betula (0.6–17.0%), and the herb component includes Artemisia (20.8–50.6%), Chenopodiaceae (6–15.0%), and Gramineae (2.1–8.6%) (Liu et al., 1999; Ma, 2004; Xu et al., 2007; Ma et al., 2008).
The modern pollen spectra of temperate steppe are absolutely dominated by the herb component (62.0–93.0%) with a minor Pinus-dominated arboreal component (7.0–28.0%). The herb component includes Artemisia (36.5–80.0%), other Compositae (10–20%), Cheno-podiaceae (14.9–46.6%), and Gramineae (2.2–10.0%) (Li, 1998; Liu et al., 1999). High percentages of Artemisia (20.6–55.8%) and Cheno-podiaceae (23.1–48.6%) fairly represent the dominance of these two herbaceous taxa in a temperate desert steppe where Stipa (Grami-neae) is normally under-represented (Yan and Xu, 1989; Li, 1998).
Finally, we want to discuss the pollen representation of coniferous trees (e.g., Pinus and Picea). Pinus pollen is normally over-represented and even up to 30% of its pollen can not be interpreted as a reflection of local presence of a forest or a forest-steppe if other tree taxa are lacking (Li, 1998; Ma et al., 2004). However, published data show that Picea pollen has a more realistic representation than Pinus pollen because the former (Picea pollen) is less suitable for long-distance wind transport. It is subsequently demonstrated that a relatively high percentage of Picea pollen in a terminal lake sediments of any arid or Table 2
Conventional14C dates of Xiaogou section
Lab no. Depth(cm) 14C age(yr BP)
LUG06-45 1426–1428 10,870 ± 98 LUG06-46 1636–1639 9782 ± 118 LUG06-47 1992–1996 10,487 ± 123 LUG06-48 2132–2136 9572 ± 129 LUG06-49 2360–2364 11,981 ± 157 LUG06-50 2628–2632 11,259 ± 107 LUG06-51 2924–2928 13,501 ± 162 LUG06-100 3260–3272 19,421 ± 191 LUG06-101 3720–3732 22,811 ± 246 LUG06-102 3990–4000 23,243 ± 272
semiarid basin indicates that the coniferous pollen grains were fluvially transported from the montane coniferous forests within the basin (Li, 1998; Zhu et al., 2001a,b; Xu et al., 2004).
4.2. Pollen data and interpretation
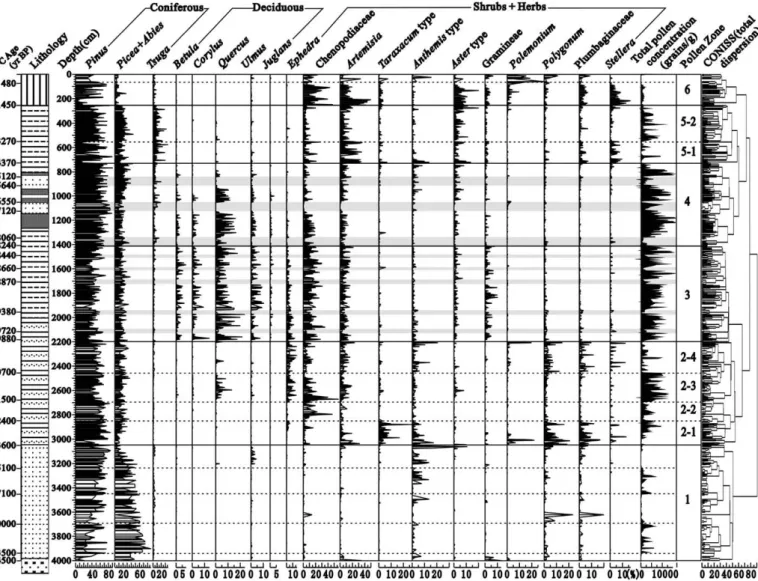
As shown inFig. 3, the pollen spectra are dominated by Pinus, and the average percentage of the coniferous component reaches 70.6%. The Quercus-dominated deciduous component reaches only 7.1% and the total shrub percentage (including Ephedra, Rosaceae, Nitraria, Elaeagnus, Leguminasae and others) is even lower. The herb com-ponent retains its secondary representation (after the conifers) throughout the section except for Sediment Unit 6 in which the herbs share dominance with the conifers. The herbs include Cheno-podiaceae, Artemisia, Aster-type, Taraxacum-type, Anthemis-type, Gramineae, Polemonium, Polygonum, Plumbaginaceae and Stellera.
Six climate phases were reconstructed based on six pollen assemblage zones (PZs) which were recognized by visual inspection and CONISS analysis (Grimm, 1987).
PZ 1 (4000–3045 cm; ∼24,500 to ∼13,60014C yr BP) corresponds to
the Sediment Unit 1 (4000–3000 cm), and the pollen assemblage is absolutely dominated by the coniferous component (mean = 91%). It is noticeable that Picea shares the dominance with Pinus in this zone with an upward increasing trend of Pinus and a corresponding decreasing trend of Picea. This zone has merely detectable deciduous
and shrubs with a very low percentage of herbs and with a low pollen concentration (mean = 893 grains/g), suggesting that a desert steppe occupied the landscape within the basin. The higher Picea percentage relative to Pinus percentage in this zone in comparison with other zones seems to suggest that coniferous tree patches might have developed in upper-stream higher-elevation areas. The climate was generally cold and dry.
PZ 2 (3045–2180 cm; ∼13,600 to ∼988014C yr BP) approximately
corresponds to Sediment Unit 2 (3000–2000 cm). The pollen assemblage is characterized by a sudden appearance of some herbs and shrubs (e.g., Ephedra, Chenopodiaceae, Artemisia and Taraxacum-type) and also by considerable increases of some other herbs and shrubs (e.g., Polygonum, Plumbaginaceae, and Stellera). It is noticeable that the pollen concentration increased remarkably with notable fluctuations. This zone can be divided into four sub-zones.
Sub-zone 2-1 (3045–2844 cm; ∼13,600 to ∼12,40014C yr BP) is
typified by a sudden increase in herbs (including Polygonum, Plumbaginaceae, Artemisia, Taraxacum-type, Anthemis-type and Stel-lera) at the expense of the coniferous component and also by the absence of the deciduous component. It is noticeable that the pollen concentration increased (mean = 1831 gains/g) relative to the PZ 1 and that the coniferous component retains its dominance. This pollen assemblage and the relatively high pollen concentration reflect the replacement of the former desert steppe (PZ 1) by steppe under ameliorated climatic conditions in the basin and the coniferous tree
patches in the higher-elevations. The decline of Picea may suggest a milder climate, and the sudden increases in herb component and the increased pollen concentration may indicate a wetter climate.
Sub-zone 2-2 (2844–2678 cm; ∼12,400 to ∼11,500 14C yr BP) is
marked by a sharp increase in Chenopodiaceae (up to 20%) at the expenses of other herbs. Although the pollen concentration remains the same as that in Sub-zone 2-1, the climate seems to have deteriorated as indicated by (1) a sharp increase in Chenopodiaceae, (2) an observable decrease in total herb pollen percentage, and (3) a decrease in the diversity of the detected species. This pollen assemblage is interpreted to represent a Chenopodiaceae-dominated steppe or even a Chenopodiaceae-dominated desert steppe. The climate again changed to cold and dry, probably being only slightly milder and wetter than that during PZ 1.
Sub-zone 2-3 (2678–2447 cm; ∼11,500 to ∼10,70014C yr BP) has a
greater diversity of herb species than Sub-zone 2-2. The considerable increases in Quercus, Ephedra and Artemisia and the corresponding drastic increase in pollen concentration (mean = 5837 grains/g) make this sub-zone outstanding among all of sub-zones in PZ 2. This pollen assemblage is interpreted to represent a Quercus-dominated woodland steppe under a milder and wetter climate. The drastically increased coniferous pollen concentration suggests that the coniferous forests or tree patches also expanded in higher-elevation areas.
Sub-zone 2-4 (2447–2180 cm; ∼10,700 to ∼988014C yr BP) is similar
to the Sub-zone 2-1 in the composition of the herb component except that Chenopodiaceae and Ephedra pollen percentages are higher. Two other distinguishable features are the dramatic decrease in the pollen concentration and the nearly completely disappearance of Quercus. It seems that the woodland steppe (i.e., Sub-zone 2-3) deteriorated to a dry steppe under a colder and drier climate. The coniferous forests or tree patches in higher-elevation areas also shrank in response to the deteriorated climate.
PZ 3 (2180–1408 cm; ∼9880 to ∼824014C yr BP), approximately
corresponding to Sediment Unit 3 (2000–1260 cm), is unequivocally characterized by a persistently high Quercus pollen percentage and also by a continuous appearance of pollen of other deciduous trees (e.g., Betula, Corylus, Ulmus and Juglans) at the expense of the coniferous component. The pollen concentrationfluctuates dramati-cally between∼200 and ∼15,000 grains/g with a relatively high mean (∼5000 grains/g). The dramatic increase in the deciduous component and the extremely high pollen concentration are interpreted to represent a forest–steppe vegetation under a warm and wet climate. It is also noticeable that Aster types and Gramineae pollen percentages are considerably higher than those in the PZ 2 and that Chenopodia-ceae and Artemisia pollen percentages are also higher than those in the PZ 2. The increase in the herb component (e.g., Gramineae, Aster types, Chenopodiaceae and Artemisia) may indicate that the studied site was within the northern (i.e., drier) portion of a forest steppe. It is also noted that there arefive intervals when both the pollen concen-tration and the percentage of deciduous component drop consider-ably, suggestingfive cool and dry spells. These five cool and dry spells occurred at∼9760 to ∼967014C yr BP (2130–2090 cm), ∼9430 to
∼933014C yr BP (1981–1934 cm), ∼8920 to ∼882014C yr BP (1727–
1680 cm), ∼8700 to ∼8620 14C yr BP (1617–1580 cm), ∼8470 to
∼840014C yr BP (1507–1475 cm).
PZ 4 (1408–725 cm; ∼8240 to ∼437014C yr BP), approximately
corresponding to the Sediment Unit 4 (1260–780 cm), is typified by an upward increasing trend of the coniferous component and a corresponding decreasing trend of the deciduous component. Shrubs (e.g., Ephedra) and some herbs (e.g., Chenopodiaceae, Artemisia and Gramineae) are also considerably reduced in comparison with those in the PZ 3. Again, like in the PZ 3, the pollen concentrationfluctuates dramatically between∼100 and ∼16,000 grains/g with a relatively high mean (∼5000 grains/g). The assemblage is also interpreted to represent a forest steppe. However, the increase in the coniferous component and the corresponding decreases in other components
(deciduous, shrubs and herbs) relative to PZ 3 seem to suggest that the temperature was reduced and the available moisture might thus be elevated. The data indicate that there were three intervals when both the pollen concentration and the percentage of deciduous component dropped drastically, suggesting three cool and dry spells that occurred at∼8240 to ∼806014C yr BP (1408
–1333 cm), ∼7120 to ∼655014C yr
BP (1133–1055 cm), and ∼5640 to ∼512014C yr BP (918–840 cm).
PZ 5 (725–256 cm; ∼4370 to ∼1450 14C yr BP), approximately
corresponding to the Sediment Unit 5 (780–256 cm), is characterized by a dramatic decrease in the pollen concentration and nearly com-pletely disappearance of the deciduous component, accompanied by a slight increase in herb component. Apparently, the previous forest steppe (i.e., PZ 4) had deteriorated to a steppe under a cold and dry climate. The fact that Picea / Abies and Tsuga pollen percentages increase considerably seems to suggest an expansion of coniferous forests or tree patches in high-elevation areas. According to the secondary variation of pollen concentration and herbs composition, two sub-zones are recognized: Sub-zone 5-1 and Sub-zone 5-2.
Sub-zone 5-1 (725–550 cm; ∼4370 to ∼327014C yr BP) is typi
fied by a dramatically reduced pollen concentration (mean = 1009 grains/g) and by a significantly increased herb component (including Cheno-podiaceae, Artemisia, Plumbaginaceae, and Stellera), suggesting that a relatively cold and dry climate prevailed.
Sub-zone 5-2 (550–256 cm; ∼3270 to ∼1450 14C yr BP) is
characterized by an increase in the coniferous component (mainly Pi-nus, Picea, Abies, Tsuga) and also by an increase in total pollen con-centration (mean = 2219 grains/g), probably suggesting an improved moisture condition relative to Sub-zone 5-1.
PZ 6 (256–0 cm; ∼1450 to ∼014C yr BP), exactly corresponding
to the eolian portion of the sequence (Sediment Unit 6), is charac-terized by a significant increase in the herb component (including Chenopodiaceae, Artemisia, Taraxacum-type, Aster-type, Gramineae, Polemonium, Polygonum, Plumbaginaceae and Stellera) at the expense of the coniferous component (including Pinus, Picea, Abies, Tsuga) and also by an extremely low pollen concentration (mean = 635 gains/g) with the continued absence of the deciduous component. Although the biodiversity of the detected species of herbs is rather high in this zone, the extremely low pollen concentration suggests that the previous steppe vegetation (PZ 5) had further deteriorated and the studied site was probably within the northern (drier) portion of a steppe. The further deterioration of the vegetation since ∼48014C yr BP is most likely a result of severe
human disturbances.
5. Discussion and conclusions 5.1. MIS 2
The period between∼24,500 and ∼13,60014C yr BP, represented
by PZ 1, is characterized by the following four features: (1) lowest pollen concentration (∼900 gains/g); (2) the highest percentage of coniferous component (mean = 91%); (3) the coarsest particle size of the sediments (mean = 23μm), and (4) a rather low TOC content in the entire section (Fig. 4). It means that the vegetation coverage was low in a desert steppe under a cold and dry climate. The reconstructed desert steppe vegetation further deteriorated twice during this period. Thefirst deterioration occurred between ∼20,000 and ∼17,10014C
yr BP, and the second deterioration between∼15,100 and ∼13,60014C
yr BP. Considering the uncertainties in14C dates, these two
deteriora-tions mostly likely correspond to the North Atlantic-documented (McManus et al., 1994) and Chinese Hulu cave stalagmite-corrobo-rated (Wang et al., 2001) Heinrich events H2 (∼21,000 14C yr BP)
and H1 (∼14,30014C yr BP). These findings (H2 and H1) are well
collaborated by the pollen record from nearby Jingning lacustrine– wetland–eolian sequence (i.e., Suancigou section) (Li et al., 2006; Feng et al., 2007).
5.2. Late glacial
The Late glacial, the period between∼13,600 and ∼988014C yr BP,
can be divided into four sub-stages that correspond chronologically to the European deglacial sub-stages. Our data provide much more details of the late glacial climatic changes than the previous reports from the Chinese Loess Plateau (Zhou et al., 1996, 1999; Sun et al., 2007). Furthermore, our data may significantly improve our under-standing of the teleconnections between East-Asian monsoon varia-tions and the European deglacial events.
First sub-stage (Pollen Sub-zone 2-1:∼13,600 to ∼12,40014C yr BP)
was a period when a steppe replaced the desert steppe of PZ 1 under milder and wetter conditions. The corresponding grain size is considerably finer and the TOC content is observably higher (see Fig. 4). This sub-stage corresponds with the European Bølling warm period (∼13,000 to ∼12,00014C yr BP).
Second sub-stage (Pollen Sub-zone 2-2:∼12,400 to ∼11,50014C yr BP)
shows a deterioration from steppe to a Chenopodiaceae-dominated steppe or even a desert steppe. Both the grain size (coarser) and the TOC content (lower) support the pollen-based interpretation. This cold and dry period corresponds with the European Older Dryas cold period (∼12,000 to ∼11,80014C yr BP).
Third sub-stage (Pollen Sub-zone 2-3:∼11,500 to ∼10,70014
C yr BP) is interpreted to represent a period when a Quercus-dominated woodland vegetation occupied the landscape under a milder and
wetter climate. Again, the grain size (finer) and the TOC content (higher) support the pollen-based interpretation (seeFig. 4). This sub-stage corresponds with the European Allerød warm period (∼11,800 to ∼11,00014
C yr BP).
Fourth Sub-stage (Pollen Sub-zone 2-4:∼10,700 to ∼988014C yr BP)
shows a deterioration to a Chenopodiaceae-dominated and Ephedra-accompanied steppe (probably even to a desert steppe) under a cold and dry climate. The extremely low TOC content and near-MIS2 level of pollen concentration confirm the pollen-based vegetation-climatic interpretation that this sub-stage corresponds with the European Younger Dryas cold period (∼11,000 to ∼10,00014C yr BP).
5.3. Holocene
5.3.1. Early and Middle Holocene
Palynologically speaking, the early and middle Holocene is repre-sented by two pollen zones: PZ 3 (∼9880 to ∼824014C yr BP) and PZ 4
(∼8240 to ∼437014C yr BP). Both zones share following two features:
(1) dramaticfluctuations in the pollen concentration (between ∼100 and∼16,000 grains/g) with a high mean (∼5000 grains/g), and (2) a much higher percentage of the deciduous component (including Quer-cus, Betula, Corylus, Ulmus and Juglans) than the preceding (i.e., late glacial stage) and following (i.e., late Holocene) periods. Two major differences between these two pollen zones are (1) considerably higher pollen percentages of some herbs (Gramineae, Chenopodiaceae, and Fig. 4. Pollen assemblage variations of Xiaogou section and their comparison with medium grain size data (μm) and total organic carbon (TOC) (%).
Artemisia) in PZ 3 than in PZ 4, and (2) lower values for the deciduous component in PZ 4 relative to PZ 3. The pollen assemblages (PZ 3 and PZ 4) suggest that the early and middle Holocene (∼9880 to ∼437014C
yr BP) was a period when forest–steppe vegetation dominated the landscape of the study area under a warm and wet climate. During this period of∼5500 years, eight cold and dry spells (i.e., E1–E8 inFig. 4) were documented by drastically reduced pollen concentrations and dramatically lowered percentages in the deciduous component, and they are further confirmed by corresponding increases in grain size and decreases in TOC (seeFig. 4). They are interpreted to represent eight cool and dry spells that caused rapid vegetation deteriorations. These eight cool and dry spells occurred at∼972014
C yr BP (E1),∼938014
C yr BP (E2),∼887014C yr BP (E3),∼866014C yr BP (E4),∼844014C yr BP (E5),
∼8240 to ∼806014C yr BP (E6),∼7120 to ∼655014C yr BP (E7), and
∼5640 to ∼512014C yr BP (E8).
The interpretation of the early and middle Holocene vegetation-climatic history documented at Xiaogou section is generally supported by our previous studies at Sujiawan section (near Dingxi, seeFig. 1) and Dadiwan section (DDW in Qin'an) (seeFeng et al., 2004, 2006). The pollen data from these two sections (Dingxi and Qin'an) show that a forest–steppe dominated from 8850 to 7540 14C yr BP and a
temperate deciduous forest occurred from 7540 to 579014C yr BP. The vegetation then deteriorated to a forest–steppe (5790–412014C yr BP)
that further deteriorated to a steppe. It should be noted that our previous studies did not show the Xiaogou section-documented eight cool and dry spells (i.e., E1–E8 inFig. 4) probably because of much lower sample resolution. But, comparison between Xiaogou section and Dadiwan section suggests that the Dadiwan-documented four majorflooding events (∼7090, ∼6560, ∼5790, and ∼523014C yr BP)
occurred between the Xiaogou-documented cool/dry spells E7 (∼7120 to∼655014C yr BP) and E8 (∼5640 to ∼512014C yr BP), implying that
flooding occurred more frequently or/and more intensively in the warmer and wetter period (between∼7120 and ∼512014C yr BP).
5.3.2. Late Holocene
A dramatic reduction in pollen concentration and a significant increase in the herb component between∼4370 to ∼327014C yr BP
indicate a drastic deterioration of vegetation (from a forest-steppe to a steppe) under a cool and dry climate. The following period (∼3270 to ∼1450 14C yr BP) experienced improved moisture conditions as
indicated by the increased pollen concentration and the accompany-ing increase in Picea. The past∼1500 years (after ∼145014C yr BP)
have been characterized by a significantly higher herb component relative to the preceding period (∼3270 to ∼145014C yr BP). Although
the diversity of the detected species of herbs is rather high, the extremely low pollen concentration seems to suggest that the steppe vegetation of the preceding period has deteriorated since∼1500 yr BP. The notable further deterioration of the vegetation since∼48014
C yr BP is most likely a result of human disturbances. It should be particularly noted that Xiaogou section did not record the three paleosol–loess cycles documented at nearby Sujiawan section. Those three cycles are (seeFeng et al., 2004, 2006): (1) S3paleosol (∼3560 to
∼312014C yr BP) and loess unit 3 (∼3120 to ∼290014C yr BP), (2) S 2
paleosol (∼2900 to ∼246014C yr BP) and loess unit 2 (∼2460 to
∼202014C yr BP), and (3) S
1paleosol (∼2020 to ∼100014C yr BP) and
loess unit 1 (after∼100014C yr BP).
In conclusion, the pollen data have demonstrated that the general patterns of climatic changes in the western part of the Chinese Loess Plateau are consistent with those reported from the North Atlantic region (Bradley, 1999, Ruddiman, 2008), implying that the climatic change of the study area has been primarily driven by large-scale forcing factors. Specifically, a desert steppe dominated the landscape under a cold and dry climate between∼24,500 and ∼13,60014C yr BP.
The pollen-documented two episodes of further deterioration of vegetation between ∼20,000 and ∼17,10014C yr BP and between
∼15,100 and ∼13,60014C yr BP are likely to correspond with the North
Atlantic Heinrich event 2 (∼21,00014C yr BP) and event 1 (∼14,30014C
yr BP). Four climatic sub-stages that occurred during the late glacial (∼13,600 and ∼988014C yr BP) are chronologically and
climatologi-cally correlated with the European deglacial (i.e., last termination) sub-stages (i.e., Bølling warm period, Older Dryas cold period, Allerød warm period, and Younger Dryas cold period). The pollen assemblages support our earlier conclusion (Feng et al., 2004, 2006) that the early and middle Holocene (∼10,000 to ∼400014C yr BP) was a period when
forest–steppe vegetation dominated the landscape of the study area under a warm and wet climate and that the post-optimal conditions (steppe dominance) were established at∼4000 yr BP.
It should be particularly noted that our pollen data documented as many as eight cold and dry spells during the early and middle Holocene (∼10,000 to ∼4000 14C yr BP) when the climate was
generally warm and wet and that three loess–paleosol couplets at nearby Sujiawan section documented three climatic cycles during the late Holocene (past 4000 years) when the climate was generally cold and dry (seeFeng et al., 2004, 2006), suggesting that the Holocene climate has been extremely unstable in the western part of the Chinese Loess Plateau.
Acknowledgements
This paper is a result of projects supported by three Chinese NSF grants (No: 40331012, 40671190, 40421101) and three U.S. NSF grants (NSF-ESH-04-02509, NSF-BCS-06-52304, NSF-BCS-00-78557). Thanks to Dr. WANG Haibin, Dr. WU Jing, Dr. CUI Qiaoyu, Mr. ZHENG Peng and Mr. GAO Weidong for their help infield work. Two anonymous reviewers are sincerely thanked for their constructive comments. References
An, Z.S., Porter, S.C., Kutzbach, J.E., Wu, X., Wang, S., Liu, X., Li, X., Zhou, W., 2000. Asynchronous Holocene optimum of the east Asia monsoon. Quaternary Science Reviews 19, 743–762.
Bond, G., Showers, W., Cheseby, M., Lotti, R., Almasi, P., deMenocal, P., Priore, P., Cullen, H., Hajdas, I., Bonani, G., 1997. A pervasive millennial-scale cycle in north Atlantic Holocene and glacial climates. Science 278, 1257–1285.
Bond, G., Kromer, B., Beer, J., Muscheler, R., Evans, M.N., Showers, W., Hoffmann, S., Lotti-Bond, R., Hajdas, I., Bonani, G., 2001. Persistent solar influence on north Atlantic Holocene and glacial climates. Science 294, 2130–2136.
Bradley, R., 1999. Paleoclimatology: Reconstructing Climate of the Quaternary. Academic Press.
Bridgman, B.H., Oliver, J.E., 2006. The Global Climate System: Patterns, Processes, and Teleconnections. Cambridge University Press, New York.
CLIMAP Members, 1981. Seasonal reconstruction of the Earth's surface at the Last Glacial Maximum. GSA Map and Chart Series, MC-36.
COHMAP Members, 1988. Climatic changes of the last 18,000 years: observation and modeling. Science 241, 1043–1052.
Duane, A.B., Janice, E.C., Craig, P.L., 1990. ParaGraph: graph editor support for parallel programming environments. International Journal of Parallel Programming 19 (2), 75–110.
Feng, Z.-D., An, C.B., Tang, L.Y., Jull, A.J.T., 2004. Stratigraphic evidence of megahumid mid-Holocene climate in the western part of the Chinese Loess Plateau. Global and Planetary Changes 43, 145–155.
Feng, Z.-D., Tang, L.Y., Wang, H.B., Ma, Y.Z., Liu, K.-b., 2006. Holocene vegetation variations and the associated environmental changes in the western part of the Chinese Loess Plateau. Palaeogeography Palaeoclimatology Palaeoecology 241, 440–456.
Feng, Z.-D., Tang, L.Y., Ma, Y.Z., Zhai, Z.X., Wu, H.N., Li, F., Zou, S.B., Yang, Q.L., Wang, W.G., Derbyshire, E., Liu, K.-B., 2007. Vegetation variations and associated environmental changes during marine isotope stage 3 in the western part of the Chinese Loess Plateau. Palaeogeography Palaeoclimatology Palaeoecology 246, 278–291. Grimm, E.C., 1987. CONISS: A Fortran 77 program for stratigraphically constrained
cluster analysis by the method of incremental sum of squares. Computer and Geosciences 13, 13–25.
Huang, D.S., 1997. Gansu Vegetation. Gansu Science and Technology Press, Lanzhou. (in Chinese).
Hughen, K.A., Overpeck, J.T., Lehman, S.J., Kashgarian, M., Southon, J., Peterson, L.C., Alley, R., Sigman, D.M., 1998. Deglacial changes in ocean circulation from an extended radiocarbon calibration. Nature 391, 65–68.
Kromer, B., Becker, B., 1992. Tree-ring14
C calibration at 10,000 B.P. In: Bard, E., Broeckcr, W.S. (Eds.), The Last Deglaciation: Absolute and Radiocarbon Chronologies. NATO ASI Series, vol. 2. Springer-Verlag, New York, pp. 3–12.
Li, W.Y., 1998. Quaternary Vegetation and environment of China. Science Press, Beijing. (in Chinese).
Li, Y.Y., Zhang, X.S., Zhou, G.S., Ni, J., 2000. Quantitative relationships between vegetation and several pollen taxa in surface soil from North China. Chinese Science Bulletin 45 (16), 1519–1523.
Li, X.Q., Zhou, W.J., An, Z.S., Dodson, J., 2003. The vegetation and monsoon variations at the desert loess transition belt at Midiwan in northern China for the last 13 ka. The Holocene 13 (5), 779–784.
Li, C.H., Tang, L.Y., Feng, Z.D., Wang, W.G., An, C.B., Zhang, H.C., 2006. A high-resolution late Pleistocene record of pollen vegetation and climate change from Jingning, NW China. Science in China Series(D) 49 (2), 154–162.
Liu, H.Y., Cui, H.T., Pott, R., 1999. The surface pollen of the woodland-steppe ecotone in southeastern Inner Mongolia. Review of Palaeobotany and Palynology 105, 237–250.
Ma, Y.Z., 2004. Late Cenozoic vegetation history and associated environmental changes in Northeastern margin of the Tibet Plateau. Ph.D. Dissertation, Lanzhou University (in Chinese).
Ma, Y.Z., Zhang, H.C., Pachur, H.J., Wunnemann, B., Li, J.J., Feng, Z.-D., 2004. Modern Pollen-inferred Holocene climate change in the Tengger Desert, NW China. The Holocene 14 (6), 841–850.
Ma, Y.Z., Liu, K.-B., Feng, Z.-D., Sang, Y.L., Wang, W., Sun, A.Z., 2008. A survey of modern pollen and vegetation along a south–north transect in Mongolia. Journal of Biogeography 35, 1512–1532.
McManus, J.F., Bond, G.C., Broecker, W.S., 1994. High resolution climate records from the Atlantic during the last interglacial. Nature 371, 326–329.
Moore, P.H., Webb, J.A., Collinson, M.E., 1991. Pollen Analysis (2nd). Blackwell Scientific Publications, London.
Oppo, D.W., McManus, J.E., Cullen, J.L., 2003. Deepwater variability in the Holocene epoch. Nature 422, 277–278.
Ruddiman, W.F., 2008. Earth's Climate: Past and Future (2nd). W.H. Freeman and Company, New York.
Singer, M., Janitzky, P., 1987. Field and Laboratory Procedures Used in Soil Chronose-quence Study. U.S.G.S. Bulletin, p. 1648.
Sun, X.J., Song, C.Q., Wang, B.Y., Sun, M.R., 1995. Vegetation history of the southern Loess Plateau of China during the last 100,000 years based on pollen data of loess Section in Weinan, Shannxi. Chinese Science Bulletin 40 (13), 1222–1224 (in Chinese). Sun, A.Z., Ma, Y.Z., Feng, Z.-D., Li, F., Wu, H.N., 2007. Pollen-recorded climate changes
between 13.0 and 7.014
C ka BP in southern Ningxia, China. Chinese Science Bulletin 52 (8), 1080–1088.
Wang, P.X., Jian, Z.M., 1999. Searching high-resolution paleoenvironmental records: A Review. Quaternary Sciences 1, 1–17 (in Chinese).
Wang, F.X., Qian, N.F., Zhang, Y.L., Yang, H.Q., 1995. Pollen Flora of China. Science Press, Beijing. (in Chinese).
Wang, B.Y., Song, C.Q., Sun, X.J., 1996. Study on surface pollen in middle Inner Mongolia, China. Acta botanica Sinica 38 (11), 902–909 (in Chinese).
Wang, Y.J., Cheng, H., Edwards, R.L., An, Z.S., Wu, J.Y., Shen, C.C., Dorale, J.A., 2001. A high-resolution absolute-dated late Pleistocene Monsoon record from Hulu Cave, China. Science 294, 2345–2348.
Wang, Y.J., Cheng, H., Edwards, R.L., He, Y.Q., Kong, X.G., An, Z.S., Wu, J.Y., Kelly, M.J., Dykoski, C.A., Li, X.D., 2005. The Holocene Asian monsoon: Links to solar changes and north Atlantic climate. Science 308, 854–857.
Wu, Z.Y., 1980. China Vegetation. Science Press, Beijing. (in Chinese).
Xu, Q.H., Yang, X.L., Liang, W.D., 2000. Study of pollen dispersing processes in Yanshan area of Hebei Province of China. Geography and Land Resource 16, 54–62 (in Chinese).
Xu, Q.H., Yang, X.L., Yang, Z.J., 2004. Relationship between pollen assemblages and vegetation in alluvial sediments of Luanhe River Basin. Journal of Palaeogeography 6 (1), 69–76 (in Chinese).
Xu, Q.H., Li, Y.C., Yang, X.L., Zheng, Z.H., 2007. Quantitative relationship between pollen and vegetation in northern China. Science in China Series (D) 50 (4), 582–599. Yan, S., Xu, Y.Q., 1989. Surface pollen assemblages in Xinjiang Altay of China. Journal of
Arid Land Research 1, 26–33 (in Chinese).
Zhao, J.B., Yue, Y.L., Yue, M., 1998. Pollen assemblages of Quercus forests in the Qinling Mountains and in the Chinese Loess Plateau. Journal of Xi'an Institute of Engeneering Technology 20 (1), 46–50 (in Chinese).
Zhou, W.J., Donahue, D.J., Porter, S.C., Jull, T.A., Li, X.Q., Stuiver, M., An, Z.S., Matsumoto, E., Dong, G.R., 1996. Variability of monsoon climate in East Asia at the end of the last glaciation. Quaternary research 46, 219–229.
Zhou, W.J., Head, M.L., Lu, X.F., 1999. Teleconnection of climatic events between East Asia and polar high latitude areas during the last deglaciation. Palaeogeography Palaeoclimatology Palaeoecology 152, 163–172.
Zhu, Y., Chen, F.H., Feng, Z.D., 2001a. A reconstruct model of palaeoecological conditions by pollen assemblage at the end of Shiyang river (an internal system), an arid area, Gansu province. Acta Palaeontologica Sinica 40 (2), 269–275 (in Chinese). Zhu, Y., Chen, F.H., Zhang, J.W., An, C.B., 2001b. Effects of depositional environment on
pollen assemblages— a case study in the Shiyang River Basin. Acta Sedimentologica Sinica 19 (2), 186–191 (in Chinese).