Effect of
Lactobacillus rhamnosus CGMCC1.3724 supplementation
on weight loss and maintenance in obese men and women
Marina Sanchez
1, Christian Darimont
2, Vicky Drapeau
3, Shahram Emady-Azar
4, Melissa Lepage
5,
Enea Rezzonico
2, Catherine Ngom-Bru
5, Bernard Berger
2, Lionel Philippe
4, Corinne Ammon-Zuffrey
2,
Patricia Leone
2, Genevieve Chevrier
6, Emmanuelle St-Amand
6, Andre´ Marette
6, Jean Dore´
1and Angelo Tremblay
1*
1Department of Kinesiology, Faculty of Medicine, Laval University, Quebec, QC, Canada G1V 0A6
2Nutrition and Health Research Department, Nestle´ Research Center, Lausanne, Switzerland
3Department of Physical Education, Faculty of Educational Sciences, Laval University, Quebec, QC, Canada G1V 0A6
4Clinical Development Unit, Nestle´ Research Center, Lausanne, Switzerland
5Analytical Sciences Department, Nestle´ Research Center, Lausanne, Switzerland
6Research Center of the Institut universitaire de cardiologie et de pneumologie de Que´bec, Quebec, QC, Canada G1V 4G5
(Submitted 11 July 2013 – Final revision received 1 October 2013 – Accepted 23 October 2013 – First published online 3 December 2013)
Abstract
The present study investigated the impact of a Lactobacillus rhamnosus CGMCC1.3724 (LPR) supplementation on weight loss and main-tenance in obese men and women over 24 weeks. In a double-blind, placebo-controlled, randomised trial, each subject consumed two capsules per d of either a placebo or a LPR formulation (1·6 £ 108colony-forming units of LPR/capsule with oligofructose and inulin). Each group was submitted to moderate energy restriction for the first 12 weeks followed by 12 weeks of weight maintenance. Body weight and composition were measured at baseline, at week 12 and at week 24. The intention-to-treat analysis showed that after the first 12 weeks and after 24 weeks, mean weight loss was not significantly different between the LPR and placebo groups when all the sub-jects were considered. However, a significant treatment £ sex interaction was observed. The mean weight loss in women in the LPR group was significantly higher than that in women in the placebo group (P¼ 0·02) after the first 12 weeks, whereas it was similar in men in the two groups (P¼ 0·53). Women in the LPR group continued to lose body weight and fat mass during the weight-maintenance period, whereas opposite changes were observed in the placebo group. Changes in body weight and fat mass during the weight-maintenance period were similar in men in both the groups. LPR-induced weight loss in women was associated not only with significant reductions in fat mass and circulating leptin concentrations but also with the relative abundance of bacteria of the Lachnospiraceae family in faeces. The present study shows that the Lactobacillus rhamnosus CGMCC1.3724 formulation helps obese women to achieve sustainable weight loss.
Key words:Energy restriction: Probiotics: Body composition: Microbiota
The increase in the prevalence of obesity observed over the last few decades has favoured the numerous investigations that have contributed to better understand the effects of a modern lifestyle on energy balance, body composition and metabolic health. Among the studied potential determinants of obesity, the intestinal microbiota has been proposed to have an impact on energy balance in both animals and humans(1,2).
Microbiota may be perceived as an ‘organ’ that contributes to the metabolism and plays a role in energy storage. The human gut microbiota is composed of trillions of bacteria belonging mainly to two bacterial divisions: Firmicutes and
Bacteroidetes. Although the diet has an impact on the com-position of the gut microbiota(3 – 5), these bacteria have been proposed to participate in the development of obesity and diabetes(6 – 8). Animal studies have shown differences in gut microbiota composition associated with obesity(9). Lean mice have a higher relative abundance of Bacteroidetes and a lower abundance of Firmicutes when compared with obese rodents(9). Inoculation of the gut microbiota of obese mice into axenic mice has been shown to induce a significant fat mass gain when compared with that of the gut microbiota of lean animals into mice(10). These data suggest, at least in mice, a potential role for gut microbiota in the development
* Corresponding author: A. Tremblay, fax þ 1 418 656 2441, email [email protected] Abbreviations: cfu, colony-forming units; LPR, Lactobacillus rhamnosus CGMCC1.3724.
British Journal of Nutrition (2014), 111, 1507–1519 doi:10.1017/S0007114513003875
qThe Authors 2013
British
Journal
of
Nutrition
https:/www.cambridge.org/core/terms. https://doi.org/10.1017/S0007114513003875of obesity. In human subjects, Million et al.(11)have recently demonstrated an association between Lactobacillus and weight. They found that certain species of Lactobacillus are present in normal-weight individuals, while other species of Lactobacillus are present in obese individuals(11). Unlike in diabetes(12,13), changes in gut microbiota composition associ-ated with obesity or weight loss are less clear in humans. In 2006, Ley et al.(6) showed that after consumption of a carbohydrate- or fat-restricted low-energy diet, obese subjects had an increased proportion of Bacteroidetes and a decreased abundance of Firmicutes in their gut, confirming observation made in rodents. However, other studies have reported opposite results or lack of changes in gut microbiota composition(5,14 – 16). These differences might be due to differences in population characteristics and size and method-ologies used for analysing microbiota composition.
The potential role of gut microbiota in the development of obesity led several groups to investigate the effects of probiotic consumption on weight management. Probiotics, which are bacteria known to confer health benefits on the host, may modulate the gut microbiota and therefore affect the energy balance and/or metabolism of the host. The admin-istration of specific strains of Lactobacillus or Bifidobacterium has been shown to prevent weight gain in mouse models of obesity(17). Limited evidence exists on the effect of probiotic consumption on weight management in humans. Kadooka et al.(18) reported that a supplementation of fermented milk with Lactobacillus gasseri SBT2055 for 12 weeks induces signi-ficant weight loss (about 1 kg) and a decrease in abdominal visceral and subcutaneous fat mass in overweight men and women under ad libitum conditions. Recently, a placebo-controlled, double-blind, cross-over clinical study has shown that the consumption of two yogurts per d supplemented with Lactobacillus amylovorus (109 colony-forming units (cfu)/yogurt) leads to a decrease in total body fat mass(19). Inter-estingly, Ilmonen et al.(20)showed that nutritional counselling combined with probiotic treatment (Lactobacillus rhamnosus GG and Bifidobacterium lactis Bb12) in pregnant women can reduce the risk of central adiposity at 6 months post-partum.
The aim of the present study was to investigate, for the first time in human subjects, the effects of probiotic consump-tion during the energy-restricconsump-tion and weight-maintenance phases. For this purpose, the association between Lactobacillus rhamnosus CGMCC1.3724 (LPR) and a low dose of poly-saccharides was tested in obese men and women.
Methods
Healthy overweight men and women participated in a 24-week randomised, double-blind, placebo-controlled trial that was aimed at facilitating body-weight control by using a two-phase intervention protocol. In phase 1 (weight-loss period), supervised dietary restriction with or without probio-tic LPR supplementation was followed over 12 weeks. Phase 2 was a period of weight maintenance with supervision of diet-ary habits without restriction over 12 weeks during which LPR or placebo supplementation was continued. The present study was conducted according to the guidelines laid down in the
Declaration of Helsinki, and all procedures involving human subjects were approved by the Laval Hospital Ethics Commit-tee (CER: 20 449) and by Health Canada (144245). Written informed consent was obtained from all the subjects. The study was registered at ClinicalTrials.gov (NCT01106924).
Subjects
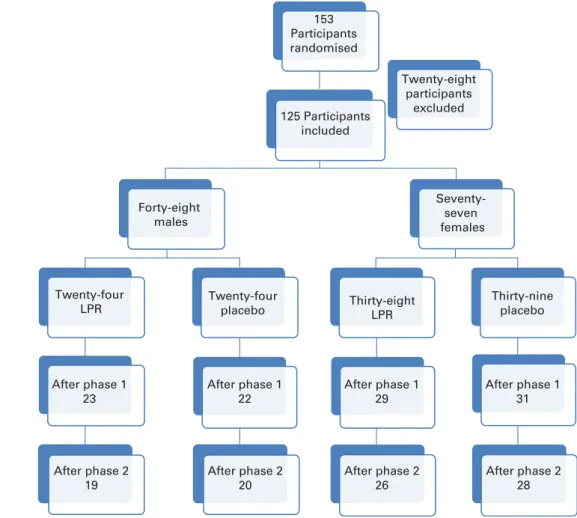
Subjects were recruited through different media in the Quebec City area on the basis of the following inclusion and exclusion criteria that were verified during telephone inter-views: age between 18 and 55 years; absence of pregnancy, breast-feeding or menopause (determined by the cessation of menstruation); stable body weight (body-weight change ,5 kg for 3 months before screening); BMI between 29 and 41 kg/m2; without associated co-morbidities (hypertension $140/90 mmHg, obstructive sleep apnoea, type 2 diabetes or CVD, or family history of dyslipidaemia); no abnormal thyroid hormone levels; no immunocompromised conditions or anaemia; no use of vitamin and mineral supplementation within 6 months of screening; no use of medication affecting body weight, energy expenditure, or glucose control or anti-biotic treatment for the last 3 months; no smoking, drug or alcohol (. 2 drinks/d) problem; consumption of # 5 cups of coffee/d (1250 ml/d). Participants with allergy to the ingre-dients in the study product and placebo or experiencing nausea, fever, vomiting, bloody diarrhoea or severe abdomi-nal pain or currently participating or having had participated in another clinical trial during the last 6 months before the beginning of the present study were excluded. A 2-week washout period was included in the intervention programme to eliminate probiotic-containing products in the daily diet before the initiation of treatment. Participants who met these criteria were invited to a pre-selection individual meeting during which body weight and height were measured. They also received more information about the protocol and explanations about the dietary and physical activity records that had to be completed at home. Baseline characteristics of the participants are given in Table 1. The first step of screening allowed the recruitment of 153 participants. The participants were aware of the study objectives, but they were blinded regarding the supplementation (LPR or placebo) that was assigned according to the computerised randomisation sys-tem. After randomisation, blood samples were analysed and twenty-eight subjects were excluded because of dyslipidaemia (plasma TAG levels . 2·0 mmol/l).
Fig. 1 shows the distribution of subjects within each study group. The LPR formulation and the placebo were administered orally. All the participants had to ingest one capsule 30 min before breakfast and one capsule 30 min before dinner. The subjects were tested at baseline, at week 12 (after the weight-loss phase) and at week 24 (after the weight-maintenance phase) of the programme. The partici-pants arrived at the laboratory at about 08.00 hours, after a 12 h overnight fast, during each testing session, and they had to abstain from physical exercise for 48 h and from alcohol intake for 24 h before the testing session. For women, testing sessions were held during the first 10 d of their menstrual cycle.
British
Journal
of
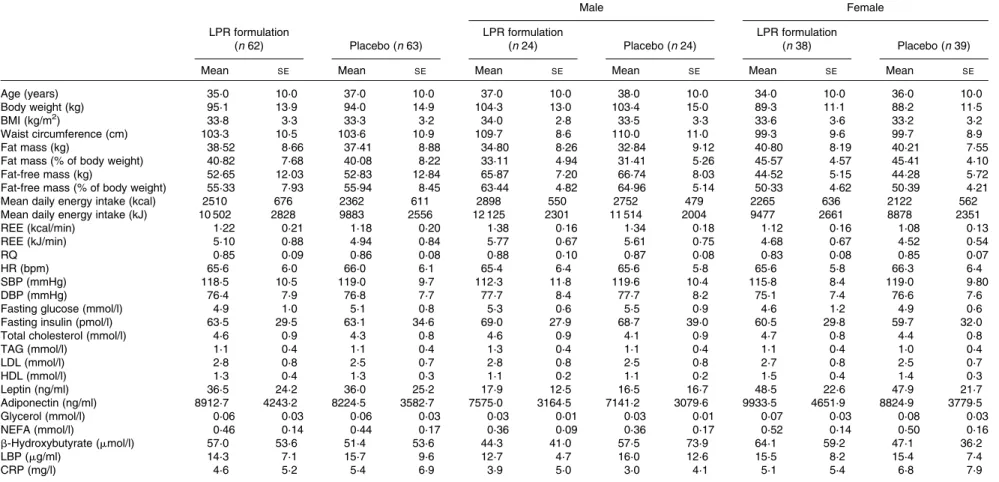
Table 1. Baseline characteristics of the subjects (Mean values with their standard errors)
Male Female LPR formulation (n 62) Placebo (n 63) LPR formulation (n 24) Placebo (n 24) LPR formulation (n 38) Placebo (n 39)
Mean SE Mean SE Mean SE Mean SE Mean SE Mean SE
Age (years) 35·0 10·0 37·0 10·0 37·0 10·0 38·0 10·0 34·0 10·0 36·0 10·0
Body weight (kg) 95·1 13·9 94·0 14·9 104·3 13·0 103·4 15·0 89·3 11·1 88·2 11·5
BMI (kg/m2) 33·8 3·3 33·3 3·2 34·0 2·8 33·5 3·3 33·6 3·6 33·2 3·2
Waist circumference (cm) 103·3 10·5 103·6 10·9 109·7 8·6 110·0 11·0 99·3 9·6 99·7 8·9
Fat mass (kg) 38·52 8·66 37·41 8·88 34·80 8·26 32·84 9·12 40·80 8·19 40·21 7·55
Fat mass (% of body weight) 40·82 7·68 40·08 8·22 33·11 4·94 31·41 5·26 45·57 4·57 45·41 4·10
Fat-free mass (kg) 52·65 12·03 52·83 12·84 65·87 7·20 66·74 8·03 44·52 5·15 44·28 5·72
Fat-free mass (% of body weight) 55·33 7·93 55·94 8·45 63·44 4·82 64·96 5·14 50·33 4·62 50·39 4·21
Mean daily energy intake (kcal) 2510 676 2362 611 2898 550 2752 479 2265 636 2122 562
Mean daily energy intake (kJ) 10 502 2828 9883 2556 12 125 2301 11 514 2004 9477 2661 8878 2351
REE (kcal/min) 1·22 0·21 1·18 0·20 1·38 0·16 1·34 0·18 1·12 0·16 1·08 0·13 REE (kJ/min) 5·10 0·88 4·94 0·84 5·77 0·67 5·61 0·75 4·68 0·67 4·52 0·54 RQ 0·85 0·09 0·86 0·08 0·88 0·10 0·87 0·08 0·83 0·08 0·85 0·07 HR (bpm) 65·6 6·0 66·0 6·1 65·4 6·4 65·6 5·8 65·6 5·8 66·3 6·4 SBP (mmHg) 118·5 10·5 119·0 9·7 112·3 11·8 119·6 10·4 115·8 8·4 119·0 9·80 DBP (mmHg) 76·4 7·9 76·8 7·7 77·7 8·4 77·7 8·2 75·1 7·4 76·6 7·6
Fasting glucose (mmol/l) 4·9 1·0 5·1 0·8 5·3 0·6 5·5 0·9 4·6 1·2 4·9 0·6
Fasting insulin (pmol/l) 63·5 29·5 63·1 34·6 69·0 27·9 68·7 39·0 60·5 29·8 59·7 32·0
Total cholesterol (mmol/l) 4·6 0·9 4·3 0·8 4·6 0·9 4·1 0·9 4·7 0·8 4·4 0·8
TAG (mmol/l) 1·1 0·4 1·1 0·4 1·3 0·4 1·1 0·4 1·1 0·4 1·0 0·4 LDL (mmol/l) 2·8 0·8 2·5 0·7 2·8 0·8 2·5 0·8 2·7 0·8 2·5 0·7 HDL (mmol/l) 1·3 0·4 1·3 0·3 1·1 0·2 1·1 0·2 1·5 0·4 1·4 0·3 Leptin (ng/ml) 36·5 24·2 36·0 25·2 17·9 12·5 16·5 16·7 48·5 22·6 47·9 21·7 Adiponectin (ng/ml) 8912·7 4243·2 8224·5 3582·7 7575·0 3164·5 7141·2 3079·6 9933·5 4651·9 8824·9 3779·5 Glycerol (mmol/l) 0·06 0·03 0·06 0·03 0·03 0·01 0·03 0·01 0·07 0·03 0·08 0·03 NEFA (mmol/l) 0·46 0·14 0·44 0·17 0·36 0·09 0·36 0·17 0·52 0·14 0·50 0·16 b-Hydroxybutyrate (mmol/l) 57·0 53·6 51·4 53·6 44·3 41·0 57·5 73·9 64·1 59·2 47·1 36·2 LBP (mg/ml) 14·3 7·1 15·7 9·6 12·7 4·7 16·0 12·6 15·5 8·2 15·4 7·4 CRP (mg/l) 4·6 5·2 5·4 6·9 3·9 5·0 3·0 4·1 5·1 5·4 6·8 7·9
LPR, Lactobacillus rhamnosus CGMCC1.3724; REE, resting energy expenditure; RQ, respiratory quotient; HR, heart rate; bpm, beats/min; SBP, systolic blood pressure; DBP, diastolic blood pressure; LBP, lipopolysaccharide-binding protein; CRP, C-reactive protein.
Lactobacillus rhamnosus and body weight 1509
British Journal of Nutrition
https:/www.cambridge.org/core/terms
.
https://doi.org/10.1017/S0007114513003875
Downloaded from
https:/www.cambridge.org/core
. University of Basel Library
, on
10 Jul 2017 at 15:49:32
Treatment
The probiotic capsules contained a formulation consisting of 10 mg of a LPR powder providing 1·62 £ 108 cfu, 300 mg of a mix of oligofructose and inulin (70:30, v/v) and 3 mg of magnesium stearate. The placebo capsules were of the same colour and size as the LPR capsules and contained 250 mg of maltodextrin and 3 mg of magnesium stearate. The subjects consumed two capsules per d corresponding to an average of 3·24 £ 108cfu/d in the probiotic group. When combined with prebiotics or other probiotics, LPR has been shown to promote healthy growth in toddlers and to reduce risks of eczema in infants(21,22).
Daily energy intake and physical activity measurements
A standardised 3 d dietary record(23)was obtained from each participant. This record was completed at home after the par-ticipants had received detailed explanations from a dietitian. A computerised version of the Canadian Nutrition File (version 2005) was used to determine the macro- and micronutrient content of foods as well as total daily energy intake(24). This measurement was repeated at the end of the weight-loss period (phase 1) and the weight-maintenance period (phase 2). A 3 d physical activity record was also completed
at home on the same days the dietary record was completed. In addition, the participants completed a 24 h dietary recall with the assistance of the dietitian every 2 weeks during phase 1 and every month during phase 2. These records or recalls provided reference information of each participant to the dietitian to standardise the counselling and related guide-lines over the two phases of the intervention programme.
Energy-restricted diet
As has been indicated above, each participant received a personalised diet plan targeting 2092 kJ/d (500 kcal/d) energy restriction for the first 12 weeks of the programme. During phase 2, each participant received a personalised diet plan without energy restriction. The energy content of the diets was determined by a dietitian from the daily energy require-ment of each participant. The daily energy requirerequire-ment was estimated using resting energy expenditure and multiplying it by an activity factor based on the physical activity record. Resting energy expenditure was determined after a 12 h over-night fast in subjects having had rested for at least 15 min in a standardised supine position. Resting energy expenditure was measured at baseline and was reassessed after the weight-loss and weight-maintenance periods using indirect calorimetry. Specifically, expired air was collected through a mouthpiece
After phase 2 19 After phase 2 20 After phase 2 26 After phase 2 28 After phase 1 31 After phase 1 29 After phase 1 22 After phase 1 23 Twenty-four LPR Twenty-four placebo Thirty-eightLPR Thirty-nine placebo Seventy-seven females Forty-eight males 125 Participants included 153 Participants randomised Twenty-eight participants excluded
Fig. 1. Flow chart of the study protocol. (A colour version of this figure can be found online at http://www.journals.cambridge.org/bjn).
British
Journal
of
with the nose being clipped. The concentrations of oxygen (electrochemical oxygen sensor) and CO2 (non-dispersive IR analysis) were determined using an Uras 10 E device (Hartmann & Braun), whereas pulmonary ventilation was assessed using a K520 flow transducer and a Spirometric module S-430A measurement system (KL Engineering). The Weir formula(25)was used to determine the energy equivalent of O2volume.
The food plan was based on an exchange food group list adapted from the Meal Planning for People with Diabetes(26). Apart from the supplement, both the groups were limited to consume a maximum of four servings of products sup-plemented with probiotics per week. Each participant met his or her assigned dietitian every 2 weeks during phase 1 and every 4 weeks during phase 2. The participants’ compliance to the diet plan was measured by comparing the prescribed diet composition (total daily energy intake and macronutrient composition) with the actual diet composition measured every 2 weeks by a 24 h dietary recall. The participants’ com-pliance to the supplementation was measured using the compliance journal every 2 and 4 weeks during the weight-loss period and the weight-maintenance period, respectively. Participants who discontinued taking the treatment (LPR or placebo) for three consecutive days were excluded.
Anthropometric parameter and body composition measurements
Body weight, height (light clothes and without shoes) and waist circumference (directly on the skin) were assessed at baseline, every 2 weeks during phase 1 as well as at the end of this phase, and every 4 weeks during phase 2 and at the end of this phase, except for height(27). BMI was calculated as body weight divided by height squared (kg/m2). During each testing session, heart rate, systolic blood pressure and diastolic blood pressure were assessed in a supine position after a resting period. Body fat and fat-free mass were measured by dual-energy X-ray absorptiometry (GE Medical Systems Lunar) at baseline, at the end of the weight-loss phase and at the end of the weight-maintenance phase.
Biochemical analyses
Blood samples were collected into EDTA-containing tubes (Miles Pharmaceuticals) and heparin-containing tubes at about 08.00 hours following an overnight fast for at least 12 h. These samples were used for the determination of plasma con-centrations of glucose, insulin, leptin, lipids, lipoproteins and inflammatory indicators, which were measured at three time points (baseline, week 12 and week 24). The concentration of glucose was measured enzymatically(28), that of insulin was determined by an electrochemiluminescence immunoassay(29), that of leptin was determined using an ELISA array (Human Leptin ELISA Kit; B-Bridge International, Inc.) detecting leptin levels as low as 0·78 pg/assay and not cross-reacting with human insulin, proinsulin, glucagon, pancreatic polypeptide or somatostatin(30). The concentrations of total cholesterol, phospholipids and TAG were quantified by enzymatic assays.
The concentrations of HDL-cholesterol and LDL-cholesterol were determined by an immunoinhibition method (HDL-C, LDLC Direct; BioRad Unassayed Chem). The concentration of C-reactive protein was measured using an ELISA array (Human C-Reactive Protein ELISA Kit; EDM Millipore). The concentration of glycerol was measured using a colorimetric method, utilising commercially available kits (Randox Labo-ratories), and that of NEFA was measured using the same method, utilising commercially available kits (Wako). The plasma concentration of b-hydroxybutyrate was measured using an enzymatic assay (Wako). The serum concentration of LBP was assayed using an ELISA kit (Hycult Biotech). The plasma concentration of adiponectin was determined using an ELISA array obtained from Millipore.
In vitro gastrointestinal Lactobacillus rhamnosus CGMCC1.3724 survival assay
LPR (6 £ 108cfu) was incubated at 378C in 1 ml of gastric (0·3 % porcine pepsin þ NaCl 0·55 adjusted at pH 2·5) or duodenal (0·2M-phosphate buffer at pH 6·8 þ 0·49 % porcine bile þ 0·24 % porcine pancreatin) simulated juices in the presence or not in the presence of 0·01, 0·1 or 1 % of oligofructose/inulin (70:30, v/v; Beneo). After 30 min of incubation in the gastric juice, 100 ml of the mix were trans-ferred into the duodenal juice for 90 min. LPR viability was assessed at 30 and 120 min by plating and growing Lactobacilli for 48 h under anaerobic conditions on de Man, Rogosa and Sharpe (MRS) agar medium plates (methods adapted from Sutter et al.(31)). Cfu were counted and are reported as cfu/ml of solution.
Sequence-based microbiota analysis
Faecal samples were collected from the placebo-treated and probiotic-treated subjects at baseline, end of phase 1, and end of phase 2, and samples were stored at 2808C until analysis. Frozen faecal samples were reduced to a powder using a cryo-PREP device (Covaris), and total DNA was extracted using the QIAamp DNA Stool Mini Kit (QIAGEN), following the manu-facturer’s instructions, except for the addition of a series of mechanical disruption steps (11 £ 45 s) using a FastPrep apparatus and Lysing Matrix B tubes (MP Biochemicals)(32). PCR amplification was carried out using two sets of primers targeting the hypervariable regions (V) 1 – 3 (V123) and 4 – 6 (V456) of the 16S ribosomal RNA gene. For the amplifica-tion of the V123 region, a mixture of forward primers was combined to ensure optimal coverage of bacterial phylogenetic diversity, as described previously(33). The primers were designed according to Hamady et al.(34): V123 forward primer 1, 50 -CTATGCGCCTTGCCAGCCCG-CTCAGTCAGAGTTTGATYMTGGCTCAG-30; V123 forward primer 2, 50 -CTATGCGCCTTGCCAGCCCGCTCAGTCAGG-GTTCGATTCTGGCTCAG-30; V123 forward primer
3, 50
-CTATGCGCCTTGCCAGCCCGCTCAGTCAGAGTTTGATC-AGAGTTTGATCCTGGCTTAG-30; V123 forward primer 4, 50 -CTATGCGCCTTGCCAGCCCGCTCAGTCAGAATTTGATCT-AGAATTTGATCTTGGTTCAG-30; V123 reverse primer,
Lactobacillus rhamnosus and body weight 1511
British
Journal
of
Nutrition
https:/www.cambridge.org/core/terms. https://doi.org/10.1017/S0007114513003875
50
-CGTATCGCCTCCCTCGCGCCATCAGNNNNNNNNGGTTAC-CGCGGCTGCTGGCAC-30; V456 forward primer, 50
-CT- ATGCGCCTTGCCAGCCCGCTCAGGCCRRCACGAGCTGAC-GAC-30; and V456 reverse primer, CGTATCGCCTCCCTCGCGC-CATCAGNNNNNNNNAGGCCAGCAGCCGCGGTAA-30 (where the adapter sequences for Roche 454 FLX Titanium sequen-cing are italicised, the linkers are underlined, NNNNNNNN sequences designate the sample-specific eight-base barcodes used to tag each PCR product, and bold sequences correspond to broadly conserved 16S ribosomal RNA gene regions). V123 forward primers 1, 2, 3 and 4 were combined in 4:1:1:1 ratios. Amplifications were performed in 50 ml volumes with 2 ml of DNA extract, 50 mM of deoxyribonucleotide triphosphate (dNTP), 200 nM of forward primers (mix of forward primers for the V123 region), 200 nM of reverse primers, 1 £ Expand High Fidelity Reaction Buffer and 5 U/100 ml of Expand High FidelityPLUS enzyme blend (Roche Applied Science). PCR conditions were as follows: 948C for 2 min followed by twenty-five cycles of 948C for 30 s, 498C for 30 s, and 728C for 1 min, ending with a final step of 728C for 7 min. After puri-fication, pooling in equimolar amounts, the PCR products were sequenced using the 454 FLX Titanium technology (Microsynth AG). Raw data were analysed using the QIIME software package(35)with default parameters, except that no barcode correction was allowed, and reverse primers were removed when present. The chimeras were detected and removed using ChimeraSlayer based on reference alignment from GreenGenes (as provided in QIIME 1.2) and default parameters. Samples described by less than 200 sequencing reads were excluded from the analysis. Quality-filtered sequencing reads were analysed using the Uclust method at a similarity threshold of 97 % identity for operational taxonomic unit clustering. The assignment of operational taxonomic unit into Bergey’s bacterial taxonomy was done using the Ribosomal Database Project (RDP) Classifier with a confidence value threshold of 60 %.
Quantification of faecal Lactobacillus rhamnosus CGMCC1.3724
The quantification of Lactobacillus rhamnosus CGMCC1.3724 was carried out by quantitative PCR using faecal DNA as described previously(36). Dilutions of genomic DNA of L. rhamnosus CGMCC1.3724 were used to prepare a calibration curve (0·02 pg – 20 ng). Measured DNA quantities were con-verted into number of genome equivalents/g of faeces based on the molecular weight of the L. rhamnosus CGMCC1.3724 genome (3·278 fg/genome). The limit of quantification (1·26 £ 105genome equivalents/g of faeces) was set to 10-fold of the measured quantitative PCR detection limit, to take into account potential contamination during sample analysis.
Statistical analysis (clinical outcomes)
The outcome measures were analysed using ANCOVA consi-dering changes over time in a mixed model setting treatment and sex as independent variables while correcting for baseline values in the model. The change in fat mass over time was
also considered as an independent variable for the ANCOVA pertaining to changes in plasma leptin concentrations over time. Furthermore, the effect of treatment £ sex interaction in the model was examined. The analyses were carried out on the intention-to-treat population utilising SAS version 9.2 (SAS Institute). Statistical significance level was set at 5 %, and no correction of significance level was applied to adjust for mul-tiple testing. Sample size calculation was implemented using the statistical and power analysis software NCSS. The calculations were primarily driven by the intention to show superiority in mean body-weight reduction at a significance level of 5 % and with a statistical power of 80 %. The initial calculations suggested that the testing of 104 subjects (fifty-two per group) was required to get adequate statistical power. In addition, since a dropout rate of about 12 % subjects was anticipated, we planned to recruit 120 obese subjects (sixty per treatment group). The sample of 104 subjects estimated above was also expected to provide adequate power to address the important secondary objective aiming at the detection of a between-treatment difference in body-weight change of 1·5 kg or more during the weight-maintenance phase of the programme.
Statistical analysis (microbiota composition)
Statistical analysis of differences between the groups with regard to the relative abundance of individual taxonomic groups was assessed using two-sided Wilcoxon signed-rank tests. This analysis is consistent with the analysis on the clinical outcomes, but slightly refined to take the microbiota data speci-ficities into account. First, the analysis was carried out during visits (while checking the baseline levels), since the clinical relevance of assessing the difference between two relative abun-dance values is very low. Second, a non-parametric approach was preferred due to the non-normal distribution of the micro-biota data. Moreover, the statistical analysis was carried out by sex, based on the information gathered from the clinical out-comes. No correction of significance level was applied to adjust for multiple testing. However, since the analysis was carried out on two 16S ribosomal RNA gene regions separately, only taxa showing consistent differences in both the regions, with a significance level of 5 % and median relative abundance greater than or equal to 0·1 % in at least one group, were examined.
Results
Improvement of Lactobacillus rhamnosus CGMCC1.3724 viability
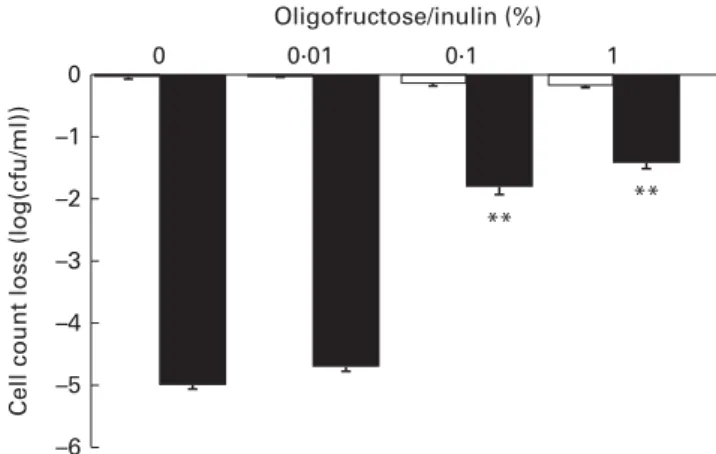
Metabolisable sugars have been reported to improve the survival of Lactobacillus rhamnosus strain LGG in gastrointes-tinal conditions through ATP production(37). The survival of LPR in simulated gastrointestinal tract conditions was assessed in vitro by incubating the probiotic in a medium mimicking the upper gastrointestinal tract conditions (stomach and duodenum) containing or not containing a mixture of oligo-saccharides and polyoligo-saccharides (fructo-oligooligo-saccharides – inulin 70:30). The viability of LPR was only slightly affected under the simulated gastric conditions, whereas under duodenal
British
Journal
of
conditions bacterial counts were dramatically decreased (2 5·00 (SE 0·06) log (cfu/ml); Fig. 2). Supplementation of 0·1 % of a mixture of oligosaccharides and polysaccharides significantly improved the resistance of LPR to duodenal con-ditions (2 1·76 (SE0·14) log (cfu/ml); Fig. 2). Based on these results and the assumption that probiotic viability is required for the efficacy of LPR, 300 mg of the oligosaccharide and polysaccharide mixture were added to each ingredient cap-sule to improve probiotic gastrointestinal tract survival and support functionality. This dose of oligosaccharides and poly-saccharides corresponds to a dose that is 100-fold higher than the maximal dose tested in vitro in order to ensure optimal survival during capsule filling and gastrointestinal transit.
Intervention trial: effects on body weight and body composition
Variations in body weight and composition are summarised in Table 2. The intention-to-treat analysis showed that treatment with the LPR formulation did not significantly change weight loss during the energy-restriction period (week 12, phase 1) and after the weight-maintenance period (week 24, phase 2) in the population regrouping male and female subjects. Fat mass was also not significantly modified by the LPR formu-lation at week 12, but it tended to be decreased by the treatment at week 24 (changes in fat mass compared with those observed with the placebo treatment: 2 1·42 (SE 0·79) kg; P¼ 0·07; values are corrected for the baseline values). A signifi-cant treatment £ sex interaction effect was observed for some variables. Specifically, during phase 1, reductions in body weight and fat mass were more pronounced in the LPR-treated women than in the placebo-treated women (Table 2; changes in body weight compared with those observed with the placebo treatment: 2 1·8 (SE 0·8) kg; P¼ 0·02; changes in fat mass compared with those observed with the placebo treat-ment: 2 1·23 (SE 0·66) kg; P¼ 0·06; values are corrected for the baseline values). Similarly, at the end of phase 2,
reductions in body weight and fat mass were more pronounced in the LPR-treated women than in the placebo-treated women (changes in body weight compared with those observed with the placebo treatment: 2 2·6 (SE1·1) kg; P¼ 0·02; changes in fat mass compared with those observed with the placebo treatment: 2 2·54 (SE 1·01) kg; P¼ 0·01; values are corrected for the baseline values). The body weight and fat mass of men were not affected by the treatment during the two phases of the programme.
Energy balance and physiological parameters
Table 2 also summarises the values of reported daily energy intake in each group of subjects at baseline and at the end of the two phases of the programme (weeks 12 and 24). As expected, the reported energy intake was reduced at week 12, which is compatible with the dietary restriction that was planned at the beginning of the intervention. In each group, this reduced energy intake was maintained at week 24, and no difference between the placebo and LPR groups and between the sexes was observed during the two phases. How-ever, in spite of a lack of significant differences, energy intake seemed to be consistently lower in the LPR-treated women in both phase 1 and phase 2, when compared with that in women in the placebo group (Table 2).
Variations in other physiological parameters are summarised in Table 2. The LPR treatment did not exert any significant effect on resting energy expenditure, respiratory quotient, heart rate and diastolic blood pressure, during both phase 1 and phase 2.
Metabolic and inflammatory plasma markers
There was no significant treatment and treatment £ sex interaction effect on the metabolic and inflammatory plasma markers during the programme, except for plasma leptin (Table 3). Indeed, at week 24, a more pronounced decrease in fasting leptin concentrations was found in the population, including males and females in the LPR group compared with their placebo counterparts (changes compared with those observed with the placebo treatment: 2 5·9 (SE 2·3) ng/ml; P¼ 0·01; values are corrected for the baseline values). This effect of LPR on plasma leptin concentrations of the popu-lation regrouping both the sexes was mainly driven by an important effect in females (changes compared with those observed with the placebo treatment: 2 11·0 (SE 2·9) ng/ml; P¼ 0·0004; values are corrected for the baseline values). These differences remained significant when the values were corrected for the loss of fat mass between baseline and week 24, suggesting that LPR decreased plasma leptin concen-trations independently of fat mass reduction.
Microbiota analyses
The sequencing of 16S ribosomal RNA gene libraries in stool samples collected at baseline, at week 12 and at week 24 gen-erated, on average, 925 and 823 quality-filtered reads/sample for the V123 and V456 regions, respectively. The following
Oligofructose/inulin (%) 0 0 –1 –2 –3 –4 –5 –6
Cell count loss (log(cfu/ml))
0·01 0·1 1
** **
Fig. 2. Lactobacillus rhamnosus CGMCC1.3724 survival in the presence of an oligofructose/inulin mix under gastric (A) and duodenal (B) in vitro conditions. Values are means, with their standard errors represented by vertical bars, n 4. Results represent the decrease in bacterial count when compared with the initial bacterial count (8·85 (SE0·02) log (cfu/ml)). ** Mean values were significantly different from those obtained under the gastric or duodenal condition in the absence of the oligofructose/inulin mix (P, 0·01).
Lactobacillus rhamnosus and body weight 1513
British
Journal
of
Nutrition
https:/www.cambridge.org/core/terms. https://doi.org/10.1017/S0007114513003875
number of samples per group and per time point fulfilled the quality criteria for consideration of sequencing results: fifty-two, fifty and forty-four samples from the placebo group at baseline, week 12 and week 24, respectively; fifty-two, fifty and forty-two samples from the LPR group at baseline, week 12 and week 24, respectively. Diversity rarefaction curves reached a plateau, suggesting that the current sequencing effort captured most of the phylogenetic diversity within the samples (data not shown). Phylogenetic diversity was not dis-tinguishable between the sexes (at baseline) and groups (at all time points; data not shown). As expected, the quantification of overall microbiota similarity between the samples, measured based on weighted UniFrac distances, revealed a
higher similarity between the samples collected from the same subjects at different time points than between the samples collected from different subjects (Fig. 3). The relative abun-dance of individual bacterial taxonomic groups was analysed at phylum, class, order, family and genus levels, and it is reported as median hereafter. At baseline and at weeks 12 and 24, no significant difference was detected between the groups (LPR v. placebo). Considering the sex £ treatment interaction observed for the anthropometric parameters (described above), we stratified the groups by sex. At base-line, a significant difference was detected between males and females with regard to the relative abundance of bacteria of the Prevotellaceae family. However, this taxonomic group
Table 2. Changes in body weight, body composition and physiological variables during the intervention programme (Mean values with their standard errors)
Male Female
LPR formulation Placebo LPR formulation Placebo LPR formulation Placebo
Mean SE Mean SE Mean SE Mean SE Mean SE Mean SE
DWeek 12-baseline (n) 52 53 23 22 29 31 DWeek 24-baseline (n) 45 48 19 20 26 28 DBody weight (kg) DWeek 12-baseline 24·2 3·2 23·4 2·9 24·0 3·4 24·6 3·2 24·4* 3·0 22·6 2·3 DWeek 24-baseline 25·3 4·3 23·9 4·2 25·4 4·8 25·7 4·5 25·2* 4·0 22·5 3·5 DFat mass (kg) DWeek 12-baseline 23·51 2·39 22·76 2·83 23·20 2·70 23·05 2·90 23·75 2·14 22·55 2·80 DWeek 24-baseline 24·59 3·80 23·10 3·98 24·30 4·14 24·43 3·45 24·79* 3·60 22·16 4·11 DFat mass (%) DWeek 12-baseline 22·16 1·94 21·82 2·40 22·07 2·06 21·95 2·36 22·23 1·88 21·72 2·46 DWeek 24-baseline 23·13 3·41 22·13 3·11 22·88 3·24 23·03 2·67 23·30* 3·57 21·48 3·28 DFat-free mass (kg) DWeek 12-baseline 20·56 1·80 20·49 1·99 20·65 1·81 21·27 2·18 20·50 1·83 0·07 1·66 DWeek 24-baseline 20·56 1·52 20·31 1·79 20·82 1·56 20·80 1·96 20·37 1·50 0·05 1·59 DFat-free mass (%) DWeek 12-baseline 2·15 2·00 1·87 2·49 2·10 1·99 2·09 2·46 2·19 2·04 1·72 2·54 DWeek 24-baseline 3·05 3·53 2·38 2·79 2·92 3·40 3·27 2·58 3·13 3·68 1·74 2·80
DMean daily energy intake (kcal)
DWeek 12-baseline 2429 479 2402 433 2405 454 2435 454 2488 505 2376 423
DWeek 24-baseline 2343 440 2312 454 2341 432 2375 457 2345 455 2272 456
DMean daily energy intake (kJ) DWeek 12-baseline 21795 2000 21682 1812 21695 1900 21820 1900 22042 2113 21573 1770 DWeek 24-baseline 21435 1841 21305 1900 21427 1807 21569 1912 21443 1904 21138 1908 DREE (kcal/min) DWeek 12-baseline 20·06 0·10 20·04 0·10 20·05 0·10 20·04 0·13 20·07 0·10 20·04 0·07 DWeek 24-baseline 20·06 0·11 20·02 0·11 20·02 0·13 20·01 0·09 20·08 0·09 20·04 0·13 DREE (kJ/min) DWeek 12-baseline 20·25 0·42 20·17 0·42 20·21 0·42 20·17 0·54 20·29 0·42 20·17 0·29 DWeek 24-baseline 20·25 0·46 20·08 0·46 20·08 0·54 20·04 0·38 20·33 0·38 20·17 0·54 DRQ DWeek 12-baseline 20·01 0·07 20·01 0·08 20·01 0·07 20·01 0·07 20·01 0·07 20·01 0·09 DWeek 24-baseline 0·00 0·09 20·01 0·08 20·02 0·10 20·02 0·09 0·02 0·08 0·00 0·07 DHR (bpm) DWeek 12-baseline 21·5 6·9 21·7 6·6 21·8 7·9 23·0 7·3 21·3 6·2 20·8 6·1 DWeek 24-baseline 23·0 6·0 22·9 7·3 22·1 6·9 23·9 7·8 23·7 5·4 22·3 7·0 DSBP (mmHg) DWeek 12-baseline 22·7 8·1 25·0 10·3 24·0 9·5 21·5 10·0 21·8 7·0 27·6 9·8 DWeek 24-baseline 21·2* 9·9 26·1 9·4 20·7 11·2 23·3 11·1 21·5* 9·1 28·2 7·5 DDBP (mmHg) DWeek 12-baseline 22·1 6·6 20·8 7·5 22·1 7·7 0·2 9·8 22·0 5·9 21·4 5·4 DWeek 24-baseline 20·3 7·0 21·9 8·4 0·6 0·77 21·0 9·6 20·9 6·6 22·5 7·6
LPR, Lactobacillus rhamnosus CGMCC1.3724; REE, resting energy expenditure; RQ, respiratory quotient; HR, heart rate; bpm, beats/min; SBP, systolic blood pressure; DBP, diastolic blood pressure.
* Mean values were significantly different from those of the placebo group (P, 0·05).
British
Journal
of
Table 3. Changes in metabolic and inflammatory markers during the intervention programme (Mean values with their standard errors)
Male Female
LPR Placebo LPR Placebo LPR Placebo
Mean SE Mean SE Mean SE Mean SE Mean SE Mean SE
DWeek 12-baseline (n) 52 53 23 22 29 31
DWeek 24-baseline (n) 45 48 19 20 26 28
DFasting glucose (mmol/l)
DWeek 12-baseline 0·2 0·7 0·1 0·5 0·0 0·3 20·1 0·4 0·4 0·9 0·2 0·6
DWeek 24-baseline 0·2 0·8 0·0 0·5 0·1 0·4 20·2 0·3 0·3 1·0 0·2 0·6
DFasting insulin (pmol/l)
DWeek 12-baseline 23·0 30·8 28·0 27·2 0·5 28·3 27·1 35·7 25·9 33·1 28·6 18·8
DWeek 24-baseline 214·1 19·6 212·7 25·2 212·8 17·7 220·9 229·4 215·2 21·3 26·7 20·2
DTotal cholesterol (mmol/l)
DWeek 12-baseline 20·3 0·6 20·2 0·5 20·2 0·5 20·2 0·4 20·4 0·7 20·2 0·6 DWeek 24-baseline 20·2 0·5 20·1 0·5 20·2 0·5 20·2 0·4 20·2 0·4 20·0 0·6 DTAG (mmol/l) DWeek 12-baseline 20·1 0·4 20·1 0·3 20·1 0·5 20·1 0·4 20·1 0·3 0·0 0·3 DWeek 24-baseline 20·0 0·3 20·1 0·3 0·0 0·5 20·1 0·3 20·1 0·2 20·1 0·3 DLDL (mmol/l) DWeek 12-baseline 20·2 0·5 20·1 0·4 20·1 0·4 20·2 0·4 20·2 0·5 20·1 0·4 DWeek 24-baseline 20·2 0·4 20·1 0·4 20·3 0·4 20·2 0·4 20·1 0·4 20·1 0·4 DHDL (mmol/l) DWeek 12-baseline 20·1 0·2 20·0 0·2 0·0 0·1 0·0 0·1 20·2 0·3 20·1 0·2 DWeek 24-baseline 0·0 0·2 0·1 0·2 0·1 0·2 0·1 0·1 20·0 0·3 0·1 0·2 DLeptin (ng/ml) DWeek 12-baseline 27·0 8·0 24·8 11·7 22·8 4·2 23·0 4·4 210·2 8·7 26·2 15·1 DWeek 24-baseline 28·1* 10·4 20·8 12·1 23·5 4·1 21·8 5·3 211·3* 12·2 20·1 15·4 DAdiponectin (ng/ml) DWeek 12-baseline 2149·8 1641·6 15·2 1698·4 25·3 1797·3 393·3 1800·8 2282·7 1532·0 2271·6 1587·9 DWeek 24-baseline 439 1669·7 1073·6 1974·7 157·4 1190·4 1242·2 2367·7 638·6 1935·2 948·8 1662·6 DGlycerol (mmol/l) DWeek 12-baseline 20·00 0·02 20·01 0·02 0·00 0·01 0·00 0·01 0·00 0·02 20·01 0·03 DWeek 24-baseline 20·00 0·02 20·01 0·03 20·00 0·01 0·00 0·02 20·00 0·03 20·02 0·03 DNEFA (mmol/l) DWeek 12-baseline 20·01 0·13 20·02 0·18 0·01 0·14 20·01 0·19 20·02 0·13 20·03 0·19 DWeek 24-baseline 20·05 0·16 20·07 0·15 20·00 0·14 20·05 0·12 20·08 0·17 20·08 0·17 Db-Hydroxybutyrate (mmol/l) DWeek 12-baseline 16·9 63·9 14·1 89·6 9·5 43·0 20·1 118·0 22·6 76·4 9·4 62·1 DWeek 24-baseline 15·8 109·4 5·0 56·1 44·9 117·5 18·2 66·8 24·7 100·5 24·7 45·7 DLBP (mg/ml) DWeek 12-baseline 0·1 3·7 20·5 4·2 0·0 3·0 21·4 2·7 0·1 4·1 0·1 5·0 DWeek 24-baseline 0·1 3·6 0·2 5·1 0·6 2·2 20·2 5·0 20·2 4·4 0·5 5·3 DCRP (mg/l) DWeek 12-baseline 0·1 4·4 21·2 5·4 20·7 4·8 20·8 2·6 0·7 4·1 21·5 6·8 DWeek 24-baseline 20·1 4·3 20·5 5·7 21·5 4·3 0·9 5·6 0·8 4·2 21·5 5·7
LPR, Lactobacillus rhamnosus CGMCC1.3724; LBP, lipopolysaccharide-binding protein; CRP, C-reactive protein. * Mean values were significantly different from those of the placebo group (P, 0·01).
Lactobacillus rhamnosus and body weight 1515
British Journal of Nutrition
https:/www.cambridge.org/core/terms
.
https://doi.org/10.1017/S0007114513003875
Downloaded from
https:/www.cambridge.org/core
. University of Basel Library
, on
10 Jul 2017 at 15:49:32
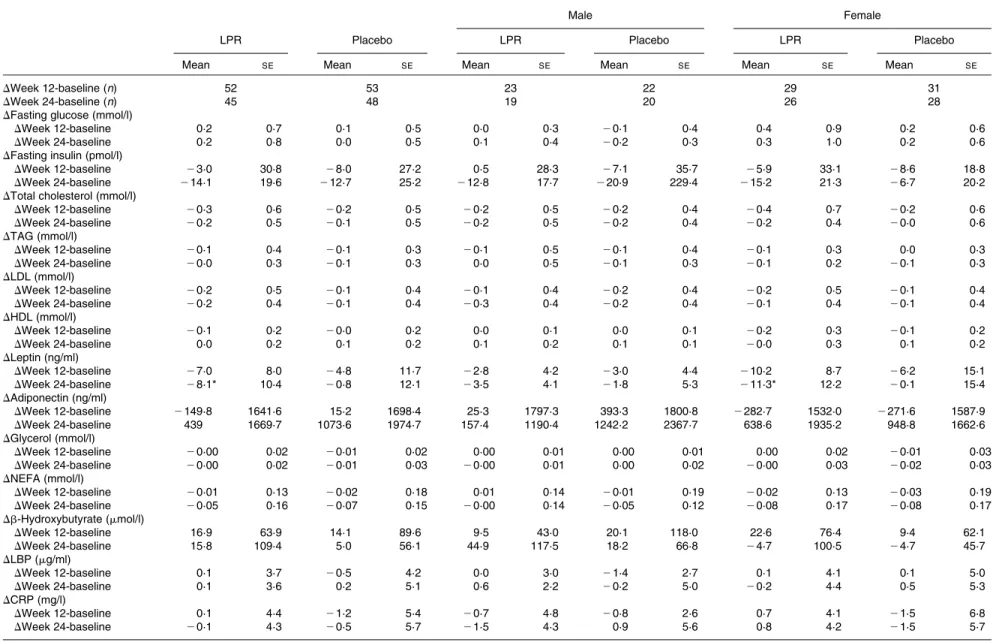
represented only a tiny fraction of the global microbiota (0 % in males v. 0·4 % in females; with P¼ 0·03 and P¼ 0·05 for V123 and V456, respectively). In males, the LPR treatment did not affect the microbiota composition at any time point, except for a low-abundance unclassified taxonomic group belonging to the Firmicutes phylum that was quantified at week 12 at a slightly higher relative abundance in the placebo group than in the LPR group (0·1 % in the placebo group v. 0 % in the LPR group, as detected by V123 with P¼ 0·01; 0·5 % in the pla-cebo group v. 0·2 % in the LPR group, as detected by V456 with P¼ 0·02). Interestingly, in females, the relative abundance of bacteria of the Lachnospiraceae family, a dominant taxo-nomic group, was consistently reduced in the LPR group at week 12 (36·9 % in the placebo group v. 30·3 % in the LPR group, as detected by V123 with P¼ 0·009; 32·9 % in the pla-cebo group v. 24·5 % in the LPR group, as detected by V456 with P¼ 0·001) and week 24 (38·2 % in the placebo group v. 27·6 % in the LPR group, as detected by V123 with P¼ 0·001; 32·6 % in the placebo group v. 24·5 % in the LPR group, as detected by V456 with P¼ 0·03). The results obtained for the relative abundance of bacteria of the Lachnospiraceae family with V123 are shown in Fig. 4. Differences in the abundance of members of the Lachnospiraceae family were essentially driven at the genus level by bacteria classified in the Roseburia genus and unclassified in the Lachnospiraceae family, although none reached the statistical significance threshold (data not shown). The only other significant difference detected between the LPR-treated and placebo-treated females was a reduction in the abundance of bacteria of the Subdoligranulum genus detected at week 12 (4·8 % in the placebo group v. 2·9 % in the LPR group, as detected by V123 with P¼ 0·01; 4·1 % in the placebo group v. 2·5 % in the LPR group, as detected by V456 with P¼ 0·02). This taxonomic group belongs to the closely related Ruminococcaceae family.
Faecal Lactobacillus rhamnosus CGMCC1.3724 detection
Faecal LPR was quantified by real-time PCR using strain-specific primers and TaqMan probes. At week 12, the percentage of subjects with detectable LPR in the faeces increased to 90 % in the treated group, whereas in the placebo group, only 10 % of the subjects showed LPR-positive signals
(Fig. 5; Fisher’s exact test P, 0·001). A similar percentage of subjects with detectable faecal LPR were observed at week 24 (Fig. 5; Fisher’s exact test P, 0·001). The faecal abundance of LPR in the LPR-positive subjects in the treated group was similar at weeks 12 and 24 (week 12: 7·7 (SE 1·1) £ 106 genome equivalents/g faeces; week 24: 5·4 (SE 0·9) £ 106 genome equivalents/g faeces). At week 12, the percentage of detectable faecal LPR was similar in males and females (90·9 and 90·0 %, respectively; Fisher’s exact test P¼1), whereas at week 24, it was slightly lower in males than in the females (77·8 and 85·7 %, respectively; Fisher’s exact test P¼0·424).
Dropout rate
As shown in Fig. 1, the dropout rate was less than 25 %. The main reason given by the dropouts was the lack of time. There was one participant who was excluded because of the poor compliance to the treatment (more than three consecutive days without the treatment). No adverse events were reported as a dropout reason. There was no significant difference between the two groups for the dropout rate.
8 7 6 5 4
Log (copies/sample unit)
3 2 1 0
Baseline Week 12 Week 24
QL
Placebo LPR Placebo LPR Placebo LPR
Fig. 4. Faecal Lactobacillus rhamnosus CGMCC1.3724 (LPR) content in male (X) and female (W) subjects in the placebo and LPR groups measured at baseline, week 12 and week 24. Data represent individual faecal contents. A 2 log (copies/sample unit) value was arbitrarily attributed to measures below the quantification limit (QL) as defined in the Methods section. Zero values correspond to subjects with undetectable faecal LPR by quantitative PCR.
45
(a) (b)
40
35
30
Relative abundance (%) Relative abundance (%)
25 0 12 Time (weeks) 24 45 40 35 30 25 0 12 Time (weeks) 24 ** **
Fig. 3. Evolution of the relative abundance (%) of bacteria of the Lachnospiraceae family in (a) males and (b) females in the placebo group (W) and the probiotic group (X) at week 0, week 12 and week 24. Values are medians, with their standard errors represented by vertical bars. ** Median values were significantly differ-ent from those observed with the placebo treatmdiffer-ent (P, 0·01).
British
Journal
of
Discussion
Obesity is a multifactorial problem that requires the consider-ation of numerous relevant factors when designing a potential successful intervention. Recent literature provides evidence that gut microflora might be involved in the aetiology of obesity. In this regard, we conducted the present study to evaluate the impact of a LPR formulation on body weight and fat mass in obese men and women.
During the energy-restriction period, administration of the LPR formulation did not significantly decrease the body weight or fat mass of an obese population regrouping men and women. However, at the end of the weight-maintenance phase, the LPR group tended to lose more fat mass than the placebo group. A subgroup analysis revealed that the observed trend was mainly driven by a significant reduction in fat mass in women. Analysis of the sex-specific results revealed significantly higher body-weight and fat mass losses promoted by the LPR treatment at the end of the energy-restriction phase and after the weight-maintenance phase in women but not in men. Measurements of the abundance and prevalence of LPR in faeces of the placebo and LPR groups indicated good treatment compliance and did not reveal any significant difference between the sexes.
Our clinical experience indicates that men are generally more prone to respond to a negative-energy balance interven-tion than women, be it in response to an exercise-training programme(38), a diet – exercise programme(39), or a session of exercise and of mental work(40). This is concordant with the results of the present study showing higher weight loss in men in the placebo group than in the women. The fact that the LPR supplementation abolished this difference suggests that the gut microbiota may be involved in the LPR-induced effect. At baseline, only a single low-abundance taxo-nomic group (Prevotellaceae) showed significantly different abundance levels between the sexes. The small difference observed in the present study between men and women is in agreement with the findings of previous studies investigating
sex-associated signatures, generally reporting only minor and inconsistent differences(41 – 43). Consequently, the baseline microbiota composition is unlikely to explain the sex-specific responses to the LPR treatment. Interestingly, whereas the LPR treatment did not induce any major change in the microbiota composition in men, the abundance of bacteria of the Lachnospiraceae family was substantially and significantly reduced by the LPR treatment in women at both week 12 and week 24. The Lachnospiraceae family belongs to the Firmicutes phylum, a taxonomic group that has previously been reported to be positively associated with obesity(6,9,10). However, associations between microbiota composition and obesity show only limited consistency between independent studies(44), making it difficult to identify specific bacterial groups that could contribute to the obese phenotype. Both posi-tive and negaposi-tive associations have been reported between the intestinal levels of Lachnospiraceae family members and obesity(45,46). Taken together, these observations suggest that bacteria of the Lachnospiraceae family might play a role in obesity and that the seeming contradictions may be due to differences in hosts (human and mouse), conditions (age, diet, etc.) and techniques used to measure the microbiota com-position. Interestingly, alterations in the abundance of bacteria of the Lachnospiraceae family (enrichment of an unknown Lachnospiraceae family member and reduction in the abun-dance of the Roseburia species) and an increased abunabun-dance of an unknown bacterium closely related to the Subdoligranulum genus have also been reported in association with type 2 diabetes in a human metagenomic study(12). Similar results have been obtained in another type 2 diabetes human study carried out using 16S profiling(47), suggesting a progressive modification of the microbiota composition from obese individ-uals losing weight on dietary restriction to obese individindivid-uals with type 2 diabetes through healthy obese individuals. It is worth noting that the taxonomic groups identified in the present study are among the most important intestinal producers of SCFA derived from carbohydrate fermentation(48). Among other mechanisms, these compounds have been proposed as mediators of the interaction between gut microbes and the host in the regulation of energy metabolism(49,50).
In addition to its effect on weight and fat mass loss, the LPR formulation reduced by about 25 % circulating leptin concentrations at the end of the weight-maintenance phase. Statistical analysis correcting for fat mass loss between baseline and week 24 revealed that circulating leptin concen-trations were regulated independently of fat mass reduction. These data suggest that LPR could lower plasma leptin concentrations directly or through changes in the microbiota composition or function. Interestingly, the relative abundance of bacteria of the Lachnospiraceae family has been reported to be positively associated with circulating leptin concentrations in mice after weight loss(45). Reductions in plasma leptin concentrations were preferentially observed in women who had about 3-fold higher baseline leptin concentrations than in men (Table 1), suggesting that LPR was more prone to reduce leptin concentrations in elevated leptin concentration conditions. Since the SCFA stimulate leptin production in adipocytes(51), the reduction in the abundance of SCFA
W0 0·4
0·2
Average weighted UniFrac distance
0 W12 W24 W0 v. W12 W0 v. W24
Fig. 5. Comparisons of the weighted UniFrac distances between samples ( ) collected during each period (W0, baseline; W12, week 12; W24, week 24) and between paired samples collected from the same subjects ( ) at the end of the weight-loss period (W12, week 12) and the end of the trial (W24, week 24). Values are means, with their standard errors represented by vertical bars.
Lactobacillus rhamnosus and body weight 1517
British
Journal
of
Nutrition
https:/www.cambridge.org/core/terms. https://doi.org/10.1017/S0007114513003875
producers belonging to the Lachnospiraceae family and Subdoligranulum genus observed in the LPR-treated women may explain the reduction in circulating leptin concentrations. No significant changes in other physiological, metabolic and inflammatory markers of the metabolic syndrome were observed in the treated group. The absence of changes in the plasma metabolic and inflammatory markers may be explained by the fact that the inclusion and exclusion criteria used in the present study prevented the recruitment of sub-jects displaying an unhealthy metabolic profile. This does not exclude that LPR can improve the condition of obese indi-viduals exhibiting the metabolic syndrome, but the present results suggest that these potential benefits are at least limited in metabolically healthy individuals.
It is well established that a major difficulty related to obesity management is the capacity to maintain body weight after sig-nificant weight loss. This is concordant with the findings of studies showing that body-weight and fat mass losses favour a greater-than-predicted decrease in energy expenditure(52,53) and a significant increase in hunger feelings(54). Thus, in a reduced obese state, it is essential that some lifestyle changes be made to compensate for the trend towards weight regain. In the present study, recommendations of healthy eating at the end of the weight-loss phase (phase 1) appeared to be successful in men in the placebo group as well as in the two groups of subjects who continued the LPR supplementation. In contrast, fat regain was observed in women in the placebo group during the weight-maintenance phase, suggesting that probiotics may help obese women to maintain healthy body weight.
It is important to mention that there was probably no independent prebiotic effect in the LPR group considering that 600 mg of daily dose of inulin and oligofructose (70:30, v/v) included in the LPR capsules are not sufficient to exert an effect on weight loss. In contrast, in a study, a daily dose of 16 g of inulin – oligofructose (50:50, v/v) in obese women led to changes in the gut microbiota composition that were of a magnitude similar to that observed in the present study, but of different orientation or in different taxonomic groups, and without a significant effect on body weight(55). Even if a slight impact on gut microbiota composition cannot be excluded, it is unlikely that weight loss observed in the LPR group can be attributed to the prebiotic mix contained in the capsules. Fibres were used to increase probiotic survival in the gastric (low pH) and duodenal (presence of bile salts) conditions, thereby supporting probiotic functionalities.
In summary, the present study demonstrates that LPR supplementation can accentuate body-weight loss in women submitted to energy restriction. This effect persisted in the subsequent maintenance phase when energy restriction was not imposed further. Thus, LPR supplementation seems to help obese women to maintain healthy body weight. Further research is needed to provide mechanistic explanations of this effect on energy balance.
Acknowledgements
The authors thank Lucie Brunelle, Marlene Gagnon-Sweeney and Sabrina Turgeon for their contribution to data collection,
Ste´phane Duboux and Alain Frachebout for their contribution to probiotic formulation preparation, and the nurse team.
The present study was sponsored by The Nestle´ Research Center (Lausanne, Switzerland). The funder contributed to the study design and carried out the analysis of the faecal samples and some blood samples. In addition, some members of The Nestle´ Research Center contributed to the preparation of the manuscript.
The authors’ contributions are as follows: M. S. wrote the manuscript; A. T., C. D., V. D., S. E.-A., M. L., E. R., C. N.-B., B. B., L. P., C. A.-Z., P. L., G. C., E. S., A. M. and J. D. prepared the manuscript; C. N.-B. conducted the bioinformatics analysis; S. E.-A. and M. L. conducted the statistical analyses; C. A.-Z., G. C., A. M. and E. S. conducted the blood marker analyses; P. L. performed faecal probiotic quantification.
None of the authors has any conflicts of interest to declare.
References
1. Hill JO & Peters JC (1998) Environmental contributions to the obesity epidemic. Science 280, 1371 – 1374.
2. Turnbaugh PJ & Gordon JI (2009) The core gut microbiome, energy balance and obesity. J Physiol 587, 4153 – 4158. 3. Hildebrandt MA, Hoffmann C, Sherrill-Mix SA, et al. (2009)
High-fat diet determines the composition of the murine gut microbiome independently of obesity. Gastroenterology 137, 1716 – 1724.e1 – 2.
4. Wu GD, Chen J, Hoffmann C, et al. (2011) Linking long-term dietary patterns with gut microbial enterotypes. Science 334, 105 – 108.
5. Jumpertz R, Le DS, Turnbaugh PJ, et al. (2011)
Energy-balance studies reveal associations between gut microbes, caloric load, and nutrient absorption in humans. Am J Clin Nutr 94, 58 – 65.
6. Ley RE, Turnbaugh PJ, Klein S, et al. (2006) Microbial ecol-ogy: human gut microbes associated with obesity. Nature 444, 1022 – 1023.
7. Brugman S, Klatter FA, Visser JT, et al. (2006) Antibiotic treat-ment partially protects against type 1 diabetes in the Bio-Breeding diabetes-prone rat. Is the gut flora involved in the development of type 1 diabetes? Diabetologia 49, 2105 – 2108. 8. de La Serre CB, Ellis CL, Lee J, et al. (2010) Propensity to high-fat diet-induced obesity in rats is associated with changes in the gut microbiota and gut inflammation. Am J Physiol Gastrointest Liver Physiol 299, G440 – G448. 9. Ley RE, Backhed F, Turnbaugh P, et al. (2005) Obesity alters
gut microbial ecology. Proc Natl Acad Sci U S A 102, 11070 – 11075.
10. Turnbaugh PJ, Ley RE, Mahowald MA, et al. (2006) An obes-ity-associated gut microbiome with increased capacity for energy harvest. Nature 444, 1027 – 1031.
11. Million M, Maraninchi M, Henry M, et al. (2012) Obesity-associated gut microbiota is enriched in Lactobacillus reuteri and depleted in Bifidobacterium animalis and Methano-brevibacter smithii. Int J Obes (Lond) 36, 817 – 825. 12. Qin J, Li Y, Cai Z, et al. (2012) A metagenome-wide association
study of gut microbiota in type 2 diabetes. Nature 490, 55 – 60. 13. Karlsson FH, Tremaroli V, Nookaew I, et al. (2013) Gut meta-genome in European women with normal, impaired and diabetic glucose control. Nature 498, 99 – 103.
14. Duncan SH, Lobley GE, Holtrop G, et al. (2008) Human
colonic microbiota associated with diet, obesity and weight loss. Int J Obes (Lond) 32, 1720 – 1724.
British
Journal
of
15. Schwiertz A, Taras D, Schafer K, et al. (2010) Microbiota and SCFA in lean and overweight healthy subjects. Obesity (Silver Spring) 18, 190 – 195.
16. Zhang H, DiBaise JK, Zuccolo A, et al. (2009) Human gut
microbiota in obesity and after gastric bypass. Proc Natl Acad Sci U S A 106, 2365 – 2370.
17. Arora T, Singh S & Sharma RK (2013) Probiotics: interaction with gut microbiome and antiobesity potential. Nutrition 29, 591 – 596.
18. Kadooka Y, Sato M, Imaizumi K, et al. (2010) Regulation of abdominal adiposity by probiotics (Lactobacillus gasseri SBT2055) in adults with obese tendencies in a randomized controlled trial. Eur J Clin Nutr 64, 636 – 643.
19. Omar JM, Chan Y-M & Jones ML (2012) Lactobacillus
fermentum and Lactobacillus amylovorus as probiotics alter body adiposity and gut microflora in healthy persons. J Funct Food 5, 116 – 123.
20. Ilmonen J, Isolauri E, Poussa T, et al. (2011) Impact of dietary counselling and probiotic intervention on maternal anthro-pometric measurements during and after pregnancy: a randomized placebo-controlled trial. Clin Nutr 30, 156 – 164.
21. Firmansyah A, Dwipoerwantoro PG, Kadim M, et al. (2011)
Improved growth of toddlers fed a milk containing synbio-tics. Asia Pac J Clin Nutr 20, 69 – 76.
22. Rautava S, Kainonen E, Salminen S, et al. (2012) Maternal probiotic supplementation during pregnancy and breast-feeding reduces the risk of eczema in the infant. J Allergy Clin Immunol 130, 1355 – 1360.
23. Tremblay A, Sevigny J & Leblanc C (1983) The reproduci-bility of a 3-day dietary record. Nutr Res 3, 819 – 830. 24. Government of Canada (2005) The Canadian Nutrition File.
Ottawa, ON: Health Canada.
25. Weir JB (1949) New methods for calculating metabolic
rate with special reference to protein metabolism. J Physiol 109, 1 – 9.
26. Diabetes Quebec (2003) Guide d’alimentation pour la
personne diabe´tique (Meal Planning for People with Diabetes). Quebec, QC: Government of Quebec.
27. Slaughter MH, Lohman TG, Boileau RA, et al. (1988) Skinfold equations for estimation of body fatness in children and youth. Hum Biol 60, 709 – 723.
28. Richterich R & Dauwalder H (1971) (Determination of plasma glucose by hexokinase-glucose-6-phosphate dehydrogenase method). Schweiz Med Wochenschr 101, 615 – 618.
29. Bristow AF & Das RE (1988) WHO international reference reagents for human proinsulin and human insulin C-peptide. J Biol Stand 16, 179 – 186.
30. Imagawa K, Matsumoto Y, Numata Y, et al. (1998)
Deve-lopment of a sensitive ELISA for human leptin, using monoclonal antibodies. Clin Chem 44, 2165 – 2171. 31. Sutter V, Citron D & Finegold S (1980) Wadsworth Anaerobic
Bacteriology Manual, 3rd ed. St Louis: C.V. Mosby Co. 32. Junick J & Blaut M (2012) Quantification of human fecal
Bifi-dobacterium species by use of quantitative real-time PCR analysis targeting the groEL gene. Appl Environ Microbiol 78, 2613 – 2622.
33. Frank JA, Reich CI, Sharma S, et al. (2008) Critical evaluation of two primers commonly used for amplification of bacterial 16S rRNA genes. Appl Environ Microbiol 74, 2461 – 2470. 34. Hamady M, Walker JJ, Harris JK, et al. (2008) Error-correcting
barcoded primers for pyrosequencing hundreds of samples in multiplex. Nat Methods 5, 235 – 237.
35. Caporaso JG, Kuczynski J, Stombaugh J, et al. (2010) QIIME allows analysis of high-throughput community sequencing data. Nat Methods 7, 335 – 336.
36. Ahlroos T & Tynkkynen S (2009) Quantitative strain-specific detection of Lactobacillus rhamnosus GG in human faecal samples by real-time PCR. J Appl Microbiol 106, 506 – 514. 37. Corcoran BM, Stanton C, Fitzgerald GF, et al. (2005) Survival
of probiotic Lactobacilli in acidic environments is enhanced in the presence of metabolizable sugars. Appl Environ Microbiol 71, 3060 – 3067.
38. Tremblay A, Despres JP, Leblanc C, et al. (1984) Sex dimor-phism in fat loss in response to exercise-training. J Obes Weight Regul 3, 193 – 203.
39. Doucet E, Imbeault P, Almeras N, et al. (1999) Physical activity and low-fat diet: is it enough to maintain weight sta-bility in the reduced-obese individual following weight loss by drug therapy and energy restriction? Obes Res 7, 323 – 333. 40. Pe´russe-Lachance E, Brassard P, Chaput JP, et al. (2013) Sex differences in the effects of mental work and moderate-intensity physical activity on energy intake in young adults. ISRN Nutr 2013, 1 – 6.
41. Mueller S, Saunier K, Hanisch C, et al. (2006) Differences in faecal microbiota in different European study populations in relation to age, gender, and country: a cross-sectional study. Appl Environ Microbiol 72, 1027 – 1033.
42. Arumugam M, Raes J, Pelletier E, et al. (2011) Enterotypes of the human gut microbiome. Nature 473, 174 – 180. 43. Aguirre de Carcer D, Cuiv PO, Wang T, et al. (2011)
Numeri-cal ecology validates a biogeographiNumeri-cal distribution and gender-based effect on mucosa-associated bacteria along the human colon. ISME J 5, 801 – 809.
44. Ley RE (2010) Obesity and the human microbiome. Curr
Opin Gastroenterol 26, 5 – 11.
45. Ravussin Y, Koren O, Spor A, et al. (2012) Responses of gut microbiota to diet composition and weight loss in lean and obese mice. Obesity (Silver Spring) 20, 738 – 747.
46. Backhed F, Ding H, Wang T, et al. (2004) The gut microbiota as an environmental factor that regulates fat storage. Proc Natl Acad Sci U S A 101, 15718 – 15723.
47. Zhang X, Shen D, Fang Z, et al. (2013) Human gut micro-biota changes reveal the progression of glucose intolerance. PLoS ONE 8, 0071108.
48. Louis P & Flint HJ (2009) Diversity, metabolism and microbial ecology of butyrate-producing bacteria from the human large intestine. FEMS Microbiol Lett 294, 1 – 8. 49. Delzenne NM & Cani PD (2011) Interaction between obesity
and the gut microbiota: relevance in nutrition. Annu Rev Nutr 31, 15 – 31.
50. Clarke SF, Murphy EF, Nilaweera K, et al. (2012) The gut microbiota and its relationship to diet and obesity: new insights. Gut Microbes 3, 186 – 202.
51. Xiong Y, Miyamoto N, Shibata K, et al. (2004) Short-chain fatty acids stimulate leptin production in adipocytes through the G protein-coupled receptor GPR41. Proc Natl Acad Sci U S A 101, 1045 – 1050.
52. Leibel RL, Rosenbaum M & Hirsch J (1995) Changes in energy expenditure resulting from altered body weight. N Engl J Med 332, 621 – 628.
53. Doucet E, St Pierre S, Almeras N, et al. (2000) Changes in energy expenditure and substrate oxidation resulting from weight loss in obese men and women: is there an important contribution of leptin? J Clin Endocrinol Metab 85, 1550 – 1556.
54. Doucet E, Imbeault P, St-Pierre S, et al. (2000) Appetite after weight loss by energy restriction and a low-fat diet-exercise follow-up. Int J Obes Relat Metab Disord 24, 906 – 914. 55. Dewulf EM, Cani PD, Claus SP, et al. (2013) Insight into
the prebiotic concept: lessons from an exploratory, double blind intervention study with inulin-type fructans in obese women. Gut 62, 1112 – 1121.
Lactobacillus rhamnosus and body weight 1519
British
Journal
of
Nutrition
https:/www.cambridge.org/core/terms. https://doi.org/10.1017/S0007114513003875